Abstract
One of the best-characterized resistance mechanisms in acute myeloid leukemia (AML) is the drug extrusion mediated by P-glycoprotein (Pgp). Recently the results of workshops organized by several groups concluded that accurate measurement of low activity of Pgp is a difficult goal in clinical samples. Therefore, highly sensitive and specific assays were developed to assess the functionality of Pgp using JC-1, a fluorescent molecule with the different emission wavelength (green and red fluorescence) according to its concentration in 129 AML samples. It was shown that JC-1 (green and red bands) may define 3 groups of patients: resistant (R) (29% of patients), intermediate (I) (36%), and sensitive (S) (35%). In contrast, rhodamine 123 assay detected only the R group defined by JC-1. Nevertheless, the I group has an intermediate expression of Pgp (0.39, 0.29, and 0.19 for the R, I, and S groups, respectively, P = .002), an intermediate biologic profile (percentage of CD34, 95%, 67%, and 44%, respectively, P < .0001; in vitro resistance to daunorubicin, 94 μM, 20 μM, and 12 μM, respectively,P = .02), and an intermediate prognosis (achievement of complete remission, 55%, 65%, and 87%, P = .006; 3-year disease-free survival, 11%, 16%, and 36%, respectively,P = .005; and 3-year overall survival, 0%, 20%, and 51%, respectively, P < .0001). Therefore, JC-1 appeared to be a more convenient and simple way to detect a functional Pgp in clinical AML samples than rhodamine 123.
Introduction
Despite improvements accomplished in the 30 last years with the use of a combination of cytarabine (Ara-C) and intercalating agents, the overall prognosis of adult acute myeloid leukemia (AML) remains poor: the 5-year survival rate is only 35% using aggressive therapy, and most patients achieving complete remission (CR) relapse with resistant disease within 12 to 18 months.1 One of the best-characterized resistance mechanisms in AML is the drug extrusion mediated by P-glycoprotein (Pgp), the product of the multidrug resistance-1 (MDR1) gene, which has been shown to be associated with a poor outcome.2Recently, the results of workshops organized by several groups were published.3-6 One of the main conclusions was that accurate measurement of low levels of Pgp is a difficult goal in clinical samples. Nevertheless, even a weak activity of Pgp may lead to an MDR phenotype. Therefore, we need to develop highly sensitive and specific assays to assess the functionality of Pgp.
JC-1 is a carbocyanine liquid crystal–forming probe. This cationic dye was initially used for analysis of mitochondrial potential.7 JC-1 is a reliable probe for analyzing δψ changes occurring very early in apoptosis. Recently, we have shown that JC-1, a fluorescent molecule, is also a probe of Pgp.8 A specific property of JC-1, due to its stacking in a liquid crystal form, is the dependence of its fluorescence emission wavelength on its concentration.9 On excitation at 490 nm, JC-1 monomers display a cytoplasmic fluorescence emission centered at 537 nm (green band). Beyond a critical concentration, JC-1 aggregates in mitochondrium, thus leading to the emergence of an intense emission band centered at 597 nm (red band), in addition to the cytoplasmic green band. We have shown in cell lines8 that sensitive cells display both green and red fluorescence. In resistant cells, when Pgp activity increased, green fluorescence of JC-1 decreased and red fluorescence was lost. In intermediate-resistant cells, green fluorescence intensity was often identical to the fluorescence intensity of sensitive cells, but red fluorescence was already lost. We have concluded in this study that the red emission band of JC-1 appeared to be more convenient for detection of low-level resistance and more sensitive than rhodamine 123 (Rh123).8
Here, we report a functional assay using JC-1 in 129 AML samples.
Patients, materials, and methods
Patients
Between January 1995 and December 1998, 129 samples from de novo adult AML patients were successfully tested. The diagnosis was based on French-American-British (FAB) criteria.10,11Immunophenotyping was performed using flow cytometry. Acute promyelocytic leukemia patients were excluded from the study (because of retinoic acid treatment). Patients with t(9;22) were also excluded from the study. For each patient, several clinical and biologic characteristics were analyzed (age, white blood count [WBC] at diagnosis, WHO performance status, lactate dehydrogenase [LDH] level, CD34 and CD65 expression, cytogenetics, Pgp expression, and in vitro resistance to daunorubicin [DNR], etoposide, and Ara-C). Unfavorable karyotypes were defined as12 abnormalities of chromosomes 5 or 7, abnormalities of 11q2.3 band, or complex abnormalities. Inversion in chromosome 16 (inv 16) or t(8;21) indicated good prognosis, and the other karyotypes, including normal, indicated intermediate prognosis.
No patient had a history of prior therapies with anticancer drugs or a diagnosis of myelodysplasic syndrome. All patients in this study were given a combination of Ara-C + anthracycline ± etoposide. Antileukemic treatments were differentiated according to age but were similar.
Patients younger than 60 years received Ara-C (100 mg/m2/d) for 10 days, either DNR (45 mg/m2/d) or idarubicin (10 mg/m2/d) or mitoxantrone (7 mg/m2/d) for 3 days, and etoposide (100 mg/m2/d) for 5 days. The patients who achieved CR after 1 or 2 cycles of therapy received 1 cycle of consolidation therapy (with the same induction anthracycline). Patients achieving CR were subsequently scheduled to proceed to allogeneic bone marrow transplantation if a matched sibling donor was available (13 patients); patients older than 45 years or lacking a suitable donor received an autograft.
Patients older than 60 years were given a combination of Ara-C (100 mg/m2/d) for 10 days, mitoxantrone (7 mg/m2/d) for 3 days or DNR (45 mg/m2/d) for 3 days, ± etoposide (100 mg/m2/d) for 3 days. The patients who achieved CR after 1 or 2 cycles of therapy received 1 cycle of consolidation therapy (with the same induction anthracycline). Patients younger than 70 years achieving CR were subsequently scheduled to proceed to autograft; patients older than 70 years received a second course of consolidation therapy and maintenance therapy with low-dose Ara-C.
There was not a difference in clinical response (achievement of CR, disease-free survival [DFS], or overall survival [OS]) with differing induction regimens. In addition, the distribution of variables analyzed was not different between treatment regimens.
Level of Pgp expression
Pgp expression was measured by labeling fresh viable cells with the UIC2 (129 samples) and MRK16 (99 samples) monoclonal antibodies and with phycoerythrin-labeled second antibody as previously described.13 The expression of Pgp was established with blast cells selected by CD34 antibody (HPCA2 clone, Becton Dickinson, Le Pont de Claix, France) (2-color assays) or other markers (eg, CD33/CD7, CD33/CD2, CD33/CD19, or CD33/CD22 by 3-color assays) whenever possible or with physical characteristics only if blast cells did not express characteristic markers. Fluorescence was analyzed on a FACSort flow cytometer (Becton Dickinson). Protein staining of gated leukemic blasts was compared with the one of control cells by the means of the Kolmorogov-Smirnov test. This statistic, denoted D, measures the difference between 2 distribution functions and generates a value ranging from 0 to 1.0. A higher D value indicates a wider difference between the 2 functions, thus a strong expression of Pgp. As in another study,6 when MRK16 was compared with UIC2 antibody, a good correlation was observed (r = 0.9,P < .0001, n = 99). In addition, the results with UIC2 and MRK16 were similar. Therefore, only the results with UIC2 were presented.
Functional assay using rhodamine 123
As described previously,13 cells (5 × 10⁵) were stained with 200 ng/mL Rh123 for 20 minutes at 37°C in RPMI medium. The cells were washed twice in phosphate-buffered saline (PBS) and resuspended in Rh123-free medium and allowed to efflux for 60 minutes at 37°C, either with or without modulators of Pgp (cyclosporin A [CsA], 2 μM). At the indicated times, 1 × 10⁴ cells were taken for flow cytometry analysis. Samples were analyzed on a FACSort flow cytometer (Becton Dickinson). As for Pgp expression, the function of this protein was established with blast cells selected by antibodies or physical characteristics. Intensity of Rh123 fluorescence in presence or absence of CsA was compared using the Kolmorogov-Smirnov test. A higher D value indicates a wider difference between the 2 functions, thus a more resistant group of cells. A total of 61 samples were analyzed with this assay. In accordance with previous studies, a threshold of positivity of 0.2 (D value) was used to assess a positive activity of Pgp.13 14
Functional assay JC-1
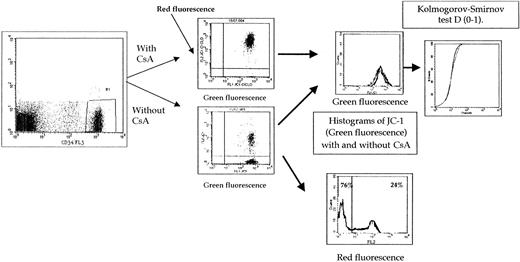
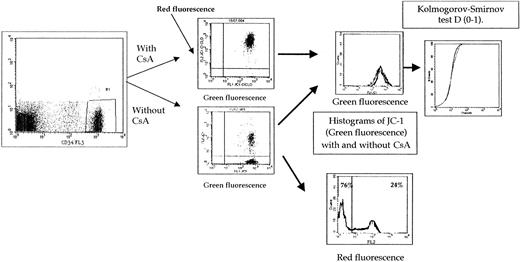
For staining, cells were washed twice and resuspended in PBS containing 0.1 μM JC-1 monomer at a concentration of 5 × 10⁵ cells/mL and incubated at 37°C for 15′ without or with modulator (CsA, 2 μM) to assess Pgp function. Cells were washed twice in cold PBS, and samples were analyzed. Cell fluorescence was recorded using a FACSort flow cytometer (Becton Dickinson) equipped with a 488-nm argon laser and 3 fluorescence detectors: FL1 (530-nm band-pass filter), FL2 (585-nm band-pass filter), and FL3 (650 nm band-pass filter). JC-1 fluorescences were analyzed on the FL1 and FL2 channels for detection of the fluorescence of the dye monomer and liquid crystal form, respectively. The function of Pgp was established with blast cells selected by CD34 antibody (FL3 channel; HPCA2 clone, Becton Dickinson) or with physical characteristics only if blast cells did not express characteristic markers. Results of 2 fluorescences were expressed as shown in “Results.”
MTT cytotoxicity test
In vitro cytotoxicity was measured as described previously.15 Previous studies using MTT assay for the prediction of chemoresistance in adult AML suggested that it may be helpful for risk-group stratification in adult AML15-17and that it has a strong value in the prediction of clinical response in childhood leukemias.18,19 Therefore, we used MTT assay to assess the in vitro resistance to drugs. In our previous study, patients who exhibited a high LC50 (lethal concentration 50%) of DNR or a high LC50 of Ara-C had a poorer prognosis than the other patients.15
In vitro sensitivity of cells to DNR, Ara-C, and etoposide was determined by planting 2 × 10⁵ cells in a 200 μL growth medium, without any specific growth factor, containing several dilutions of the drug in 96-well microtiter plates. Each concentration of drugs was repeated in 6 wells. After incubation for 3 days at 37°C with 5% CO2, cell viability was determined using the MTT assay as described by Kaspers et al.20 Briefly, 20 μL MTT (5 mg/mL in PBS) was added to each well and incubated for 6 hours. The medium and MTT were then removed from the wells by centrifugation, and formazan crystals were dissolved in 200 μL dimethyl sulfoxide. The absorbance was recorded in a microplate reader (Model MR5000, Dynatech Laboratories, Issy-Leo-Moulineaux, France) at the wavelength of 550 nm. The effect of drug on growth inhibition could be assessed as follows: percent of growth inhibition = 1−[(absorbance of drug treated cells/absorbance of untreated cells) × 100]. The LC50 was determined as the drug concentration that resulted in a 50% growth inhibition. Samples were considered evaluable if the drug-free control wells contained more than 80% of leukemic cells before and more than 70% of leukemic cells after 3 days of culture. The MTT assay gave reliable results under this conditions.20 Percentage of blast cells was determined by the May-Grünwald-Giemsa stain and by immunophenotyping, which was performed by flow cytometry.
Statistical analysis
The association between variables was analyzed by the Fisher exact test for categorical variables and by the Mann-WhitneyU test or Kruskal-Wallis test for continuous variables. Clinical and biologic factors were investigated for their influence on remission rate by the Fisher exact test for binary variables and by the Mann-Whitney U or Krushkal-Wallis tests for continuous variables. The rates of (1) DFS were measured from establishment of CR until relapse or death from any cause, with observation censored for patients last known alive without report of relapse, and (2) OS were measured from diagnosis until death from any cause, with observation censored for patients last known alive. Rates were estimated by the method of Kaplan and Meier21 and compared by the log-rank test. Analyses of prognostic factors for treatment outcomes were based on proportional hazards regression models for DFS and OS.22 Significance was defined as a 2-tailed Pvalue of ≤ .05. The Cox proportional model was used for the multivariate analyses on DFS and OS.22 The median follow-up time for censored patients was 810 days. The time point used for the proportion of DFS and OS was December 31, 1999. Patients were included in the study from January 1995 to December 1998.
Results
Functional tests of Pgp using Rh123 and JC-1 probes in AML samples
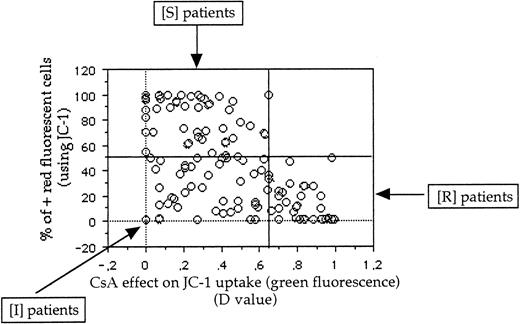
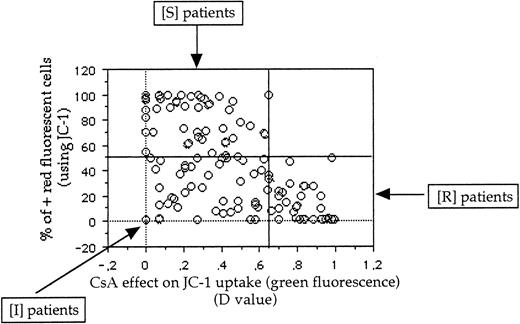
The expression of the results of both green and red JC-1 fluorescence intensities is summarized in Figure1. The correlation between functional tests using Rh123 and JC-1 (green fluorescence) was weak (rs = 0.52) (Figure 2). We and others,13,14 in previous studies, have used the threshold for positivity of 0.2 in the Pgp activity detection assay using Rh123. The threshold for positivity for JC-1 assay (green fluorescence) was 0.62 (Figure 2) when compared with the threshold for positivity of Rh123 functional assay. With these thresholds for positivity, all patients positive with Rh123 were positive with JC-1 (green fluorescence) (Figure 2). In a previous study8using JC-1 in cell lines, all samples positive in green fluorescence were positive in red fluorescence, and there were no samples positive in red fluorescence and negative in green fluorescence. Therefore, the threshold of positivity in red fluorescence was determined at 50% (Figure 3). Because δψ changes that occur during apoptosis are manifested also by a loss of red fluorescence and CsA can modify δψ changes,23-26 we initially have analyzed the results of red fluorescence intensity without CsA. But the results are very similar if the results of red fluorescence intensity are presented as (1) percentage of positive cells with CsA or percentage of positive cells, (2) absolute red fluorescence intensity, or (3) the ratio of red fluorescence with or without CsA. A strong correlation was observed between them.
Expression of results of both green and red JC-1 fluorescence intensities.
The function of Pgp was established with blast cells selected by CD34 antibody or by physical characteristics. Because delta psi changes that occur during apoptosis are manifested by a loss of red fluorescence and because CsA can modify delta psi changes, we initially analyzed the red fluorescence intensity without CsA. The results are very similar if the results of red fluorescence intensity are presented as (1) a percentage of positive cells with CsA or without CsA, (2) absolute red fluorescence intensity, or (3) ratio of red fluorescence with or without CsA.
Comparison between 2 Pgp functional assays (Rh123 and JC-1 [green fluorescence] with and without CsA).
We and others, in precedent studies, have used the threshold of positivity of 0.2 in the Pgp activity detection assay using Rh123. The threshold of positivity for JC-1 assay (green fluorescence) was 0.62 when compared with the threshold of positivity of Rh123 functional assay.
Comparison between green and red fluorescences of JC-1 probe.
In a previous study8 using JC-1 in cell lines, all samples positive in green fluorescence were positive in red fluorescence and no patients were positive in red fluorescence and negative in green fluorescence. Therefore, the threshold of positivity in red fluorescence was determined at 50%. Because δψ changes that occur during apoptosis are manifested also by a loss of red fluorescence and CsA can modify δψ changes, we initially analyzed the results of red fluorescence intensity without CsA. But the results are very similar if the results of red fluorescence intensity are presented as (1) percentage of positive cells with CsA or percentage of positive cells, (2) absolute red fluorescence intensity, or (3) the ratio of red fluorescence with or without CsA.
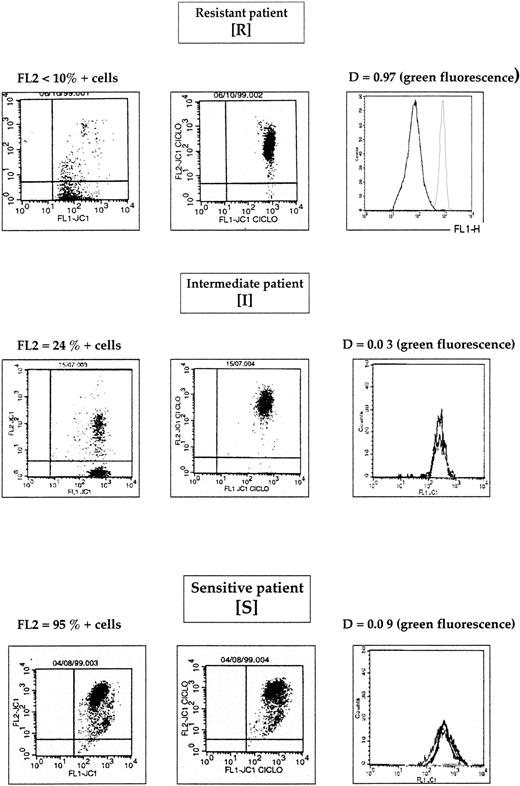
Therefore, using both green and red fluorescence intensities, we have defined 3 groups of patients: resistant (R), intermediate (I), and sensitive (S) (Figure 3). One example of R, I, and S patients is shown in Figure 4. These 3 groups of patients represented 38 patients (29%), 46 patients (36%), and 45 patients (35%), respectively.
Correlations among different functional tests and Pgp expression are summarized in Table 1. Pgp expression, as measured with UIC2 staining, was more highly correlated with red fluorescence of JC-1 (rs = 0.8) than with CsA-inhibited uptake of green fluorescence of JC-1 (rs = 0.55) or efflux of Rh123 (rs = 0.5). CsA-inhibited efflux of Rh123 was strongly correlated with CsA-inhibited efflux of green fluorescence intensity of JC-1 (rs = 0.88). In contrast, both JC-1 (green fluorescence) uptake and Rh123 efflux were weakly correlated with the percentage of red fluorescence cells using JC-1 (rs = 0.4 and rs = 0.45, respectively).
Functional test of Pgp using both red and green fluorescences, biologic characteristics, and treatment outcome of 129 AML samples
The 3 groups of patients defined above have a different biologic profile and a different prognosis (Table2). The biologic characteristics for the 3 groups (R, I, and S) were Pgp expression (mean value), 0.39 ± 0.24, 0.29 ± 0.22, and 0.19 ± 0.20, respectively,P = .002; CD34+ cases, 95%, 67%, and 44%, respectively, P < .0001; and CD65+ cases, 14%, 41%, and 50%, respectively, P = .01. In R patients, 3% have a good prognostic cytogenetic, 63% an intermediate cytogenetic, and 34% a poor cytogenetic. In I patients, 19% have a good cytogenetic, 69% an intermediate cytogenetic, and 12% a poor cytogenetic. In S patients, 24% have a good cytogenetic, 57% an intermediate cytogenetic, and 19% a poor cytogenetic (P = .03) (Table 2). These 3 groups also have a different in vitro resistance to DNR (inhibitory concentration of 50% = 94 ± 145 × 10−8 M, 20 ± 25 × 10−8 M, and 12 ± 13 × 10−8 M, respectively, P = .02), etoposide (2131 ± 2858 × 10−8 M, 1731 ± 2109 × 10−8 M, and 839 ± 887 × 10−8 M, respectively,P = .04), and Ara-C (1781 ± 3333 × 10−8M, 572 ± 472 × 10−8 M, and 444 ± 543 × 10−8 M, respectively,P = .02) (Table 2). The other characteristics—age, WHO performance status, WBC count at diagnosis, and LDH level—were not different between the 3 groups (Table 2). Interestingly, S and I patients have the same CsA effect on Rh123 efflux (0.10 ± 0.11 vs 0.10 ± 0.08, not significant) (Table 2). Therefore, this functional test (Rh123 assay) did not detect this subgroup of I patients. In contrast, there was a difference between R patients and both I and S patients (0.41 ± 0.17 vs 0.10 ± 0.11, P < .0001, and 0.41 ± 0.17 vs 0.10 ± 0.08, P < .0001, respectively).
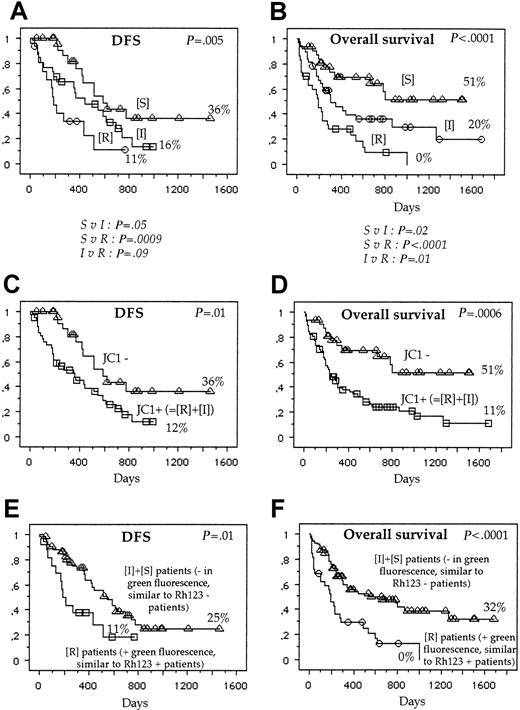
The achievement of CR was, for the R group, 55%; I group, 65%; and S group, 87% (P = .006) (Table 2). The 3-year DFS was, for the R group, 11%, median = 180 days; I group, 16%, median = 371 days; and S group, 36%, median = 580 days (P = 0.005) (Figure 5). The 3-year OS was, for the R group, 0%, median 189 days; I group, 20%, median 300 days; and S group, 51% (P < .0001) (Figure 5).
Survival.
DFS and OS of S, I, and R patients (A,B), R+I patients versus S patients (C,D); and S+I patients (correspond to negative patients with Rh123 assay) versus R patients (correspond to positive patients with Rh123 assay) (E,F).
Survival.
DFS and OS of S, I, and R patients (A,B), R+I patients versus S patients (C,D); and S+I patients (correspond to negative patients with Rh123 assay) versus R patients (correspond to positive patients with Rh123 assay) (E,F).
When we pooled R and I patients, the achievement of CR was 61% in positive patients (R+I) versus 87% in negative patients (S), (P = .002); the 3-year DFS was 12% versus 36% (P = .01), and the 3-year OS was 11% versus 51% (P = .0006) (Figure 5).
When we pooled I and S patients, the achievement of CR was 55% in R patients versus 76% in S+I patients (P = .02); the 3-year DFS was 19% versus 25%, respectively (P = .01); and the 3-year OS was 0% versus 32% (P < .0001) (Figure 5).
Other clinical and biologic characteristics and treatment outcome
Table 3 shows other clinical and biologic characteristics and treatment outcome. DFS decreased significantly with increasing age (P = .02). Cytogenetics and level of Pgp also influenced DFS (P = .01 and P = .02, respectively). OS decreased significantly with increasing age (P < .0001), with increasing level of Pgp expression (P = .0007), and with increasing WHO performance status (P = .01). Achievement of CR, cytogenetics, and different treatments influenced OS also (P < .0001,P = .005, and P = .001, respectively).
Multivariate analysis
In the multivariable model (Table3), we have included all the significant variables. In one model we have included, for DFS, age, cytogenetics, JC-1 (R vs I+S), and Pgp expression. All of these variables, except Pgp expression, were independent (P = .03,P = .04, and P = .03, respectively). In another model, we have included age, cytogenetic, JC-1 (R+I vs S), and Pgp expression. All of these variables, except Pgp expression, were also independent (P = .02, P = .04, andP = .01, respectively).
For OS, the models included achievement of CR, age, cytogenetics, WHO performance status, consolidation treatment, Pgp expression, and either JC-1 (R vs I+S) or JC-1 (R+S vs S). In both models, either achievement of CR (< .0001) and JC-1 (R vs I+S) (P = .0002) or achievement of CR (P < .0001) and JC-1 (R+I vs S) (P = .02) were statistically significant.
Discussion
Twenty-five years after the first description of Pgp by Ling,27,28 the role of this protein is controversial in AML.29 A novel sensitive functional assay may help us have a better understanding of the role of Pgp in AML, because the fluorochromes most frequently used for clinical diagnosis are generally not sensitive enough for the detection of low-level resistant cells, frequently isolated in clinical samples. According to our previous experience in cell lines,8 we first described the advantage of JC-1, and we have studied Pgp activity using JC-1 probe in 129 AML samples.
In our study, using this functional test, two thirds of our de novo AML expressed an active Pgp. One third of the patients were classified as R and correspond to the percentage of patients with dye efflux using Rh123 assay. One third of patients were classified as I with JC-1 uptake. These patients could not be recognized by Rh123 assay. However, these I patients have an expression of Pgp and biologic characteristics (CD34; CD65; in vitro resistance to DNR, etoposide, and Ara-C; and cytogenetics) between the R and S groups of patients. These biologic parameters (CD34, CD65, in vitro resistance to DNR and etoposide, and cytogenetics) have been reported to be correlated with Pgp activity.2,14,15,30-32 In addition, the proportion of treatment failures after conventional induction treatment in this I group fall also between the S and the R groups. Therefore, we are able to detect Pgp activity in the two thirds of the patients with our assay (I+R patients), a percentage higher than that observed with classical dye efflux assays. In the large studies of Leith et al, 41% of young patients14 and 58% of elderly patients30 were efflux-positive using Di(OC)2 and Rh123. In our previous study, 32% of patients were positive using calcein-AM with or without CsA.15 In other recent studies, the percentage of positive patients ranged from 26% to 50% (Table4).33-35 These agree with the percentage of our R patients (30%). Therefore, with a more sensitive functional test than Rh123, we have defined a subgroup of patients with an intermediate prognosis, biology, and Pgp expression not recognized with the Di(OC)2 or calcein-AM assays.
As in cell lines, Rh123 has a good fluorescence quantum yield but a non-negligible fraction of the dye binds to cell membranes,36 leading to high fluorescence background, which could partially explain why there is some difficulty in distinguishing cells with low levels of resistance from sensitive ones. With this dye better results are obtained from a fluorescent assay based on efflux rather than uptake.4-6 Such efflux procedures are more time-consuming and more complicated to analyze. In the case of JC-1, we did not have to deal with fluorescence background because filtration allowed J-aggregates to be eliminated from the buffer prior to incubation with the cells. Under these conditions, all the red fluorescence detected resulted from the liquid crystals formed within mitochondria.9 This unique property allows a sensitive functional assay to be performed based on monitoring J-aggregate formation from their specific red fluorescence. This assay does not require any washing step or additional efflux monitoring. In the same way, using calcein-AM uptake assay (another probe of Pgp), we have shown13 that the ratio of fluorescence with or without CsA, to assess Pgp activity, was weak between “positive” and “negative” samples (from 1 to 3). Therefore, with this probe there is also some difficulty in distinguishing cells with low levels of resistance from sensitive ones.
Other alternative MDR-associated proteins such as MRP1 or Mvp/LRP may also contribute to drug resistance in AML.37-39 In cell lines, we have found that JC-1 was not a substrate of MRP1 (unpublished data, 2000), as were Rh123 and calcein-AM. In addition, the correlation between Pgp expression and JC-1 (red fluorescence) is higher than between Pgp expression and Rh123. Therefore, the specificity of JC-1 for Pgp is also probably higher than Rh123.
In AML, MDR-reversing agents such as valspodar can increase the intracellular efficacy concentrations of anticancer drugs in vivo40; this does not necessarily lead to improved treatment results.41,42 In in vitro systems, increased anticancer drug concentration in Pgp+ tumor cells generally results in increased cell death. In the clinical situation, the problem is more complex. Tumor cells may develop additional mechanisms for resistance, such as altered regulation of apoptosis.43 If this occurs, increasing the intracellular concentration of the anticancer drug may not be sufficient to overcome resistance. This is more likely at advanced stages of the disease,42 and the major benefit of MDR-reversing agents might be in patient groups with low levels of markers for resistance or early in patients not heavily treated. Therefore, a very sensitive and specific Pgp functional test such as JC-1 can help to select patients who may benefit from MDR-reversing agents.
In recent publications, the role of Pgp as a regulator of apoptosis has been emphasized.44-46 The authors have shown that cells induced to express Pgp either by drug selection or by retroviral gene transduction with MDR1 cDNA are resistant to cell death induced by a wide range of death stimuli that activate the caspase apoptotic cascade. However, Pgp-expressing cells were not resistant to caspase-independent cell death mediated by pore-forming proteins and granzyme B.44-46 JC-1 is both a substrate of Pgp and is reported to provide more accurate estimates of mitochondrial transmembrane potential (decrease in mitochondrial transmembrane potential is one of the early events of apoptosis) than Rh123 or DiOC6 (3).26 It could be used to test both of these cellular functions. Evaluation of the JC-1 assay, as a probe of Pgp activity and drug-induced apoptosis together, is underway in our laboratory.
Therefore, JC-1 is a very sensitive novel functional assay that may help us reach a better understanding of the role of Pgp. As in cell lines, the red emission band of JC-1 appeared to be more convenient for detection of low-level resistance in AML than other probes, such as Rh123 or calcein-AM.
Supported in part by a grant from Délégation à la Recherche Clinique (grant TBI 97015).
The publication costs of this article were defrayed in part by page charge payment. Therefore, and solely to indicate this fact, this article is hereby marked “advertisement” in accordance with 18 U.S.C. section 1734.
References
Author notes
Ollivier Legrand, Hôpital Hôtel Dieu, 1 place du parvis Notre Dame, service d'hématologie, 75181 Paris Cedex 04, France; e-mail: olivier.legrand@htd.ap-hop-paris.fr.

![Fig. 2. Comparison between 2 Pgp functional assays (Rh123 and JC-1 [green fluorescence] with and without CsA). / We and others, in precedent studies, have used the threshold of positivity of 0.2 in the Pgp activity detection assay using Rh123. The threshold of positivity for JC-1 assay (green fluorescence) was 0.62 when compared with the threshold of positivity of Rh123 functional assay.](https://ash.silverchair-cdn.com/ash/content_public/journal/blood/97/2/10.1182_blood.v97.2.502/5/m_h80210586002.jpeg?Expires=1767234641&Signature=P1AVkgIcMgKJ3c1tb9TifIGHxfdJTeq7Ctx-vts1wXnTBAIT3zidEG9JjBgXPr8WNn2wE7d7dIdthiqo4RgQdWTJL~~y3h9Cblk4LEwGVkQwltrVPlKLx43jb3NCsrxTo3V3sx9jvVUsyDdcalVtBNT6VZRcnQNXQ2Xm~WreHo98embZ6BJq4MX-Jd-A6x0wcHnhfvnm31Mq19Ey31HQoNX5~caUDyntccsHca-IiBbe84ouqe-1e-FUXDjFFRvax1bGbqdVAEz4wV--NtbgslG3DZEZAIdUEs7z3XLgxjJlAJbOrTzGe48pHHN~nLl09H9wLprfAUY-JX0PaJuLbg__&Key-Pair-Id=APKAIE5G5CRDK6RD3PGA)

![Fig. 2. Comparison between 2 Pgp functional assays (Rh123 and JC-1 [green fluorescence] with and without CsA). / We and others, in precedent studies, have used the threshold of positivity of 0.2 in the Pgp activity detection assay using Rh123. The threshold of positivity for JC-1 assay (green fluorescence) was 0.62 when compared with the threshold of positivity of Rh123 functional assay.](https://ash.silverchair-cdn.com/ash/content_public/journal/blood/97/2/10.1182_blood.v97.2.502/5/m_h80210586002.jpeg?Expires=1767234642&Signature=o7hyD9BL2CFmgxcEV-26uv6gcQStMrulUkSdmkwGKU9ViMNuQxDu5VBWzTi9G2OawmMqm3OS5k~FoF2tS64eTdYouNRIxX9bdboenSHyWXyv3aUrtQhxiFfLh75Pw7zBp-Kh8T6mWTsIPp9jByYETvnHyY~1wAjuKZeXP9RD~qvqGvv1BTlAkN3yM1MHlf9jBeHHR7c9Kg9KoHYOp-i~lZFOolohCgyzrfYIcDF8XkwN7r4GJeYmB1PV6Ig0M9OMy~JUZDyO1a6qzXfAVa3rYW2U701uKtKmqKhliwzSDFIKR5Xp1UOUuXYnPPWyWNCg2OhjggiUN~HxeEahdm~zsQ__&Key-Pair-Id=APKAIE5G5CRDK6RD3PGA)
