Genetically controlled variation in α2β1 expression by human blood platelets was previously described. Sixty-two haplotype sequences corresponding to the proximal 5′ regulatory region (−1096 to +1) of the α2 gene were compared, and a dimorphic sequence −52C>T was identified that is located precisely between 2 tandem Sp1/Sp3 binding elements previously shown to be absolutely required for transcriptional activity of this gene in epithelial cell lines and the erythroleukemic cell line K562. The gene frequency of −52T in a random Caucasian population is approximately 0.35, and the expression of −52T correlates directly with reduced densities of platelet α2β1. In mobility shift analyses, the −52T substitution attenuates complex formation with both Sp1 and Sp3. When transfected into the erythroleukemia cell line Dami, promoter-luciferase constructs bearing the −52T sequence exhibit a 5-fold decrease in activity relative to the −52C construct. In transfected CHRF-288-11 megakaryocytic cells, the corresponding activity decreases by 10-fold. The −52T sequence appears to be in linkage disequilibrium with the previously defined allele A3 (807C; HPA-5b), known to be associated with diminished expression of platelet α2β1. In summary, a natural dimorphism has been identified within the proximal 5′ regulatory region of the human integrin α2 gene that is responsible for decreased expression levels of the integrin α2β1 on blood platelets through a mechanism that is probably mediated by the nuclear regulatory proteins Sp1 and Sp3.
Introduction
The integrin α2β1is a receptor for both laminin and collagen on most cell types but binds exclusively to collagen when expressed on megakaryocytes and blood platelets.1 A single copy of the α2gene is present in the haploid genome, located on chromosome 5 (5q23-31).2
We were the first to observe that there are marked differences in platelet α2β1 density among healthy individuals3,4 and that these differences correlate with the inheritance of certain allelic combinations of the human α2 gene.4 These findings have now been confirmed by others,5-7 and the biologic and pathophysiologic implications of these differences are now the subject of increased scrutiny. Differences in platelet α2β1 density correlate directly with the rate of platelet adhesion to collagen ex vivo.4 The low-density alleles 2 and 3 (A2 and A3) are over-represented in symptomatic von Willebrand disease type 1 patients.8 Thus, the inheritance of these alleles may predispose patients with von Willebrand disease to increased risk of bleeding. On the other hand, the expression of the high-density allele A1 is a risk factor for diabetic retinopathy9 and for acute coronary disease (eg, myocardial infarction) or stroke in younger patients.10 11
The expression of α2 is known to be regulated at the transcriptional level in megakaryocytoid cells,12-14epithelial cells,15 and fibroblasts.16,17 The first 961 base pairs (bp) of the 5′ flanking region of K562 cell α2 DNA direct cell-type–specific suppressor and enhancer activity in cells of epithelial origin.18 The sequence of this proximal 5′ regulatory region reported by Zutter et al12,18 is most homologous to our allele A2, although a number of sequence differences have been found and are deposited in GenBank (accession no. AF062039). Five-prime to this region, an additional 4-kilobase (kb) sequence contains enhancer elements necessary for maximal transcription of the α2 gene in cells of megakaryocytic lineage.12 In that distal segment, a 40-bp sequence is most critical for transcription enhancement in megakaryocytic cells.13 In addition to this 5′ regulatory region, partial sequences of the human α2 gene have been reported,4 but the entire gene sequence remains to be determined.
In this study, we provide the first evidence that allelic differences in receptor density, initially observed on blood platelets, correlate with a dimorphism within the 5′ regulatory region of the α2 gene. This dimorphism influences transcription by altering the affinity of the flanking sequences for the transcription factors Sp1 and Sp3. Furthermore, the sequence −52T, which attenuates Sp1/Sp3 binding and transcriptional activity, is in linkage disequilibrium with one of the alleles (A3) known to be associated with diminished expression of the integrin on platelets.
Patients, materials, and methods
Cell and tissue samples
Platelets and mononuclear cells were isolated from citrated whole blood, as described.4 Personnel of the General Clinical Research Center (GCRC) at The Scripps Research Institute (TSRI) and Scripps Clinic, La Jolla, CA, recruited healthy blood donors and performed phlebotomies. In addition, DNA samples, derived from blood mononuclear cells of healthy subjects and hematologic patients, were provided through a collaborative study with Dr Augusto Federici (Milan, Italy). Dami cells were a generous gift from Dr David Wilcox (Medical College of Wisconsin, Milwaukee, WI). The megakaryocyte cell line CHRF-288-1119 was a gift from Dr M. A. Lieberman (Cincinnati, OH).
Genotyping
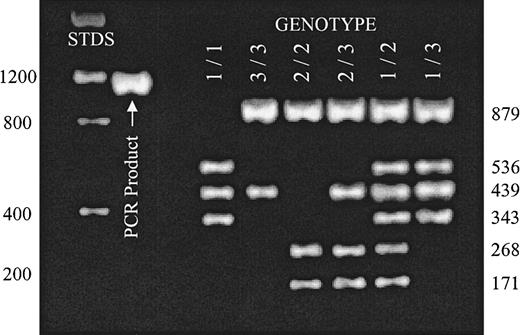
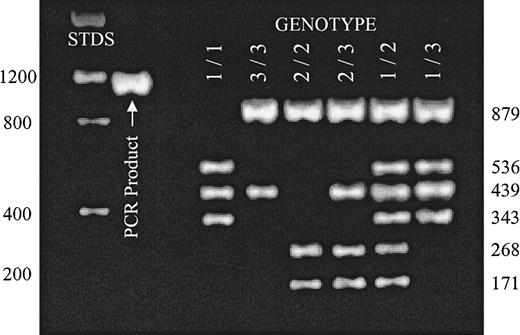
Donor genotype was determined byBglII/AseI restriction fragment length polymorphism (RFLP) using blood mononuclear cell DNA (Figure1). Exon sequence numbering is based on the incomplete human α2 complementary DNA sequence reported by Takada and Hemler.20
Distinction of α2 alleles A1, A2, and A3 by RFLP.
A 1332-nucleotide-long segment of intron G4 was amplified by PCR reaction (PCR product) as described in “Patients, materials, and methods.” Complete digestion of this DNA product with a combination of BglII and AseI permits the unambiguous identification of donor genotype with respect to alleles A1, A2, and A3. The expected mobilities of molecular weight standards (STDS) are indicated to the left of the gel. The size of expected digestion products are indicated to the right of the gel. Reaction products were separated on a 2% agarose gel and visualized with ethidium bromide. Digestion patterns for each possible genotype are represented.
Intron sequences flanking bp 807, 837, and 873 (introns F, G, and H) were derived in this laboratory (T.J.K.) and are available through GenBank (accession no. AF035968). A 1332-bp segment extending from the 3′ region of intron G through most of exon 8 and encompassing the unique BglII and AseI sites (both located in intron G) was amplified from genomic DNA using the following primer pair: 5′ primer (intron G; bp 2789-2812): 5′-GATTTAACTTTCCCGACTGCCTTC-3′; 3′ primer (exon 8; bp 931-965): 5′-CTCTCTAGATTGTCATGGTTGCATTGATCAATCAC-3′.
The polymerase chain reaction (PCR) product (10 μL) was incubated with 1 μL BglII (New England Biolabs, Beverly, MA; NEB), 1 μL AseI (NEB), and 2 μL of the recommended reaction buffer (NEB no. 3) at 37°C for 2.5 hours. Reaction products were analyzed on a 2% agarose gel.
PCR amplification of proximal promoter sequences
Primers were designed to amplify a 437-bp genomic segment beginning at the proximal 5′ regulatory region (nucleotide −244) and ending at nucleotide +191. The sequence of the forward primer was 5′-CAGGAAAGCCTGCCA-3′ (A2ProF) and that of the reverse primer was 5′-TTGACTGAGCGCTACCACC-3′ (A2ProR). From this PCR product, the sequence of the segment −146 to +86 (which encompasses the −52 dimorphism) was obtained using the sequencing primers 5′-GGTTTGCAGAGGATACCC-3′ (A2ProR1), corresponding to nucleotides 69 to 86, and 5′-ACGAGCCGAGGTGCA-3′ (A2ProF1), corresponding to nucleotides −146 to −131.
α2-luciferase fusion constructs
The proximal 5′ regulatory region of the α2 gene corresponding to −244 through + 40 was amplified by PCR using as template genomic DNA from a donor homozygous for −52C. The oligonucleotide primers were designed to incorporate KpnI (forward) and BglII (reverse) restriction sites, and the product was inserted into the polylinker site upstream of the luciferase (LUC) reporter gene in the plasmid pGL2-Enhancer (Promega, Madison, WI). The primer sequences were as follows (restriction sites underlined): A2PROFORKpnI: 5′-GAGGGTACCAGGAAAGCCTGCCA-3′; A2PROREV BglII: 5′-GAGAGAT CTAGAAGCTGTCCAGAGGGC-3′.
The desired plasmid pα2244-LUC was cloned in pGL2-Enhancer, and the insert sequence was confirmed in both directions using primers supplied by the manufacturer (GLprimer1 and GLprimer2; Promega). The plasmid pα2244Δ−52T-LUC was generated from pα2244-LUC as follows. The pα2244 insert was excised from pGL2-Enhancer using SmaI andHindIII restriction sites and cloned into the pALTER-1 vector (Promega). The −52T variant was then produced by mutagenesis using oligonucleotide −52T (5′-GGGGCGGGCTGGGGCGGGC-3′) according to the manufacturer's protocol. The mutated sequence was confirmed in both directions using SP6 and T7 primers (supplied by the manufacturer), and the insert was excised and cloned once again into pGL2-Enhancer. The sequence of the resultant plasmid pα2244Δ−52T-LUC was confirmed to be identical to pα2244-LUC except for the single base substitution −52T.
Quantitation of platelet α2β1 by flow cytometry
With appropriate informed consent, blood samples were collected from healthy volunteers and processed in the GCRC of The Scripps Clinic. Six volumes of whole blood were mixed with 1 volume of acid-citrate dextrose-NIH formula A (ACD-A). An aliquot of whole blood was centrifuged over a cushion of Ficoll-Hypaque to isolate mononuclear cells that were preserved by freezing in dimethyl sulfoxide and served as a source of genomic DNA for genotyping. A second aliquot of whole blood was prepared for fluorescence-activated cell sorter (FACS) analysis, as described below. Within 4 hours of phlebotomy, 5 μL whole blood was mixed with 40 μL of 1% bovine serum albumin–Tyrode buffer (2 mM MgCl2, 137.5 mM NaCl, 12 mM NaHCO3, 2.6 mM KCl, pH7.4) and one of the following: (a) 5 μL of 100 μg/mL normal mouse immunoglobulin G (IgG) (Zymed No. 02-6502); (b) 5 μL of 100 μg/mL AP2 IgG; (c) 5 μL of 1:50 12F1 ascites; or (d) 5 μL of 1:50 8C12 ascites. Dilutions of IgG or ascites were made with 1% bovine serum albumin–Tyrode buffer. The mixtures were gently agitated and then incubated for 30 minutes at ambient temperature. One microliter of fluorescein isothiocynate–goat antimouse IgG (H+L) (Zymed no. 62-6312, Zymed Laboratories, S San Francisco, CA) was then added, and the mixture was gently agitated and incubated for 30 minutes at ambient temperature. To each mixture, 950 μL of 1% paraformaldehyde in 10 mM Na2HPO4, 1.8 mM KH2PO4, 2.7 mM KCl, 137 mM NaCl, pH 7.4, (PBS) was added, and the samples were stored at 4°C in the dark until FACS analysis.
FACS analysis was initiated within 72 hours after phlebotomy. Samples were diluted with 1 mL PBS (plus 0.05% [wt/vol] NaN3) just prior to FACS assay. Measurements were obtained using a Becton Dickinson FACSstar Plus flow cytometer within the technical laboratory of the GCRC.
Sequence analysis
DNA sequences were obtained using an Applied Biosystems ABI Prism Model 377 DNA Sequencer (PerkinElmer Applied Biosystems, Foster City, CA) by personnel in the DNA Core Laboratory of the Department of Molecular and Experimental Medicine, TSRI.
Statistical analysis
Standard one-way ANOVA was employed to make comparisons of platelet α2β1 density, as determined from flow cytometry binding measurements between subgroups with different α2 genotypes. If significant overall differences between the sample groups were found by ANOVA, we then used the Bonferroni multiple comparisons procedure to examine differences between pairs of sample groups.
Gel mobility shift analysis
Nuclear extracts were obtained from CHRF-288-11 or Dami cells by isolation of nuclei, as described.21 An optimal number of cells (nominally, 0.5 × 10⁸ to 1 × 10⁸) were washed twice in PBS (centrifugation at 1800g for 10 minutes) and then lysed in 0.5 mL of 0.5% (vol/vol) Nonidet P-40 in 25 mM HEPES, 50 mM KCl, pH 7.9, containing 1 mM phenylmethylsulfonyl fluoride (PMSF), 100 μM dithiothreitol (DTT), 10 μg/mL leupeptin, and 20 μg/mL aprotonin (lysis buffer). The nuclei were pelleted and rinsed once in lysis buffer without Nonidet P-40 (centrifugation at 10 000g for 1 minute). By vigorous micropipetting, nuclei were then physically disrupted in 25 mM HEPES, 500 mM KCl, pH 7.9, containing 10% (vol/vol) glycerol, 1 mM PMSF, 100 μM DTT, 10 μg/mL leupeptin, and 20 μg/mL aprotonin (extraction buffer). When nuclei were sufficiently emulsified, the mixtures were centrifuged at 10 000g for 5 minutes, and the supernatants were collected. The concentration of nuclear proteins in the supernatants was determined by the method of Bradford.22 Double-stranded DNA probes were end-labeled with α32P–deoxycytidine triphosphate using Klenow DNA polymerase.23 From 5 to 10 μg nuclear protein was mixed with labeled DNA (5 × 10⁴cpm) in 10 μL of 25mM HEPES, 50 mM KCl, 0.5 mM EDTA, pH 7.9, containing 10% (vol/vol) glycerol, 0.5 mM PMSF, and 0.5 mM DTT (binding buffer) and incubated at ambient temperature for 1 hour. In reactions using competitor DNA, a molar excess (as indicated) of the unlabeled competitor DNA fragment was used. In antibody-based supershift or inhibitor experiments, 3 μg anti-Sp1, anti-Sp3, anti-AP2, anti–nuclear factor-κB (anti-NFκB), or anti–Egr-1 (each from Santa Cruz Biotech, Santa Cruz, CA) was preincubated with the nuclear extract for 15 minutes at ambient temperature before addition of the α32P-labeled probe. The reaction products were separated by polyacrylamide gel electrophoresis using 4% acrylamide/Bis (19:1) in 10.5 × Tris-borate-EDTA buffer (TBE; Invitrogen, Carlsbad, CA). Protein complexes were visualized by autoradiography.
Transfection assays
The Dami and CHRF-288-11 cells were transfected by electroporation using a Cell-Porator (Life Technologies, Gibco, Gaithersburg, MD). Approximately 1 × 10⁷ cells were transfected in 500 μL Iscove's modified medium containing 20 μg plasmid DNA and 20 μg pSV–β-galactosidase DNA by electroporation at 300 V and 1180 μF.
Results
The 5′ regulatory region sequence
We have accumulated more than 20 kb of genomic sequence representing analogous regions of alleles A1, A2, and A3, including 5.5 kb of the 5′ regulatory region, and these sequences can be obtained through GenBank (accession no. AF062039). Sixty-two haplotypes were compared in greater detail within the proximal regulatory region represented by residues −1069 to +191. Although there is near identity (> 99.5%) between these haplotype sequences, one allelic substitution, −52C>T, occurs with a gene frequency of 0.35.
To assess the relationship between nucleotide substitution −52C>T and the A1, A2, and A3 alleles, we compared genotypes in a total of 110 individuals (Table 1). A1, A2, and A3 were defined by BglII/AseI RFLP, as shown in Figure 1 and described in “Patients, materials, and methods.” The −52C>T dimorphism was defined by direct sequencing as described in “Patients, materials, and methods.”
The most striking observation is that 7 of 7 donors who are homozygous for allele A3 are also homozygous for −52T. Moreover, each of 5 donors who are heterozygous for allele A3 (genotype 2/3 or 3/1) also expresses at least one −52T. This is evidence for linkage between these promoter sequences and those downstream sequence substitutions that define allele A3, such as 807C and 1648A (HPA-5b).24 25Additional donors need to be genotyped to determine whether there is any further linkage disequilibrium between the already established alleles (A1 or A2) and these promoter dimorphisms.
This naturally occurring dimorphism is located precisely in the middle of tandem Sp1/Sp3 binding elements of the core promoter, previously defined by Zutter14 and Ye26 (Table2). The published core promoter sequence contains 2 Sp1/Sp3 binding elements, labeled (from right to left) A and B, separated by a single nucleotide, the C<T substitution at position −52.
Donor differences in platelet α2β1expression
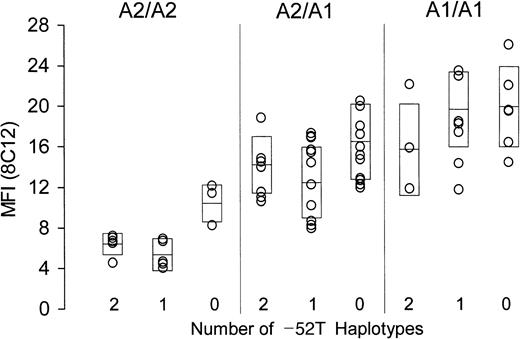
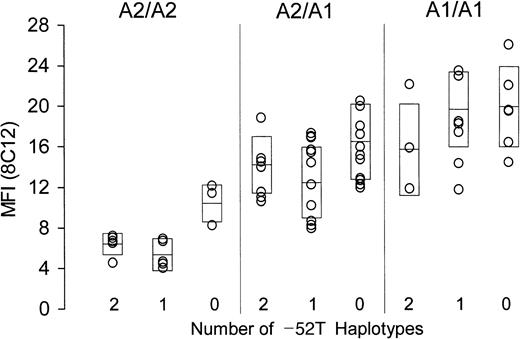
The surface content of platelet α2β1in whole blood was measured by flow cytometry, employing either of 2 murine monoclonal anti-α2β1 antibodies, 8C12 or 12F1. Identical findings were made with both antibodies, and the results obtained using 8C12 are depicted in Figure2. A total of 67 donors who express either allele A1 or A2 are subdivided by genotype. Donors who are homozygous for allele A2 are represented in the left panel; those heterozygous for alleles A2 and A1 are represented in the center panel; and those homozygous for allele A1 are represented in the right panel. Within each group, donors are further classified as homozygous, heterozygous, or negative (2, 1, or 0, respectively; Table 2) for the substitution −52T (abscissa). For each donor, platelet α2β1 density, as reflected by relative binding of the antibody 8C12, is plotted on the ordinate. Each boxed area represents the mean (center horizontal bar) ± 1 SD. For data obtained using 8C12, the overall F statistic is highly significant: F (8, 49) = 11.73, P < .0001. Similar findings were obtained with a second anti-α2β1 antibody, 12F1, whereby F (8, 49) = 7.84, P < .0001 (not shown).
Relationship between α2 genotype and platelet α2β1 density.
The level of platelet α2β1 was determined in freshly drawn whole blood by flow cytometry using murine monoclonal anti-α2β1 (8C12). Mean fluorescence intensity (MFI) is plotted on the ordinate. All donors expressed only alleles A1 or A2 and are subdivided with respect to expression of these alleles: left panel, homozygous A2/A2; center panel, heterozygous A1/A2; and right panel, homozygous A1/A1. As indicated on the abscissa, donors are further subdivided with respect to number of haplotypes expressing the −52T sequence (2, 1, or 0). Boxes represent the mean (center horizontal bar) ± 1 SD for each data set.
Unfortunately, we could not recruit a sufficient number of donors who express allele A3 to add to this comparison, because the measurement of platelet α2β1 density must employ freshly prepared blood, and none of the identified homozygous A3 donors were available locally.
There is clearly an inverse relationship between the number of inherited substitutions within the promoter regions and the platelet density of α2β1, and this relationship is statistically significant. In particular, the platelet integrin level in donors who are homozygous for −52T is consistently much lower than that of donors who do not express this substitution (ie, who are homozygous for −52C).
The influence of the C>T substitution at position −52 on the binding of nuclear proteins
Using gel mobility shift analysis, we found that nuclear proteins from Dami, K562, and CHRF-288-11 cells bind to a 28-bp core promoter fragment (bp −65 to −38) that contains the 2 tandem Sp1/Sp3 binding elements, designated A and B in Table 2. The C>T base substitution at −52 has a significant effect on the binding of both Sp1 and Sp3 to the flanking sequences. The oligonucleotide probes employed for these studies are listed in Table 2.
Nuclear proteins from the Dami cell line form specific complexes with either the −52C or the −52T probes (Figure3), and essentially identical results are obtained with either CHRF-288-11 or K562 cell line (not shown).
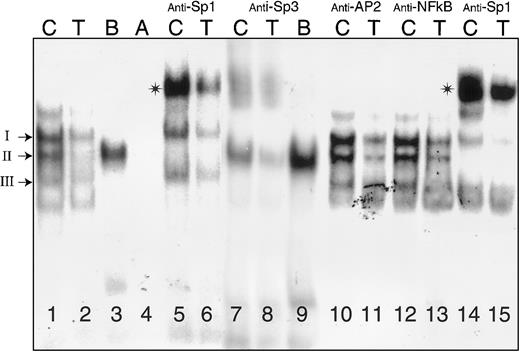
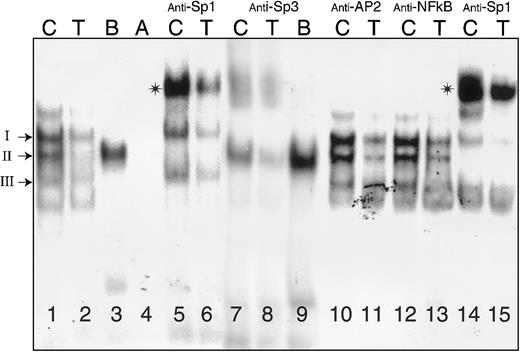
Binding of nuclear proteins from Dami cells to oligonucleotides (residues −65 to −38) containing Sp1/Sp3 sites A and B.
Nuclear extracts were prepared from Dami cells and incubated with radiolabeled oligonucleotides (Table 2) either in the absence of antiserum (lanes 1-4) or following incubation with anti-Sp1 (lanes 5, 6, 14, 15), anti-Sp3 (lanes 7-9), anti-AP2 (lanes 10, 11), or anti-NFκB (lanes 12, 13). The radiolabeled nucleotide probes (Table2) were −52C (“C”), −52T (“T”), B, and A, as indicated at the top of each lane. The positions of complexes I, II, and III are indicated to the left of the gel. Asterisks denote supershifted complexes. The samples in lanes 14 and 15, preincubated with anti-SP1, were treated in the same experiment as those depicted in lanes 10-13.
In a representative gel mobility shift assay, using a nuclear extract from Dami cells (Figure 3), 3 major complexes are formed in the presence of −52C (lane 1) and are designated I through III, from the slowest to fastest mobility. Based on differential precipitation with polyclonal anti-Sp1 or anti-Sp3, these complexes are formed by the binding of (I) Sp3 only, (II) Sp1 only, and (III) Sp3 only. The experimental basis for these identifications is summarized below. Complexes I and III are each supershifted in the presence of anti-Sp3 antibody (lanes 7, 8). Conversely, complex II is selectively supershifted in the presence of anti-Sp1 antibody (lanes 5, 6, 14, 15). None of the 3 complexes are formed in the presence of the control probes A (lane 4) or mutant AB (not shown), and none is supershifted by antibodies specific for AP2 (lanes 10, 11), NFκB (lanes 12, 13), or Egr-1 (not shown).
In the presence of −52T, complex formation with either Sp3 (lanes 2, 6) or Sp1 (lanes 2, 8) is markedly diminished. Differential binding of Sp1 and Sp3 to this promoter segment is noticeable in the case of the mutant oligonucleotide B. The formation of Sp1 complexes (complex II) is enhanced in the presence of B (lanes 3, 9), but Sp3 binds poorly if at all to this mutant (lanes 3, 9).
The different behavior of B and A not only confirms the specificity of complex formation, but it also establishes the fact that binding element B is the most critical element for the interaction of Sp1. On the other hand, elimination of site A in mutant B decreases complex formation by Sp3 but has less effect on formation of complexes with Sp1 (lanes 3, 9). This finding suggests that site B may be most critical for the binding of both Sp1 and Sp3 and that Sp1 readily competes with Sp3 for access to this site. Identical findings were made with CHRF-288-11 or K562 nuclear extracts (not shown).
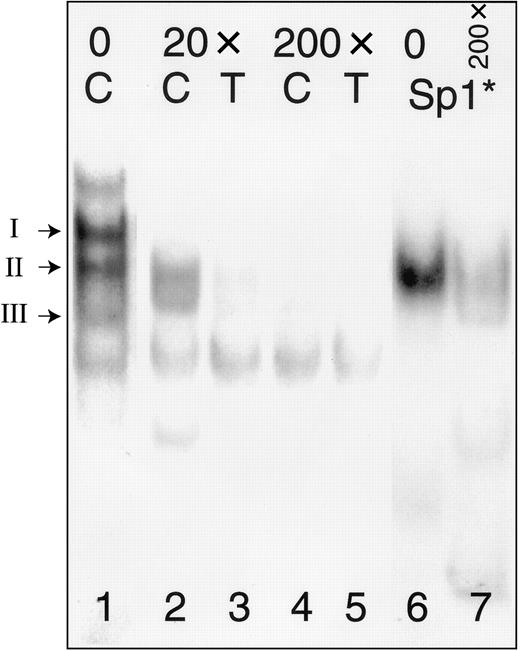
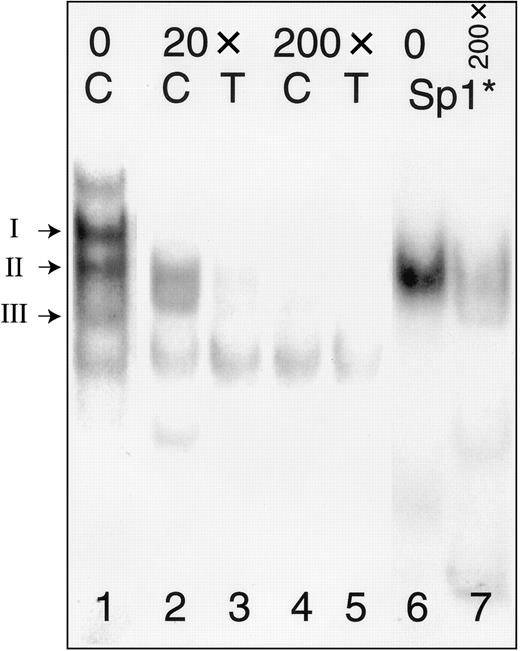
In a separate gel mobility shift assay (Figure4), we tested the ability of the consensus Sp1-binding oligonucleotide 5′-ATTCGATCGGGGCGGGGCGAGC-3′ (Sp1*) (Promega) to inhibit complex formation with −52C or −52T. To facilitate comparisons of protein complexes, lane 1 from Figure 3 is duplicated as the corresponding lane in this figure. Molar excess of unlabeled Sp1* inhibits the formation of the Sp1 complex (complex II) with labeled oligonucleotides −52C (lanes 2, 4) or −52T (lanes 3, 5). Most complex formation is blocked in the presence of 20-fold excess of the inhibitor (lanes 2, 3), and the addition of 200-fold molar excess of inhibitor results in nearly complete elimination of the Sp1 complexes (lanes 4, 5). A complex with mobility identical to that of complex II, but not complexes I or III, is formed when nuclear extracts from Dami cells are incubated with labeled Sp1* (lane 7). This complex is markedly inhibited by addition of 200-fold molar excess of unlabeled autologous probe, Sp1* (lane 8).
Competition between oligonucleotides −52C or −52T and a consensus Sp1 oligonucleotide (Sp1*).
The positions of complexes I, II, and III are indicated to the left of the gel. Nuclear extracts were prepared from Dami cells and incubated with radiolabeled oligonucleotides (Table 2) either in the absence of inhibitor (lane 1) or following preincubation with a 20-fold molar excess (lanes 2, 3) or 200-fold molar excess (lanes 4, 5) of Sp1* (Promega). Radiolabeled Sp1* forms a complex with Sp1 derived from Dami cell nuclear protein extracts (lane 6) that has a mobility identical to that of complex II formed with probes −52C (“C”) or −52T (“T”); the complex formed with labeled Sp1* is also inhibited by addition of a 200-fold molar excess of unlabeled Sp1* (lane 7).
Reporter assays
To investigate how decreased affinity of the −52T sequence might influence in situ transcription rates, we compared the relative activities of promoter-LUC constructs. The construct pα2240-LUC contains the consensus promoter sequence from −244 through +40 (GenBank accession no. AF062039) with −52C. This sequence, derived from a comparison of 62 haplotypes, is not identical to the published α2 promoter sequence18 but can be considered the allele sequence most equivalent to that published sequence. The plasmid construct pα2240Δ−52T-LUC contains the replacement T at −52. Each construct was ligated into the vector pGL2-enhancer (Promega). Promoter activities were compared after transient transfection of Dami cells or CHRF-288-11 cells. Cotransfection with the vector pSV–β-galactosidase (Promega) was employed to normalize for transfection efficiency. The results of these assays are summarized in Table 3.
Dramatic differences were observed in both Dami cells and CHRF-288-11 cells. In Dami cells (3 separate experiments), Δ−52T results in a 5-fold decrease in promoter activity. This finding is consistent with a decrease in the binding of Sp1 to the oligonucleotide region encompassing the −52T substitution. In the Dami cell transfectants, this translates into a decrease in reporter gene activity. As for CHRF-288-11, comparable results were obtained. In 2 experiments, −52T caused an 8-fold decrease in promoter activity (Table 3). In the case of either cell line, individual nonparametric tests of C versus T were statistically significant at the .05 level using the Wilcoxon test.
Discussion
The down-regulation in the expression of integrin α2β1 on platelets has now been well documented by a number of laboratories.4-7 However, until this report, a molecular basis for this effect had not been identified. In this study, we provide the first evidence that a naturally occurring single nucleotide substitution, −52C>T , lying precisely between 2 tandem Sp1/Sp3 binding elements of the proximal promoter region of the α2 gene, accounts for a substantial portion of the differences seen in expression of this integrin on platelets. Our evidence for this conclusion is 3-fold. First, in transient transfection assays, promoter-LUC reporter gene constructs that contain the C>T substitution at nucleotide −52 exhibit 5-fold to 10-fold decreases in activity in Dami or CHRF-288-11 cells, respectively. Second, in gel mobility shift assays, the C>T substitution at nucleotide −52 causes a striking inhibition in the binding of Sp1 and Sp3 present in nuclear extracts of Dami or CHRF-288-11 cells. Third, in a population of 67 healthy donors, the expression of −52T correlates with decreased expression of the integrin α2β1 on platelets, acting synergistically with previously defined α2 allelic differences.
The involvement of Sp1 and Sp3 in the regulation of α2gene transcription by −52C>T is not surprising, based on previous studies of the α2 gene 5′ regulatory region. The core promoter of the α2 gene does not contain a TATA box, but 5 potential Sp1/Sp3 sites are found within the first 311 bp of the 5′ flanking region.14,15 Two of these, tandem Sp1/Sp3 sites within −30 to −65, are absolutely necessary for high-level promoter activity in hematopoietic cell lines, such as K562,14 and represent an Erb-B2 responsive element in human epithelial cells.15 Acting in cooperation with other regulatory proteins and transcriptional activators, small changes in the activity of Sp1 can cause significant changes in the rate of transcription. For example, Sp1 plays a pivotal role in the cytokine-regulated expression of the vascular cell adhesion molecule and in AP2-regulated, myeloid cell–specific expression of the CDC11c gene.27,28 On the other hand, by binding competitively to the same Sp1 consensus elements, Sp3 can either suppress Sp1-mediated transcriptional activation15,29,30 or stimulate transcription in its own right.31 Thus, the degree to which α2Sp1-binding elements are involved in transcription may be influenced by the relative binding of Sp1 (as activator) or Sp3 (as repressor). In this regard, a pertinent feature of the α2 Sp1 sites is their relatively high affinity for Sp3, as described previously by Ye et al15 and confirmed by our observations in this report.
In this study, based on comparisons of mutated promoter constructs in mobility shift assays, it appears that the 5′ site (site B) is more critical to both Sp1 and Sp3 binding than the 3′ site (site A) in the context of −52C. When site B alone is eliminated, the binding of both Sp1 and Sp3 is virtually abolished. The elimination of the 3′ site (site A), however, decreases the binding of Sp3 but markedly enhances the binding of Sp1. The following explanation is consistent with these findings. First, site A alone is not an efficient binding site for either Sp1 or Sp3. Second, Sp1 and Sp3 can compete for binding site B, but the avidity or affinity of Sp1 for this site exceeds that of Sp3. Third, the presence of site A actually inhibits the binding of both Sp1 and Sp3 to site B, possibly through a secondary structure that is peculiar to this segment of the DNA molecule. Thus, the elimination of site A releases the inhibition of Sp1/Sp3 binding to site B. These relationships hold true in the presence of −52T. However, the binding of Sp1 or Sp3 to site B is markedly decreased in the presence of −52T, so that any binding differences that might be caused by site A are attenuated. Ye et al15 did not note any differential binding of Sp1 or Sp3 to sites A or B because they treated these sites as a single binding unit. A precise understanding of the relative contribution of each site to Sp1- and Sp3-regulated promoter activity in situ will require more rigorous molecular analyses and is beyond the scope of this initial report.
The degree of segregation between −52C>T and each of the other allelic dimorphisms within the human α2 genes will require additional studies on a larger number of individuals. However, we have obtained sufficient data to conclude that −52T is in linkage disequilibrium with the previously defined allele A3, characterized by the allelic sequences 807C and 1648A (HPA-5b).24 25 Allele A3 is the least common of the 3 major alleles (gene frequency of 0.08) and has been associated with decreased expression of the integrin on platelets. From an evolutionary standpoint, these data indicate that allele A3 is the youngest of the 3 alleles and that the divergence at −52C>T occurred prior to the mutational events that created allele A3. Thus, allele A3 was probably created by mutation of an allele that already bore −52T. Alleles A1 and A2, on the other hand, continued to express either −52C or −52T.
The importance of Sp1 in the transcriptional regulation of other human genes is well established. For example, a point mutation in a single Sp1 site within the human retinoblastoma gene leads to hereditary retinoblastoma,32 and naturally occurring point mutations within the human γ-globin promoter cause increased Sp1 binding in vitro and are linked to hereditary persistence of fetal hemoglobin.33 34
In the case of the human α2 gene, allelic differences have a profound effect on expression of the platelet integrin α2β1, and these expression differences can influence morbidity and risk of fatality in certain disease states, where platelet adhesive function is critical. Inheritance of those alleles that are associated with low receptor density, alleles A2 or A3, may predispose patients with type 1 von Willebrand disease to increased risk of bleeding,8 and inheritance of allele A1, associated with high receptor density, represents a risk factor for diabetic retinopathy9 and for acute coronary disease (eg, myocardial infarction) or stroke in younger patients.10 11 In this report, we identify for the first time a molecular difference between α2 alleles that contributes to allele-dependent transcriptional regulation of this gene. These findings will pave the way for a more thorough characterization of the mechanisms that control expression of this important receptor.
We thank Dr Virgil Woods (University of California, San Diego) for the murine hybridoma cell line 12F1 and Dr Mark Ginsberg (TSRI) for the murine monoclonal antibody 8C12. We thank Dr David Wilcox (Medical College of Wisconsin, Milwaukee, WI) for the Dami cell clone used in transfection assays, and we are grateful to Drs Nigel Mackman, Alan McLachlan, and Jerry Ware, all of TSRI, for their invaluable advice and assistance during the course of these studies. We gratefully acknowledge the GCRC staff in the recruitment and phlebotomy of healthy blood donors.
Supported by a grant from the Gustavus and Louise Pfeiffer Foundation and by National Heart, Lung, and Blood Institute grants R01 HL54203 and HL46979 awarded to T.J.K. The participation of the General Clinical Research Center staff in the recruitment and phlebotomy of healthy blood donors was supported by United States Public Health Service grant M01 RR00833.
The publication costs of this article were defrayed in part by page charge payment. Therefore, and solely to indicate this fact, this article is hereby marked “advertisement” in accordance with 18 U.S.C. section 1734.
References
Author notes
Thomas J. Kunicki, Associate Professor, Dept of Molecular and Experimental Medicine, The Scripps Research Institute, 10550 North Torrey Pines Rd, Mail Drop MEM150, La Jolla, CA 92037; e-mail: tomk@scripps.edu.

