Abstract
The mouse mi locus encodes a basic-helix-loop-helix-leucine zipper-type transcription factor, microphthalmia transcription factor (MITF). Mice of mi/migenotype express a mutant form of MITF (mi-MITF), whereas mice of tg/tg genotype have a transgene in the 5′ flanking region of the mi gene and do not express MITF. Although themi/mi mouse is deficient in natural killer (NK) activity, it was found that the tg/tg mouse was normal in this respect. To know the cause, spleen cells of both genotypes were compared. Although the proportion of spleen cells expressing an NK cell marker, NK1.1, was comparable in both mice, the proportion of large granular lymphocytes decreased only in mi/mi mice. The difference between mi/mi and tg/tg mice was reproducible in the culture supplemented with interleukin-2. Moreover, the perforin gene expression was reduced in mi/mi–cultured spleen cells. Wild-type (+) MITF transactivated, butmi-MITF suppressed, the perforin gene promoter through the NF-P motif, a strong cis-acting element. However, neither +-MITF nor mi-MITF bound the NF-P motif. Instead, 2 nuclear factors that bound the NF-P motif were retained in the cytoplasm ofmi/mi–cultured spleen cells. In addition, overexpression of mi-MITF resulted in cytoplasmic retention of the 2 NF-P motif–binding factors in cytotoxic T lymphocytes. The presence ofmi-MITF rather than the absence of +-MITF appeared to lead to poor transactivation of the NF-P motif by intercepting NF-P motif–binding factors. This inhibitory effect of mi-MITF may cause the deficient cytotoxicity of NK cells in mi/mimice.
Introduction
The mouse mi locus encodes a transcription factor belonging to the basic-helix-loop-helix-leucine zipper family (microphthalmia [mi] transcription factor [MITF]).1,2 The mutant mi allele produces an abnormal MITF, in which 1 out of 4 consecutive arginines is deleted in the basic domain (hereafter, mi-MITF).1,3,4 Themi-MITF is defective in DNA binding, nuclear localization, and transactivation of some target genes.5-10 Homozygous mutant mice of mi/mi genotype were found by Hertwig11,12 among the offspring of an X-irradiated male mouse. On the other hand, mice of tg/tg genotype are null mutants at the mi locus, a condition that was produced by transgene insertion into the 5′ flanking region of the migene.1,13 Both tg/tg and mi/mi mice share a lot of abnormal phenotypic features, such as microphthalmia, white coat color, and the decreased number of mast cells.13-18 However, they were clearly distinguishable from each other at least in one respect: mi/mi mice are osteopetrotic whereas tg/tg mice are not.
Another abnormality of mi/mi mice is a deficiency in natural killer (NK) activity.17,19 A decrease in the number of large granular lymphocytes (LGLs) has been reported in mi/mimice.17 Since NK cells are morphologically identified as LGLs,20,21 the decreased NK activity is ascribed to the decreased number of LGLs.17 In the present study, we estimated the number of NK cells by another method. When we examined the expression of NK1.1 surface antigen of spleen cells, the proportion of cells expressing the NK1.1 antigen did not decrease inmi/mi mice. Next, we examined tg/tg mice according to the number and activity of their NK cells. In contrast tomi/mi mice, tg/tg mice have a normal number of LGLs and NK1.1–expressing cells and a normal NK activity. Hence, we attempted to investigate the mechanism that may explain the difference between mi/mi and tg/tg mice.
Granzyme (Gr) B and perforin are major effector proteins of NK cells and cytotoxic T lymphocytes (CTLs).22-26 We already found that expression levels of the Gr B gene decreased in cultured mast cells derived from the spleen of mi/mi mice.27Since mi/mi–cultured mast cells were deficient in killing activity, we considered that the poor killing activity ofmi/mi–cultured mast cells may be attributable to the deficient expression of the Gr B gene.28 We examined whether mi/mi NK cells were deficient in Gr B gene expression. However, this was not the case, and NK1.1+cells of both mi/mi and tg/tg mice were normal in Gr B gene expression. On the other hand, NK1.1+ cells oftg/tg mice were normal, but those of mi/mi mice were deficient in perforin gene expression. We examined the transactivation effects of mi-MITF on the perforin gene promoter; mi-MITF appeared to disturb the nuclear translocation of particular transcription factors that are primarily responsible for transactivation of the perforin gene.
Materials and methods
Mice
C57BL/6J-mi/+ (mi/+) mice were purchased from the Jackson Laboratory (Bar Harbor, ME). VGA-9-tg/tgmice were kindly given by Dr H. Arnheiter (National Institutes of Health, Bethesda, MD) and carry the mouse vasopressin–Escherichia coli–galactosidase transgene at the 5′ flanking region of the mi (MITF) gene.1Both mice were maintained by consecutive backcrosses with our own inbred C57BL/6 colony (more than 12 generations). Eithermi/mi or tg/tg mice were produced by crosses between female and male heterozygotes of each genotype and were selected by their white coat color. To augment NK cells in vivo, 3-week-old mice received an intraperitoneal injection of polyinosinic-polycytidylic acid (poly I:C) (Sigma, St Louis, MO).29 We injected 100 μg of poly I:C in 100 μL of phosphate-buffered saline (PBS) into each mouse.
Cell lines
The CTLL-2 and WEHI-3 cell lines were purchased from Riken (Tokyo, Japan). P-815 and YAC-1 cells were obtained from the American Type Culture Collection (Bethesda, MD). CTLL-2 cells were cultured in α-MEM with 10% fetal calf serum (FCS) and 1000 U/mL recombinant mouse interleukin 2 (rmIL-2). The other cells were cultured in α-MEM with 10% FCS. The conditioned medium of WEHI-3 cells were obtained by culturing at 70% confluency for 2 days.
Spleen-cell culture
To prepare single-cell suspensions of spleen cells, spleens were aseptically removed from mi/mi or tg/tg mice and their normal (+/+) littermates at 3 weeks of age and passed through the mesh. Spleen mononuclear cells were obtained after centrifugation on Ficoll/Hypaque gradients (density = 1.077) (Sigma) at 300gfor 20 minutes. NK cells were augmented in the spleen-cell culture according to the procedure described.30 Briefly, 1.0 × 10⁷ spleen cells were suspended in 3 mL of the culture medium containing 70% α-MEM, 10% FCS, 20% WEHI-3–conditioned medium, and 1000 U/mL rmIL-2 (R&D Systems, Minneapolis, MN). Cells were transferred onto a 25-cm2tissue-culture flask (Corning Costar, Corning, NY) and incubated at 37°C. Every 3 days, 3 mL of α-MEM medium containing 10% FCS and 1000 U/mL rmIL-2 was added to the culture. On the indicated days, nonadherent cells were harvested and used for further analysis.
To generate CTLs in mixed cell culture, spleen mononuclear cells were cultured as described previously.31 Briefly, 1.0 × 10⁷ spleen cells were obtained from DBA/2(H-2d) mice, and C57BL/6(H-2b)+/+, C5DBL/6(H-2b) mi/mi, and C57BL/6(H-2b) tg/tg mice. DBA/2 spleen cells were irradiated with 20 Gy. Spleen cells of C57BL/6 mice of either genotype were cocultured with irradiated DBA/2 spleen cells for 4 days. Cells were harvested and used as anti–H-2dCTLs.
Fluorescence-activated cell sorting
Cells were incubated with biotin-conjugated anti-NK1.1 antibody (Pharmingen, San Diego, CA) at 4°C for 30 minutes, and stained with fluorescein isothiocyanate–conjugated streptoavidin (Pharmingen) for 15 minutes at 4°C in PBS containing 1.0% bovine serum albumin and 0.1% sodium azide. Cells were analyzed on a FACScan (Becton Dickinson, Los Angeles, CA).
Cytology
We centrifuged 1.0 × 10⁵ cultured cells in 0.1 mL α-MEM at 600 rpm for 5 minutes onto microscope slides using a Cytospin 2 centrifuge (Shandon, Pittsburgh, PA). Air-dried preparations were fixed in methanol and stained with 10% Giemsa solution (Merck, Darmstadt, Germany) diluted in Tris-buffered saline (pH 6.4). LGLs were identified as being larger than small and medium-sized lymphocytes.20 21 They have a relatively high cytoplasmic-to-nuclear ratio and weakly basophilic cytoplasm with a lot of azurophilic granules. Macrophages were distinguished from LGLs on the basis of their larger size, vacuolar cytoplasm, and indented nucleus. At least 1000 cells were analyzed per slide.
Northern blot analysis
Northern blot analysis was performed according to the standard method.27 Template complementary DNA (cDNA) for the mouse perforin probe was obtained by reverse-transcription polymerase chain reaction (RT-PCR) with the use of the following primers: 5′-TGCCACTCGGTCAGAATGCAAGC-3′ and 5′-CTTCCAGTAATGTGTGCAGGGGC-3′. Relative signal intensity was calculated with the BAS 2000 system (Fuji Photo Film, Tokyo, Japan).
Cytotoxicity assay
NK-cell cytotoxicity to YAC-1 cells and H-2d–specific cytotoxicity to P-815 cells (H-2d) were measured by a 51Cr release assay as described previously.32 Briefly, cultured spleen cells in α-MEM with 10% FCS were distributed at different cell numbers (1.0, 4.0, and 7.5 × 10⁵ cells for YAC-1 cells; 0.5, 1.0, and 2.5 × 10⁵ cells for P-815 cells) in triplicate into 96-well microtiter plates. Some wells were pre-incubated with 100 nM concanamycin A (CMA) (Wako, Osaka, Japan) or diluent (0.1% dimethyl sulfoxide [DMSO]) alone for 1 hour at 37°C. YAC-1 and P-815 cells were labeled with [51Cr] Na2CrO4 (Amersham, Arlington Heights, IL). We mixed 1.0 × 10⁴ of either YAC-1 or P-815 cells with various numbers of spleen cells in a total volume of 200 μL α-MEM with 10% FCS. After incubating plates at 37°C for 4 hours, the radioactivity was determined in 100-μL samples of cell-free supernatants. The radioactivity released in the wells containing YAC-1 or P-815 cells alone with and without adding 0.01% Triton X-100 was designated total release (TR) and spontaneous release (SR), respectively. The percentage of specific 51Cr release was calculated by means of the following formula: (cpm in the presence of spleen cells − SR)/(TR − SR) × 100.
Transient transfection
The pEF-BOS plasmid33 containing +-MITF ormi-MITF cDNA was constructed as described previously7,8 and used as an effector. The pEF-BOS containing the β-galactosidase gene was used as an internal control.7,8 To prepare reporter constructs, the promoter region of the perforin gene (nucleotide [nt] −822 to +173 [+1 is the transcription start site])34 was obtained with PCR and subcloned into the upstream region of the luciferase gene in pSPLuc plasmid.7,8 Transient transfection into CTLL-2 cells were done as described previously.28 Luciferase and β-galactosidase activities were measured 24 hours after cotransfection with the effector and reporter constructs.35 To express +-MITF and mi-MITF in CTLL-2 cells, the cells were cultured in 5 mL α-MEM with 10% FCS and 1000 U/mL rmIL-2 for 5 days after transfection with the effector constructs.
Extraction and blotting of proteins
Nuclear and cytoplasmic fractions were prepared as described previously.36 We separated 10 μg cell lysate proteins by 12% sodium dodecyl sulfate–polyacrylamide gel electrophoresis and transferred it onto an Immobilon membrane (Millipore, Bedford, MA). The blot was incubated with the mouse monoclonal antibody to pan-actin (Boehringer Mannheim, Germany) or proliferating cell nuclear antigen (PCNA) (PC10) (Dako, Kyoto, Japan) and then with horseradish peroxidase–conjugated anti–mouse IgG1 antibody (Pharmingen). The blot was reacted with Renaissance chemiluminescence reagents (NEN, Boston, MA) before exposure.
Electrophoretic gel mobility shift assay
Electrophoretic gel mobility shift assay (EGMSA) was done according to the procedure described previously.27 The nuclear fraction was used after dialysis against 10 × cell-pellet volume of a buffer (20 mM Hepes, pH 7.9; 20% glycerol; 100 mM KCl; 0.2 mM EDTA; 0.5 mM phenylmethylsulfonyl fluoride; and 0.5 mM dithiothreitol) for 1 hour.
Results
Number of NK cells
We assessed the proportion of NK cells in spleen mononuclear cells by estimating LGLs and NK1.1+ cells. The proportion of LGLs decreased in mi/mi mice but not in tg/tg mice (Table 1). On the other hand, the proportion of NK1.1+ cells was comparable among +/+,mi/mi, and tg/tg mice (Table 1). This inconsistency suggested a failure in mi/mi mice to form cytoplasmic granules during NK-cell development.
Expression of Gr B and perforin genes in spleen
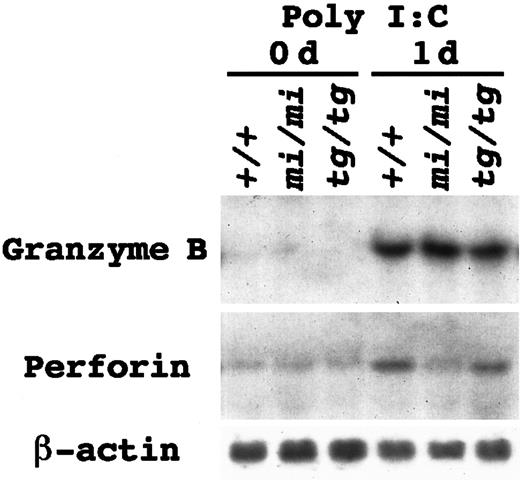
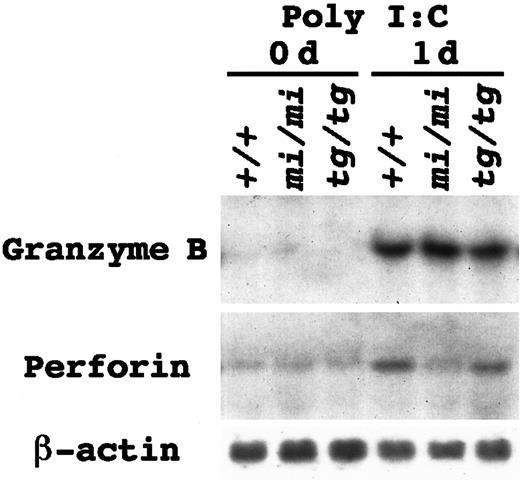
We reported a reduction of the Gr B gene expression inmi/mi–cultured mast cells.27,28 If this was also the case in mi/mi NK cells, the reduction of Gr B would be responsible for the deficient NK activity. We examined the Gr B gene expression in the spleen tissues of nontreated 3-week-old mi/mi, tg/tg, and +/+ mice. The Gr B gene expression was below the limit of detection, and the perforin gene expression was just faintly detectable regardless of the genotype (Figure1). Low levels of the Gr B and perforin gene expression were consistent with the fact that significant NK activity was not detectable in the spleen cells of 3-week-old mice.37 38 To augment the number of NK cells in the spleen, poly I:C was injected intraperitoneally. At 1 day after the injection, a marked increase in the Gr B mRNA expression was detected in the spleen tissues (Figure 1). The degree of the induction was comparable among +/+, mi/mi, and tg/tg mice. On the other hand, the increase in the perforin gene expression was much smaller in mice of all genotypes. Especially in the spleen ofmi/mi mice, the induction of the perforin gene was too small to be noticeable (Figure 1).
Messenger RNA (mRNA) induction of the Gr B and perforin genes in the spleen tissue by poly I:C injection.
Mice of +/+, mi/mi, and tg/tg genotypes received an intraperitoneal injection of poly I:C. Before (0 days) and 24 hours after the injection (1 day), spleens were excised and used for RNA extraction. Five micrograms of total RNA were blotted and hybridized with the Gr B or perforin probe. Reprobing with β-actin probe verified an RNA equal loading. Similar results were yielded in 3 independent experiments.
Development of NK cells in culture
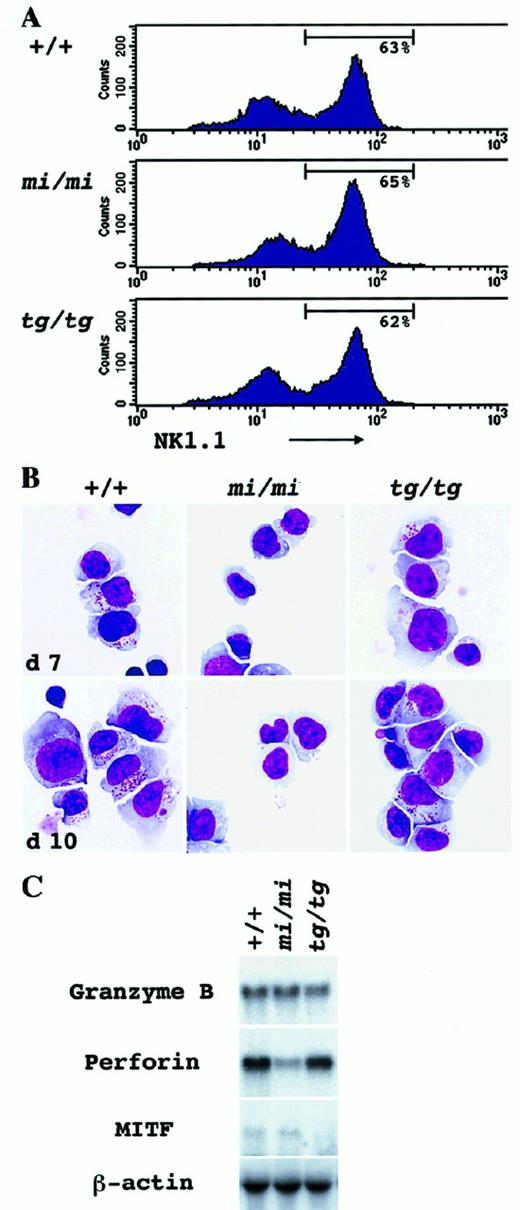
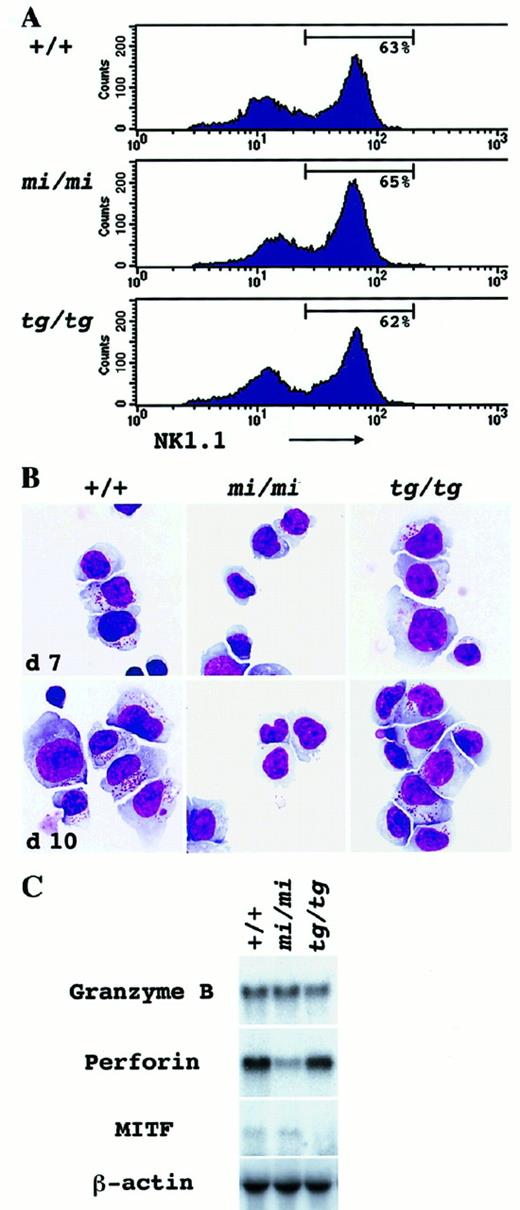
We augmented the number of NK cells by culturing spleen cells in the presence of rmIL-2. The number of NK1.1+ cells reached a peak from day 7 to day 10 and declined toward day 14. Only a small population of hematopoietic cells could survive longer than day 14. On day 10, the proportion of NK1.1+cells in the culture was examined by FACScan. A considerable proportion of NK1.1+ cells was observed in the culture ofmi/mi, tg/tg, and +/+ mouse origin (Figure2A). Giemsa staining revealed that the major part of the cultured spleen cells consisted of large lymphocytes with wide and pale cytoplasm (Figure 2B). The proportion of large lymphocytes was consistent with the proportion of NK1.1+cells in all +/+, mi/mi, and tg/tg spleen-cell cultures (Table 2). Small lymphocytes, granulocytes, and macrophages belonged to a minor population of the culture (Table 2). A striking difference was observed in the content of azurophilic granules. Most large lymphocytes of +/+ andtg/tg mice contained cytoplasmic granules and are considered to be LGLs (Figure 2B; Table 3). The granules developed through days 7 to 10 of the culture (Figure 2B). In contrast, most large lymphocytes of mi/mi mice did not contain cytoplasmic granules and remained agranular even on day 10 of the culture (Figure 2B; Table 3).
In vitro development of NK cells from the spleen-cell culture supplemented with rmIL-2.
Spleen cells derived from +/+, mi/mi, and tg/tgmice were cultured in α-MEM continuously supplemented with rmIL-2. On days 7 and 10, nonadherent cells of the culture were harvested and examined by immunologic (panel A), morphological (panel B) and molecular biologic (panel C) methods. Three independent experiments yielded similar results. (A) FACScan analysis to detect NK1.1 marker expression in the cultured spleen cells on day 10. Gates indicate the population of NK1.1+ cells in the culture. (B) Morphological detection of NK cells. Cytospin preparation of the culture was done on days 7 and 10, and cells were stained with Giemsa solution. Through days 7 to 10, azurophilic cytoplasmic granules were well developed in large lymphocytes of both +/+ andtg/tg mice, but not of mi/mi mice. (C) Northern blot analysis to detect the Gr B, perforin, and MITF gene expression in the spleen-cell culture. Total RNA (5.0 μg) was extracted from the aliquots of the cultured cells on day 10, blotted, and hybridized with the Gr B, perforin, or MITF probe. Reprobing with β-actin verified an RNA equal loading.
The cultured spleen cells were harvested on day 10 and examined for NK activity. Collected cells were cultured together with51Cr-labeled YAC-1 cells at various effector/target (E/T) ratios, and 51Cr release from YAC-1 cells was measured after 4 hours. A dose-dependent killing activity was detected in the cultured spleen cells derived from +/+ mice (Table4). Comparable killing activity was also detected in the cultured spleen cells from tg/tg mice. In contrast, the cultured spleen cells from mi/mi mice showed markedly reduced levels of killing activity (Table 4). We examined the extent to which the killing activity depended upon perforin in the present assay. Pretreatment of effector cells with CMA has been shown to exclude the perforin-mediated cytotoxicity.39 40 Spleen cells were pre-incubated with CMA and then cocultured with YAC-1 cells at an E/T ratio of 75:1. Killing activities were significantly reduced (Table 4). Pretreatment with the control medium containing 0.1% DMSO alone did not reduce the activity (data not shown).
Gene expression for Gr B and perforin was examined in aliquots of the cultured spleen cells. There was no difference in the Gr B gene expression among the cultured spleen cells of the 3 genotypes (Figure2C). Cultured spleen cells obtained from +/+ and from tg/tgmice contained the perforin message abundantly. However, the perforin gene expression was reduced to approximately one tenth in themi/mi–cultured spleen cells (Figure 2C). These results indicated that mi/mi NK cells were deficient in killing activity owing to the defect of the perforin gene expression.
Cytotoxicity of CTLs
Although decreased NK activity has been reported inmi/mi mice, it remains unknown whether the mice are also deficient in cytotoxicity of CTLs. We generated anti–H-2dCTLs from C57BL/6 mice (H-2b) of +/+, mi/mi, andtg/tg genotypes and examined their cytotoxic activities to P-815 cells (H-2d). A dose-dependent cytotoxic activity was detected in CTLs derived from all 3 mice (Table5). At any E/T ratio, cytotoxic values ofmi/mi CTLs were smaller than those of +/+ CTLs, but there was no significant difference. CTLs of tg/tg mice showed a cytotoxicity comparable to that of +/+ mice.
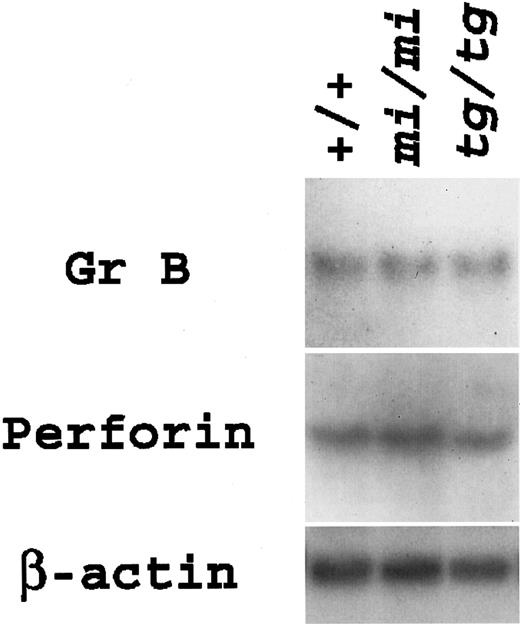
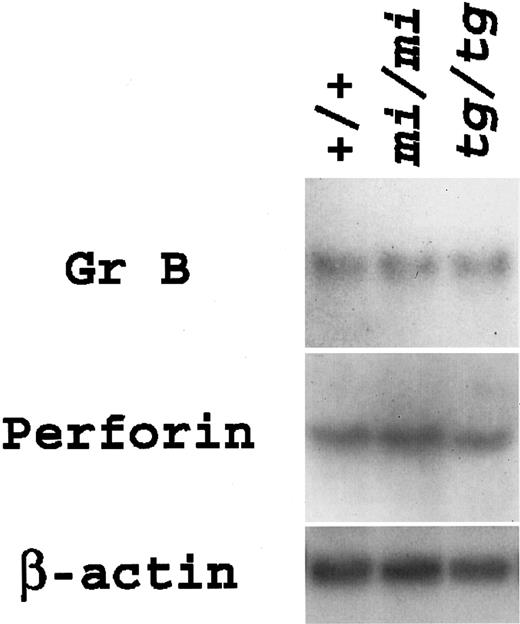
Expression levels of Gr B and perforin genes were examined in aliquots of CTLs. Both genes were expressed almost equally among the CTLs of the 3 genotypes (Figure 3). The results of gene expression were in accordance with those of killing activity.
Gene expression for Gr B and perforin in anti–H-2d CTLs derived from +/+,
mi/mi, and tg/tg mice.Total RNA (3.0 μg) was extracted from the aliquots of CTLs, blotted, and hybridized with the Gr B or perforin probe. Reprobing with β-actin probe verified an RNA equal loading.
Gene expression for Gr B and perforin in anti–H-2d CTLs derived from +/+,
mi/mi, and tg/tg mice.Total RNA (3.0 μg) was extracted from the aliquots of CTLs, blotted, and hybridized with the Gr B or perforin probe. Reprobing with β-actin probe verified an RNA equal loading.
The above results indicated that mi-MITF was involved in the deficient transactivation of perforin gene in NK cells, but not in CTLs. We attempted to focus on NK cells, but the regulatory mechanisms for the perforin gene expression have been analyzed more intensely in CTLs by using mouse CTL cell lines, such as CTLL-2.41 42Moreover, there were no available mouse NK cell lines. In the following experiments, we first examined how the perforin gene promoter was transactivated in CTLL-2 cells after transfection with +-MITF andmi-MITF.
Effects of MITF on transactivation of the perforin promoter
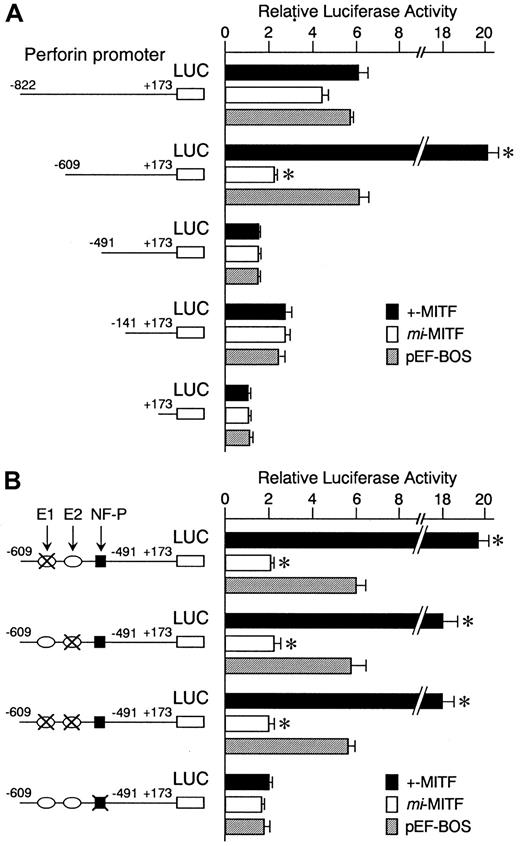
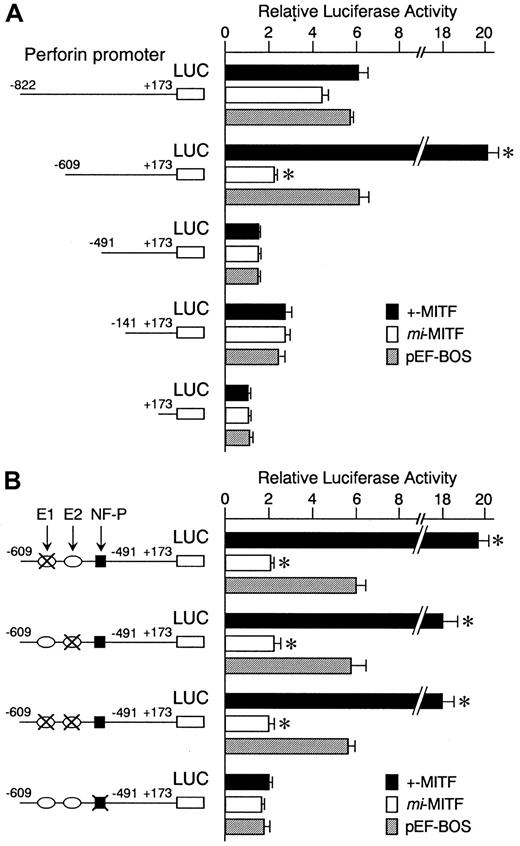
We examined the effect of +-MITF and mi-MITF on the perforin gene transactivation by using the transient cotransfection assay. The 5′-flanking sequence of the perforin gene (nt −822 to +173) 34 was cloned upstream from the luciferase gene. We also obtained 3 deletion constructs containing the promoter sequences from nt −609, −491, or −141 to +173. These luciferase constructs were shown to function in CTLL-2 cells.41 42 The constructs were cotransfected into CTLL-2 cells with the expression plasmid pEF-BOS containing +-MITF cDNA, mi-MITF cDNA, or no insert. A strong transactivation effect of +-MITF was detected on the deletion construct containing −609 to +173 but not on either the longer (nt −822 to +173) or the 2 shorter (nt −491 or −141 to +173) constructs (Figure 4A). This indicated that the positive cis-acting element for +-MITF was present between −609 and −491.
Positive effect of +-MITF and negative effect ofmi-MITF on transactivation of the mouse perforin gene.
(A) The perforin gene promoter sequences from −822,−609,−491, and −141 to +173 were inserted into the upstream of the luciferase gene of pSPLuc. These reporter constructs and empty pSPLuc were transfected into CTLL-2 cells with the pEF-BOS containing no insert (pEF-BOS) or +-MITF or mi-MITF cDNA by electroporation. The bars represent the mean ± SE of the luciferase activities obtained by 3 independent experiments: (▪) indicates +-MITF; (■),mi-MITF; (░), pEF-BOS. (B) The effect of mutations in the CANNTG and NF-P motifs on the luciferase activity. In the −609 promoter construct, the CAACTG (E1, nt −567 to −562; upstream oval) and CAGCTG (E2, nt −525 to −520; downstream oval) motifs, and NF-P motif (nt −505 to −493; black square) were mutated in various combinations. X indicates mutated motifs: CACATG to CTACAG; CAGCTG to CTGCAG; ACAGGAAGT to ACATTCCTG. Only the mutation in the NF-P motif abrogated the transactivation effect of +-MITF. *P < .05 by t test when compared with the values when pEF-BOS containing no insert was cotransfected.
We reported previously that +-MITF directly transactivated a number of genes through binding to CANNTG (E-box) motifs.7-10 27 In the region between −609 and −491, 2 CANNTG motifs were present: CAACTG (nt −567 to −562; E1) and CAGCTG (nt −525 to −520; E2). The 2 motifs were mutated in the deletion construct containing −609 to +173: CAACTG to CTACAG, or CAGCTG to CTGCAG. Neither mutation reduced the luciferase activity of the original nt −609 promoter construct (Figure 4B). Therefore, +-MITF did not appear to transactivate the perforin promoter through the direct binding with the E-box motifs.
Between nt −609 and −491 of the perforin promoter, there is an NF-P motif (nt −505 to −493) that is known to be a strongcis-acting element for transactivation of the perforin gene.43,44 Two nuclear factors, termed NF-P1 and NF-P2, have been shown to bind and transactivate the NF-P motif in cytolytic lymphocytes.43,44 Reporter constructs that contained the NF-P motif (nt −822 and nt −609 constructs) were transactivated 6-fold as strongly as the construct lacking the promoter (nt +173 construct), even when an empty pEF-BOS was cotransfected (Figure 4A). This transactivation effect was remarkably diminished either when the NF-P motif was deleted from the promoter, as seen in the case of nt −491 or −141 construct (Figure 4A), or when the NF-P motif was mutated to ACATTCCTG (Figure 4B).43 44Endogenous factors, such as NF-P1 and NF-P2, of CTLL-2 cells appeared to transactivate the promoter containing the NF-P motif.
When compared with the endogenous transactivation observed in CTLL-2 cells, the coexpression of +-MITF transactivated the nt −609 reporter construct 3-fold further (Figure 4A). The mutation in the NF-P motif abrogated this effect (Figure 4B), suggesting that +-MITF transactivated the nt −609 reporter construct through the NF-P motif. In contrast, when the nt −609 reporter construct was cotransfected with cDNA encoding mi-MITF, the luciferase activity decreased to one third of the value obtained by the cotransfection with empty pEF-BOS (Figure 4A). The enhancing effect of +-MITF and the inhibiting effect of mi-MITF were still observed when the 2 E-box motifs between −609 and −491 were mutated (Figure 4B).
Poor binding of MITF to E-box and NF-P motifs
In vitro binding of +-MITF to the E-box and NF-P motifs was examined by EGMSA. As controls, we used 2 oligonucleotides containing the CACATG (nt −128 to −123; oligonucleotide P6) and mutated (CTCAAG; oligonucleotide mP6) motif of the mouse mast cell protease (MMCP)–6 gene promoter.5 8 In addition, 3 oligonucleotides containing CAACTG (oligonucleotide E1), CAGCTG (oligonucleotide E2), and NF-P (oligonucleotide NF) motifs of the perforin gene promoter were synthesized (Figure 5A). The binding between +-MITF and oligonucleotide P6 was competed out completely by the cold oligonucleotide P6, but not at all by the cold oligonucleotide E1 or oligonucleotide mP6 (Figure 5B). The competitive effect of the oligonucleotide E2 was slight (Figure 5B). Consistently, +-MITF yielded a little amount of the complex with oligonucleotide E2, but no complex with oligonucleotide E1 (Figure 5B). Neither +-MITF normi-MITF bound oligonucleotide NF (Figure 5B).
EGMSA using oligonucleotides containing E-box or NF-P motif.
(A) Sequences of oligonucleotides used in EGMSA. P6 contains the CACATG motif (boxed) of the MMCP-6 gene promoter, which is mutated (underlined) in mP6. E1 and E2 contain the CAACTG and CAGCTG motifs (boxed) of the perforin gene promoter, respectively. NF contains the NF-P motif (boxed) of the perforin gene promoter, which is mutated (underlined) in mNF. Arrowheads indicate the position of nucleotides in the promoters. (B) In vitro binding of MITF to the 2 CANNTG motifs (E1 and E2) and the NF-P motif in the perforin promoter. GST-fused +-MITF or mi-MITF protein was incubated with32P-labeled oligonucleotides (probe oligonucleotide) in the presence or absence (−) of the competitor. For competition, an excess amount (100-fold) of indicated unlabeled oligonucleotides was added to the reaction prior to the probe. The reaction mixture was separated on polyacrylamide gel. An arrowhead indicates the position of protein-DNA complex.
Inhibitory effect of mi-MITF on nuclear translocation of NF-P motif–binding factors
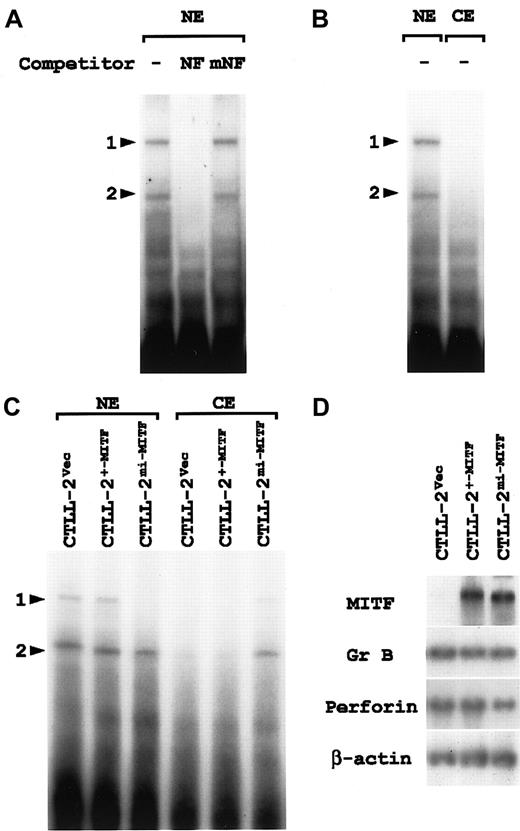
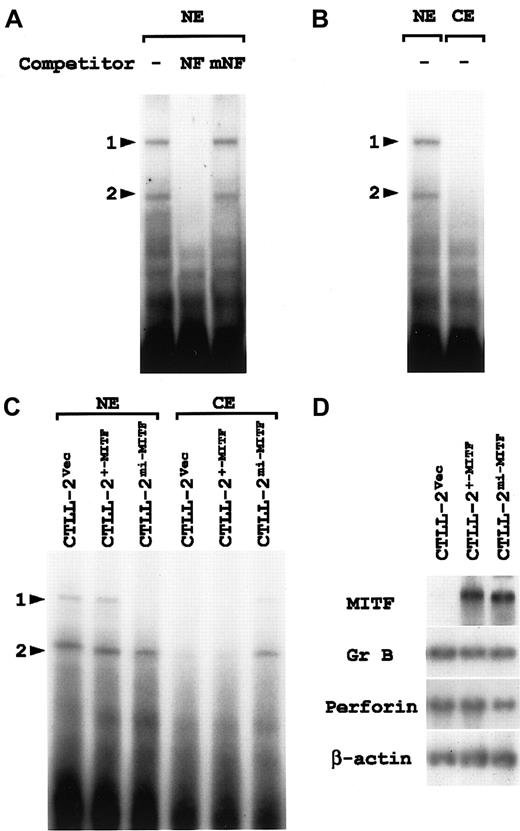
The nuclear fraction was obtained from CTLL-2 cells and examined with EGMSA by using oligonucleotide NF as a probe. We detected 2 retarded bands (Figure 6A; denoted by arrowheads 1 and 2). Addition of cold oligonucleotide NF as a competitor erased both bands completely (Figure 6A). This competitive effect disappeared when the NF-P motif was mutated to ACATTCCTG (oligonucleotide mNF) (Figure 6A), indicating that the 2 bands were NF-P motif–specific. The bands shown by arrowheads 1 and 2 were considered to represent the NF-P motif–binding nuclear factors that have been named NF-P1 and NF-P2, respectively.43 44
Cytoplasmic retention of NF-P motif–binding factors in CTLL-2 cells overexpressing mi-MITF.
(A) Two nuclear factors that specifically bind the NF-P motif are present in the nucleus of CTLL-2 cells. The nuclear extract (NE) was prepared from CTLL-2 cells and incubated with 32P-labeled oligonucleotide NF in the presence or absence (−) of the competitor. For competition, NE was incubated with an excess amount (100-fold) of unlabeled oligonucleotide NF or oligonucleotide mNF prior to the reaction with the probe. The reaction mixture was separated by polyacrylamide gel. Arrowheads 1 and 2 indicate the same retarded bands that specifically bind the NF-P motif. (B) The nuclear (NE) and cytoplasmic (CE) fractions of CTLL-2 cells were examined with EGMSA by using oligonucleotide NF as a probe. Arrowheads 1 and 2 indicate the same retarded bands that specifically bind the NF-P motif. (C) EGMSA of CTLL-2 cells transfected with +-MITF and mi-MITF. The nuclear and cytoplasmic fractions were extracted from CTLL-2 cells that had been transfected with +-MITF, mi-MITF, or vector alone (Vec) 5 days before. The extracts were incubated with32P-labeled oligonucleotide NF, and separated on polyacrylamide gel. Arrowheads 1 and 2 indicate the same retarded bands that bind specifically the NF-P motif. (D) Gene expression in CTLL-2 cells transfected with cDNA encoding +-MITF or mi-MITF. CTLL-2 cells were transfected with +-MITF, mi-MITF, or vector alone. After 5 days, total RNA (3.0 μg) was extracted from the cells, blotted, and hybridized with the MITF, Gr B, and perforin probes. Reprobing with β-actin probe verified an RNA equal loading.
There was the possibility that NF-P1, NF-P2, or both mediated the enhancing effect of +-MITF and the inhibiting effect ofmi-MITF on the perforin promoter. When the CTLL-2 cell lysate was divided into nuclear and cytoplasmic fractions, NF-P1 and NF-P2 were detected in the nuclear fraction (Figure 6B), indicating an efficient translocation of both factors into the nucleus. After the transfection with +-MITF, mi-MITF cDNA, or vector alone, CTLL-2 cells were fractionated and subjected to EGMSA according to the same procedure (Figure 6C). Transfection with vector alone or +-MITF cDNA did not change the nuclear localization of either NF-P1 or NF-P2. NF-P2 was also detectable in the nuclear fraction of CTLL-2 cells transfected with mi-MITF cDNA. The band intensity for NF-P2 was slightly weaker. By contrast, NF-P1 was scarcely detectable in this fraction. Instead, both NF-P1 and NF-P2 were detectable in the cytoplasmic fraction of CTLL-2 cells transfected withmi-MITF, but not in the fraction of CTLL-2 cells transfected with +-MITF or with vector alone.
Aliquots of the transfected CTLL-2 cells were examined for gene expression. High levels of mRNA expression for the exogenous +-MITF andmi-MITF were detected in the corresponding CTLL-2 cells (Figure 6D). The RNA blot was rehybridized with the Gr B and perforin probes. No significant difference was detected in the expression of either gene among 3 types of the transfected CTLL-2 cells (Figure 6D).
Cytoplasmic localization of the NF-P motif–binding factor inmi/mi–cultured spleen cells
Using the same procedure as described above, we examined +/+,mi/mi, and tg/tg spleen cells after culturing with rmIL-2 for 10 days. In the nuclear fraction of thetg/tg spleen cells, 2 retarded bands were detected at positions comparable to those of NF-P1 and NF-P2 (Figure7A). Addition of cold oligonucleotide NF, but not of oligonucleotide mNF, as a competitor erased the 2 bands (Figure 7A), indicating that the 2 bands were NF-P motif–specific. NK1.1+ cells of tg/tg mice appeared to possess both NF-P1 and NF-P2 in their nucleus.
Detection of NF-P motif–binding factors in the cultured spleen cells.
Arrowheads 1 and 2 indicate the same positions of protein-DNA complexes as shown in Figure 6. (A) Two nuclear factors that specifically bind with the NF-P motif are present in the nucleus oftg/tg–cultured spleen cells. The nuclear extract (NE) was prepared from tg/tg spleen cells after culturing with rmIL-2 for 10 days and incubated with 32P-labeled oligonucleotide NF in the presence or absence (−) of the competitor. For competition, NE was incubated with an excess amount (100-fold) of unlabeled oligonucleotide NF or oligonucleotide mNF prior to the reaction with the probe. The reaction mixture was separated by polyacrylamide gel. (B) Detection of the NF-P motif–binding factors in the nuclear and cytoplasmic (CE) extracts by EGMSA. Each cell extract was prepared from CTLL-2 cells, and +/+, mi/mi, and tg/tg spleen cells after culturing with rmIL-2 for 10 days. The extracts were incubated with 32P-labeled oligonucleotide NF and separated on polyacrylamide gel (upper panel). Aliquots (10 μg per lane) of the extracts were blotted with the PCNA and pan-actin antibodies (lower panels). (C) Detection of the NF-P motif–binding factors during in vitro development of mi/mi NK cells. To produce NK cells, spleen cells from mi/mi mice were cultured as described in “Materials and methods.” The nuclear and cytoplasmic fractions were extracted from the cultured cells on the indicated days after the initiation of the culture. The extracts were incubated with32P-labeled oligonucleotide NF and separated on polyacrylamide gel.
Similarly, NF-P1 and NF-P2 were detected in the nuclear fraction of the +/+ spleen cells (Figure 7B). In contrast, no bands were detected at the position of either NF-P1 or NF-P2 in the nuclear fraction obtained from the mi/mi spleen cells (Figure 7B). On the other hand, both NF-P1 and NF-P2 were weakly detected in the cytoplasmic fractions of 3 types of the cultured cells. The intensity of the bands was comparable in +/+ and tg/tg cells and was slightly stronger in mi/mi cells (Figure 7B). Competition experiments showed that NF-P1 and NF-P2 detected in each fraction were NF-P motif–specific (data not shown).
Aliquots of the nuclear and cytoplasmic fractions were blotted with the PCNA and pan-actin antibodies (Figure 7B, lower panels). The immunoreactive signals for PCNA and actin were detected primarily in the nuclear and cytoplasmic fractions, respectively, indicating that the cell lysate of each genotype was divided appropriately into nuclear and cytoplasmic fractions.
To examine whether the cytoplasmic NF-P1 and NF-P2 were derived from NK1.1+ cells but not from NK1.1− cells, we extracted nuclear and cytoplasmic fractions frommi/mi–cultured spleen cells on various days of the culture. Each fraction was examined with EGMSA by using oligonucleotide NF as a probe (Figure 7C). In the nuclear fractions, NF-P2 was detected through days 2 to 7, but disappeared almost completely on day 10. NF-P1 was faintly detectable only on day 2. In the cytoplasmic fractions, no retarded bands appeared on day 2. On day 5, NF-P2 became detectable and gradually increased through days 5 to 10. In addition, NF-P1 became detectable on day 7 and more intense on day 10. Since NK1.1+ cells were only a minor population on day 2 and day 5, but became a major population through days 7 to 10 (Table 3, and data not shown), it was reasonable to consider that cytoplasmic NF-P1 and NF-P2 were derived primarily from NK1.1+ cells. Together, the results of EGMSA suggested a deficient nuclear translocation of NF-P1 and NF-P2 in mi/mi NK1.1+cells.
Discussion
The proportion of NK1.1+ cells was normal in the spleen of mi/mi mice, though the proportion of LGLs decreased significantly. Both the proportion of NK1.1+cells and that of LGLs were normal in the spleen of tg/tgmice. The difference between mi/mi and tg/tgmutant animals was reproducible in the culture of spleen cells continuously stimulated by rmIL-2. Through days 7 to 10, the population of NK1.1+ and large lymphocytic cells became predominant in the culture of +/+ spleen cells. Both mi/mi andtg/tg cultured spleen cells showed a population similar in this respect. However, most of mi/mi lymphocytic cells remained agranular in their cytoplasm, whereas cytoplasmic granules were well developed in lymphocytic cells of +/+ and tg/tggenotypes. Mice of mi/mi genotype appeared to be defective in cytoplasmic granule formation during NK-cell development, but not in the entire process of NK-cell development. Although it is poorly understood how NK cells produce the granules, heparin is required for the formation of normal cytoplasmic granules in mast cells.45,46 We previously reported that the heparin content decreased in the skin mast cells of mi/mimice.47 However, it must be pointed out that the principal proteoglycan in NK-cell granules is chondroitin sulfate A.48 Reduced production of chondroitin sulfate A could be a cause for the poor development of cytoplasmic granules inmi/mi NK1.1+ cells.
Gr B and perforin are major effector proteins contained by NK cells. The expression of Gr B was normal but that of perforin was reduced inmi/mi NK1.1+ cells. In proportion to the reduction of the perforin gene expression, NK activity was reduced inmi/mi NK1.1+ cells. These abnormalities exhibited by mi/mi mice were reminiscent of Chediak-Higashi syndrome (bg/bg) mice49 and perforin gene knock-out mice (perforin [−/−] mice).24-26 In contrast to mi/mi NK1.1+ cells, NK cells ofbg/bg mice contain giant granules in their cytoplasm. Butbg/bg NK cells are as defective in NK activity asmi/mi NK cells.50 Perforin (−/−) mice showed more profound reduction in NK activity than mi/mi mice. The magnitude of the reduction observed in mi/mi mice was comparable to that of perforin (+/−) mice.26 Normal development of azurophilic granules and full expression of perforin gene appeared necessary for normal NK activity.
Although deficient in NK activity, mi/mi mice were normal in CTL cytotoxic activity. Moreover, mi/mi CTLs expressed both Gr B and perforin genes as abundantly as +/+ CTLs. Themi-MITF appeared to inhibit transactivation of the perforin gene in NK cells, but not in CTLs. In this sense, the effect of mi-MITF on the perforin gene transactivation should be analyzed in NK cells. However, we used CTLL-2 cells initially for this purpose, because positive and negative regulatory regions of the perforin promoter have been determined in CTLs.41,42 The positive regulatory region is active in cytolytic lymphocytes, such as CTLL-2 cells, whereas the negative regulatory region functions predominantly in other types of cells. The NF-P motif (nt −505 to −493) is one of the strongest positive core elements.41 42 In CTLL-2 cells, +-MITF enhanced andmi-MITF suppressed the transactivation of the perforin promoter through the NF-P motif, but not through the E-box motifs. However, neither +-MITF nor mi-MITF bound the NF-P motif. There seemed to be other factors that mediated the enhancing effects of +M-MITF and suppressing effects of mi-MITF on the NF-P motif.
NF-P1 and NF-P2 are defined as 2 nuclear factors that specifically bind the NF-P motif.43,44 Although both NF-P1 and NF-P2 are considered to belong to the Ets family,43 molecular cloning of them has not been reported yet. In CTLL-2 cells, both factors were detected in the nucleus, but not in the cytoplasm, indicating their efficient translocation into the nucleus. Overexpression of mi-MITF resulted in the cytoplasmic retention of most of NF-P1 and a part of NF-P2 (Figure 6C). The similar effect of mi-MITF was found in mi/miNK1.1+ cells, but its inhibitory effect was more profound even though mi-MITF was expressed much less abundantly than in CTLL-2 cells overexpressing mi-MITF. In NK1.1+–cultured spleen cells of mi/mi mice, both NF-P1 and NF-P2 were detected in the cytoplasm, but not in the nucleus (Figure 7B). The results of EGMSA appeared to account for the different levels of the perforin gene expression among 3 types of cells expressing mi-MITF. Reduction of the perforin expression was undetectable in mi/mi CTLs. Similarly, there was little, if any, reduction of perforin expression in CTLL-2 cells even when mi-MITF was overexpressed (Figure 6D). In contrast, the reduction was much larger in mi/miNK1.1+–cultured spleen cells. The mi-MITF seemed to suppress the transactivation of the perforin gene more efficiently in NK cells than in CTLs.
On the other hand, +-MITF did not appear essential for nuclear translocation of NF-P1 and NF-P2, because both factors were located in the nucleus of NK1.1+ cells of tg/tg mice lacking any MITFs. Concomitantly, no reduction of the perforin expression was found in tg/tg NK1.1+ cells ortg/tg CTLs. This result also suggested that the enhancing effect of +-MITF on the perforin gene promoter was undetectable at the physiologic concentration of +-MITF. The presence ofmi-MITF, rather than the absence of +-MITF, appeared to be a cause of decreased expression of the perforin gene through poor transactivation of the NF-P motif.
We reported previously that mi-MITF is mutated in its sequence for the nuclear localization signal and thus deficient in entering the nucleus.6 This deficiency ofmi-MITF might cause the cytoplasmic retention of NF-P1 and NF-P2. The simplest explanation for this result may be as follows: NF-P1 and NF-P2 interact with mi-MITF in the cytoplasm, and the resulting complexes fail to enter the nucleus because of the defect in mi-MITF. In our previous report, we demonstrated the similar mechanisms that cause mi-MITFs to interfere with other transcription factors. When mi-MITF was overexpressed, c-Jun51 and PU.1,52 a transcription factor of the Ets family, were retained in the cytoplasm. Furthermore, the cytoplasmic retention of c-Jun resulted in a decreased expression of the MMCP-7 gene in mi/mi–cultured mast cells.51 In P-815 mastocytoma cells, mi-MITF interfered with endogenous transcription factors, such as AP-1 and PEBP2, that are primarily responsible for transcription of the Gr B gene.28 However, in our preliminary experiments,mi-MITF did not prefer to interact with NF-P1 or NF-P2 under in vitro conditions (A.I., unpublished observations, 2000). Further study is necessary on the molecular mechanisms underlying the inhibitory effect of mi-MITF.
Besides NK cells and CTLs, mast cells are another cell type possessing cytotoxicity. As reported previously, mi/mi–cultured mast cells were deficient in Gr B gene expression and cytotoxicity.28 However, NK cells and CTLs ofmi/mi genotype were normal in Gr B gene expression. On the other hand, mi/mi NK cells were deficient in perforin gene expression, while mi/mi CTLs were normal in this regard. Mast cells are lacking in perforin gene expression even if the cells are derived from +/+ mice. This may be the reason cultured mast cells are modest in their cytotoxicity when compared with NK cells and CTLs (A.I., unpublished observations). With respect to expression levels of Gr B and perforin, mi/mi NK1.1+ cells resemble +/+ cultured mast cells. Thus, we considered that the deficient cytotoxicity of mi/mi NK1.1+ cells was attributable to the poor expression of the perforin gene. The inhibitory effect of mi-MITF on the transactivation of the perforin gene appeared to explain the deficient cytotoxicity of NK cells in mi/mi mice.
The publication costs of this article were defrayed in part by page charge payment. Therefore, and solely to indicate this fact, this article is hereby marked “advertisement” in accordance with 18 U.S.C. section 1734.
References
Author notes
Yukihiko Kitamura, Dept of Pathology, Osaka University Medical School, Yamada-oka 2-2, Suita Osaka 565-0871, Japan; e-mail: kitamura@patho.med.osaka-u.ac.jp.

