Diffuse large B-cell lymphoma (DLBCL) is characterized by a marked degree of morphologic and clinical heterogeneity. Establishment of parameters that can predict outcome could help to identify patients who may benefit from risk-adjusted therapies. BCL-6 is a proto-oncogene commonly implicated in DLBCL pathogenesis. A real-time reverse transcription–polymerase chain reaction assay was established for accurate and reproducible determination of BCL-6 mRNA expression. The method was applied to evaluate the prognostic significance ofBCL-6 expression in DLBCL. BCL-6 mRNA expression was assessed in tumor specimens obtained at the time of diagnosis from 22 patients with primary DLBCL. All patients were subsequently treated with anthracycline-based chemotherapy regimens. These patients could be divided into 2 DLBCL subgroups, one with high BCL-6 gene expression whose median overall survival (OS) time was 171 months and the other with low BCL-6 gene expression whose median OS was 24 months (P = .007). BCL-6 gene expression also predicted OS in an independent validation set of 39 patients with primary DLBCL (P = .01). BCL-6 protein expression, assessed by immunohistochemistry, also predicted longer OS in patients with DLBCL. BCL-6 gene expression was an independent survival predicting factor in multivariate analysis together with the elements of the International Prognostic Index (IPI) (P = .038). By contrast, the aggregate IPI score did not add further prognostic information to the patients' stratification byBCL-6 gene expression. High BCL-6 mRNA expression should be considered a new favorable prognostic factor in DLBCL and should be used in the stratification and the design of risk-adjusted therapies for patients with DLBCL.
Introduction
Diffuse large B-cell lymphomas (DLBCLs) represent the most frequent type of non-Hodgkin lymphomas (NHL), accounting for 30% to 40% of adult NHL.1 DLBCLs represent a diverse group of lymphoid neoplasms and encompass heterogeneous clinical, histologic, immunophenotypic, cytogenetic, and molecular genetic features.2 However, previous attempts to subclassify these neoplasms on morphologic grounds have suffered from irreproducibility, leading to their categorization as one single group in the Revised European American Lymphoma (REAL) classification.2,3Chemotherapy has greatly improved the outcome for patients with DLBCL. However, approximately 50% of patients are not cured by the standard combination chemotherapy regimens, thus highlighting the need to determine parameters identifying patients at high risk for standard therapy failure who may benefit from risk-adjusted therapies. A clinical indicator of prognosis, the International Prognostic Index (IPI), has been constructed and successfully used to define prognostic subgroups in DLBCL.4 The IPI takes into account factors that are mostly linked to patient characteristics (age, performance status) and to disease extension and growth (disease stage, lactate dehydrogenase [LDH] levels, and extent of extranodal involvement). However, it is clear that differences in clinical features and in treatment responses of DLBCL are owing to the marked genetic and molecular heterogeneity that underlies disease aggressiveness and tumor progression. Several molecular abnormalities, such as BCL-25-9 and survivin10 expression and p53 mutations,7,11,12 were identified as prognostic indicators of DLBCL. However, at least in p53 expression, contradictory results were reported in several studies, probably stemming from methodological differences.7,11,12 BCL-2 expression was reported to correlate with reduced disease-free survival (DFS),6,8,9 but it only predicted reduced overall survival (OS) for patients with DLBCL in one of the reported studies.6,8 9
Recently, we evaluated DLBCL gene expression profiling by DNA micro-array techniques.13 Application of hierarchical clustering to the gene expression data identified 2 molecularly distinct forms of DLBCL: germinal center–like DLBCL characterized by the expression of genes normally expressed in germinal center (GC) B cells and activated B cell–like DLBCL characterized by the expression of genes normally induced during in vitro activation of B cells. Considerable gene expression heterogeneity was present within each DLBCL subgroup, and no single gene absolutely correlated in expression with either of these 2 DLBCL subgroups. These 2 subgroups of DLBCL were also found to be distinct with respect to the presence of ongoing mutations of the immunoglobulin genes, with the GC type showing evidence of ongoing mutations and the activated B-cell type showing none.14 Patients with the GC and the activated B cell–like forms of DLBCL were found to have different prognoses—those with GC-like DLBCLs had significantly better OS times than those with activated B cell–like DLBCLs.15 This molecular definition of DLBCL subgroups added to the prognostic value of the IPI. These findings suggested that the cellular origin of DLBCL might determine lymphoma aggressiveness and tumor progression.
The BCL-6 gene is normally expressed in B and CD4+ T cells within the GC,16 and it controls GC formation and T-cell–dependent antigen responses.17,18It is considered one of the hallmarks of the GC and is expressed in NHL whose origin is from GC B lymphocytes. The BCL-6 gene is also regarded to be a proto-oncogene by virtue of its recurrent involvement in chromosomal translocations repeatedly found in DLBCL.19-22BCL-6 gene expression may be deregulated by these translocations23 or by mutations affecting its 5′ nontranslated regulatory region.24Previous attempts to evaluate the prognostic significance ofBCL-6 rearrangements led to contradictory results; one study suggested better overall survival in DLBCL with rearrangedBCL-6 gene,25 whereas 2 other studies showed similar outcomes in DLBCL with and without rearranged BCL-6gene.5 20 However, the effect of BCL-6 gene expression on DLBCL patient outcome was not studied. The purposes of this study were to establish a robust method for the measurement of BCL-6 mRNA expression and to determine the clinical usefulness ofBCL-6 gene expression for predicting OS in DLBCL patients treated with anthracycline-based chemotherapy at a single institution.
Materials and methods
Patient material and cell lines
For establishment of the real-time quantitative reverse transcription–polymerase chain reaction (RT-PCR) method for evaluation of BCL-6 mRNA expression, we obtained Raji, K562, and HL-60 cell lines from the American Tissue Type Culture Collection (Rockville, MD). Cell lines were maintained in RPMI 1640 (Fisher Scientific, Santa Clara, CA), 10% heat-inactivated fetal calf serum, 2 mM/L glutamine (Gibco BRL, Grand Island, NY), and penicillin–streptomycin (Gibco BRL). In addition, for positive control of the assay, we used total GC B cells, purified from 3 human tonsils as described,13 and 23 specimens of primary follicle center lymphoma (FCL), randomly chosen from a collection of FCL frozen viable cells, because both are known to express high levels of BCL-6 mRNA.13
DLBCL tissues were chosen randomly from a collection of specimens obtained during the course of diagnostic procedures between 1983 and 1993. Tumor tissues were stored either as fresh-frozen biopsy specimens embedded in Tissue-Tek Optimal Cutting Temperature (OCT) compound 4583 (Miles, Elkhart, IN) and preserved at −80° or as frozen viable cell suspensions in 10% dimethyl sulfoxide in liquid nitrogen. Tumor tissues chosen for the DLBCL study were from untreated patients with a diagnosis of primary DLBCL (63 specimens) according to the REAL classification. Specimens were chosen based on (1) diagnosis of primary DLBCL; (2) availability of the tissue specimen obtained at diagnosis, before the initiation of therapy; (3) treatment with an anthracycline-containing chemotherapy; and (4) follow-up at Stanford University Hospital and availability of the outcome data. In all patients chosen for the study, disease dissemination was evaluated before treatment by physical examination, bone marrow biopsy, and computed tomography of the chest, abdomen, and pelvis. All patients were staged according to the Ann Arbor system. IPI score could be determined for 55 patients. Chosen tissue specimens were reviewed to confirm the diagnosis according to the REAL classification before RNA extraction. All the DLBCL tumors had the histologic appearance of centroblastic large cell lymphomas demonstrating diffuse patterns of involvement without evidence of residual reactive follicles. Two of the 63 DLBCL specimens were excluded from the study after a review of patient histories and pathology slides revealed that one of the patients had a diagnosis of stage 1 FCL 15 years earlier and another had concomitant Hodgkin lymphoma.
Real-time polymerase chain reaction measurement of BCL-6 mRNA expression
Total cellular RNA was isolated using the RNeasy kit (Qiagen, Valencia, CA) according to the manufacturer's instructions. BCL-6 mRNA expression was measured by real-time quantitative RT-PCR using the TaqMan technology. Because the precise amount of total RNA added to each reaction mix and its quality (ie, extent of RNA degradation) were difficult to assess, we also quantified the level of glyceraldehyde-3-phosphate dehydrogenase (GAPDH) as the endogenous RNA control, and each sample was normalized on the basis of its GAPDH content. For each experimental sample, the amount of the target BCL-6 and endogenous reference (GAPDH) were determined from the calibration curves obtained by serial dilution of control human RNA (PE Applied Biosystems, Foster City, CA). BCL-6 amount was then divided by the endogenous reference (GAPDH) amount to obtain a normalized target value. To allow the relative expression of BCL-6 gene to be compared across all the tested samples, sample BCL-6–GAPDH expression was also normalized to the BCL-6–GAPDH values concomitantly measured in Raji cells (calibrator) as suggested in ABI 7700 user Bulletin 2 (PE Applied Biosystems). For each RT of sample RNA, a master mix was prepared and run in sextuplet in a 96-well plate in a final volume of 10 μL containing 1× TaqMan RT buffer, 5.5 mM MgCl2, 500 μM each dNTP, 2.5 μM random hexamers, 0.4 U/μL RNase inhibitor, 1.25 U/μL MultiScribe reverse transcriptase (PE Applied Biosystems), and 20 ng total RNA. Samples were incubated at 25°C for 10 minutes and at 48°C for 30 minutes. Heating to 95°C for 5 minutes inactivated the reverse transcriptase.
For each PCR run, a master mixture was prepared at 4°C with 1× TaqMan buffer; 5.5 mM MgCl2; 200 mM dATP, dCTP, and dGTP; 400 mM dUTP; 0.01 U/μL AmpErase UNG; and 0.025 U/μL AmpliTaq Gold DNA polymerase (PE Applied Biosystems). The BCL-6 andGAPDH genes were amplified in the presence of 400 nM BCL-6 primers or 200 nM GAPDH primers (Table1), which were chosen to hybridize to sequences at the junction between 2 exons or in different exons to avoid amplification of genomic DNA, and 100 nM appropriate probe (Table1) labeled with 6-carboxy-fluorescein phosphoramidite (FAM) at the 5′ end and with 6-carboxy-tetramethyl-rhodamine (TAMRA) as quencher at the 3′ end. Forty microliters of appropriate master mix were added to 10 μL RT sample. All the real-time quantitative PCR reactions were performed on an ABI Prism 7700 Sequence Detection System (PE Applied Biosystems) that captured the fluorescent signal and generated a real-time amplification plot. Threshold cycle (Ct)—the fractional cycle number at which the amount of amplified target reached a fixed threshold—was determined, defined as 10 times the standard deviation of the baseline fluorescent signal of the first few PCR cycles. Thermal cycling conditions comprised an initial UNG incubation at 50°C for 2 minutes, AmpliTaq Gold activation at 95°C for 10 minutes, 40 cycles of denaturation at 95°C for 15 seconds, and annealing and extension at 60°C for 1 minute. Each RT-PCR run included the 5 points of the calibration curve for BCL-6 and GAPDH (5-fold diluted human RNA), a no-template control, the calibrator Raji RNA, and the patient's samples, all in triplicate.
Immunohistochemistry
Paraffin blocks were available for 30 study patients. A primary antibody directed against BCL-6 (courtesy of Dr Brunangelo Falini, Department of Hematology, Perugia University, Italy26,27) was used for immunohistochemical staining. Serial sections of 4 μm were cut from paraffin blocks, de-paraffinized in xylene, and hydrated in a graded series of alcohol solutions. This was followed by heat-induced antigen retrieval carried out by microwave pretreatment in EDTA (1 mM, pH 8.0) for 15 minutes before staining. Endogenous peroxidase was blocked by preincubation with 1% hydrogen peroxide in phosphate-buffered saline. Staining detection was carried out using a modified biotin-streptavidin–horseradish peroxidase method.28
Staining for BCL-6 was localized predominantly to the nucleus. Staining of lymphoma cells was defined as negative if no staining or staining in less than 10% of lymphoma cells was observed. Staining of lymphoma cells was defined as positive if more than 10% of lymphoma cells stained with the antibody. Two pathologists independently performed interpretation of the immunostaining without knowledge of the real-time RT-PCR results.
Statistical analysis
Intra-run and inter-run variability was assessed by coefficient of variation (CV) using Excel computer software. OS time of patients with DLBCL was calculated from the date of diagnosis until death or last follow-up examination. DFS was measured as the interval between the date of complete remission after induction treatment and the date of relapse, death, or date of last follow-up evaluation. Survival curves were estimated using the product-limit method of Kaplan-Meier and were compared using the log-rank test. Multivariate regression analysis according to the Cox proportional hazards regression model,29 with OS as the dependent variable, was used to adjust the effect of BCL-6 expression for IPI. P < .05 was considered significant.
Results
BCL-6 gene and internal control primers and probes
To assess the expression of the BCL-6 gene, the probe and the primers were designed, which hybridized to sequences between 2 exons to avoid the amplification of genomic DNA. No measurable fluorescence signal was detected in repeated RT-PCR runs in which the reverse transcriptase was omitted from the reaction mixture. Primers were tested by standard endpoint RT-PCR, and the single band obtained was sequenced directly to ensure its origin from the BCL-6gene (data not shown).
To ensure that the quantitation of BCL-6 gene expression in serial samples was not affected by differences in the amount of RNA added, integrity of RNA, or sample-to-sample differences in levels of RT-PCR inhibition, an internal control reaction targeting theGAPDH gene was run with each BCL-6 gene reaction. The GAPDH gene was chosen as an internal control because in our previous experiments using DNA micro-arrays, we found that its expression is constant in a large set of different lymphoma samples. The GAPDH gene has well-characterized primers and TaqMan probe that are commercially available. However, the performance of the GAPDH probe labeled with JOE (2,7-dimethoxy-4,5 dichloro-6 carboxyfluorescin) and supplied by the PE Applied Biosystems was less reproducible than the performance of the same probe labeled with FAM. Therefore, both the BCL-6 and theGAPDH probes were labeled with FAM at the 5′ end and with TAMRA as quencher at the 3′ end, and the reactions were run side by side and not multiplexed.
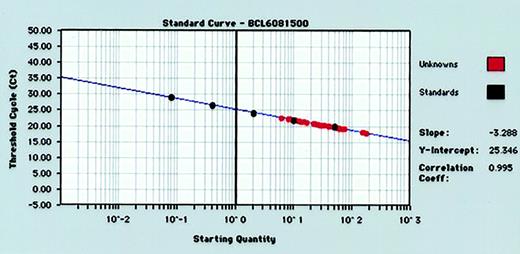
For each RT-PCR run, standard curves for BCL-6 andGAPDH gene quantitation were produced by serial 5-fold dilutions of control human RNA into water and performance of real-time RT-PCR (Figure 1). Standard curves from the data collected in triplicate for both BCL-6 andGAPDH genes reproducibly resulted in correlation coefficients of more than 0.980 for both BCL-6 andGAPDH genes. The GAPDH values were used to normalize BCL-6 values as described in “Materials and methods.”
Representative standard curve for quantifying BCL-6 gene expression in tumor specimens.
Human RNA is diluted 5-fold in 5 increments (from 50 ng to 0.08 ng) and subjected to real-time quantitative RT-PCR in triplicate. RNA input of standards is plotted against threshold cycle (Ct) to create a standard curve for quantitation of the BCL-6 mRNA of unknown tumor samples.
Reproducibility
Reproducibility of the quantitation method was examined by comparing results obtained from replicate samples during the same reaction run (intra-run variability) and on different days (inter-run variability). Intra-run variability analysis was performed on 5-fold dilutions of RNA obtained from the Raji cell line. For this experiment, 6 replicates at each dilution of Raji cell line RNA were amplified. There was little variability in the Ct of the 6 replicates at each dilution of Raji cell line RNA (Table 2). Inter-run variability was assessed by performing real-time RT-PCR on 6 replicates of 20 ng Raji cell RNA on 4 separate days. When the mean Ct of 6 replicate measures from each day are compared, the CV is 1.9%; no pair of results had a difference of more than 0.5 log. We assessed the inter-run variability at 20 ng RNA input because for all our future experiments on tissue samples, we used this RNA amount in each reaction run.
BCL-6 gene expression measurements in non-DLBCL specimens
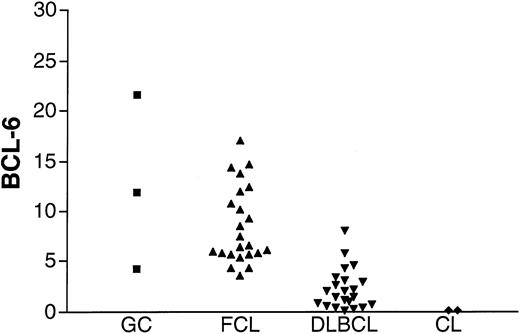
To assess the validity of the method, BCL-6 gene expression was measured in K562 and HL-60 cell lines that previously were shown not to express BCL-6, in GC lymphocytes, and in FCL specimens known to express BCL-6 (Figure2). Barely detectable levels of BCL-6 were found in the K562 and HL-60 cell lines in agreement with previous evaluations of BCL-6 gene expression by Northern blot analysis. BCL-6 gene expression was detected, as expected, in all GC lymphocyte preparations and in all FCL specimens. A similar range of BCL-6 gene expression was observed in GC cells and in FCL specimens.
BCL-6 mRNA expression in unknown samples.
BCL-6 mRNA expression was evaluated in GC cells (▪) obtained from 3 tonsils from healthy donors, 23 FCL (▴) specimens, 22 DLBCL (▾) specimens from the derivation set, and K562 and HL-60 cell lines (CL, ♦).
BCL-6 mRNA expression in unknown samples.
BCL-6 mRNA expression was evaluated in GC cells (▪) obtained from 3 tonsils from healthy donors, 23 FCL (▴) specimens, 22 DLBCL (▾) specimens from the derivation set, and K562 and HL-60 cell lines (CL, ♦).
BCL-6 gene expression in DLBCL specimens
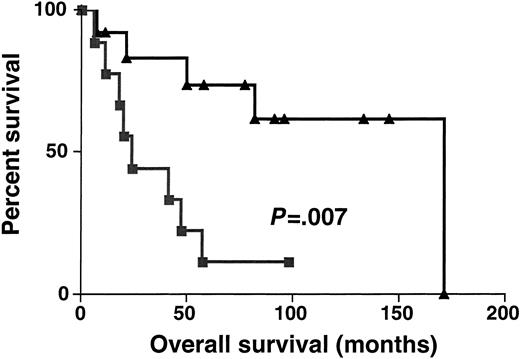
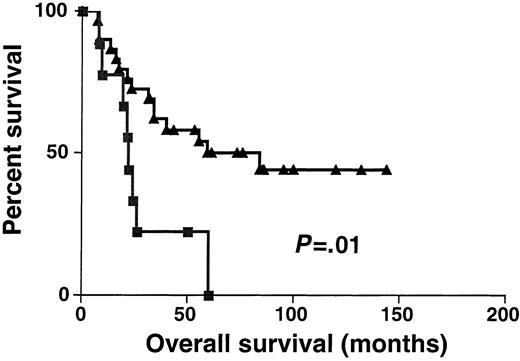
Sixty-one DLBCL specimens were tested for BCL-6 gene expression. Before performance of the real-time RT-PCR, the specimens were randomly divided into 2 sets: the derivation set (22 samples) and the validation set (39 samples). Both sets were similar in their pretreatment clinical characteristics. We divided the specimens in the derivation set into 2 subgroups: DLBCL with high BCL-6 gene expression (greater than 1.3) and DLBCL with low BCL-6 gene expression (equal to or lower than 1.3). The 1.3 cut-off was chosen by permutation analysis of different cut-offs in the derivation set and appeared to coincide with the median BCL-6 expression in Mantle cell lymphomas, which are thought to be BCL-6–negative by less sensitive conventional methods (data not shown). With a median follow-up of 49 months (range, 6-171 months), the OS rate was significantly higher in the DLBCL patients with high BCL-6 gene expression than in the DLBCL patients with low BCL-6 gene expression (median OS of 171 and 24 months, respectively; P = .007 (Figure3). To validate the power ofBCL-6 gene expression in DLBCL for the prediction of OS, we examined BCL-6 gene expression in the validation set of DLBCL (Figure 4). With a median follow-up of 34 months (range, 7-144 months), the OS rate in the validation set was also significantly higher in the DLBCL patients with highBCL-6 gene expression than in the DLBCL patients with lowBCL-6 gene expression (median OS of 84 and 22 months, respectively; P = .01) (Figure 4). Because the derivation and the validation sets were similar in all the clinical parameters and in the outcome prediction by BCL-6 mRNA expression, and because the number of examined cases was small, we combined these 2 groups for further analysis.
Kaplan-Meier curves in derivation set.
Kaplan-Meier curves of OS in the derivation set of 22 patients with DLBCL according to high (greater than 1.3, ▴) and low (no more than 1.3, ▪) BCL-6 mRNA expression. BCL-6–high cases, n = 13; BCL-6–low cases, n = 9.
Kaplan-Meier curves in derivation set.
Kaplan-Meier curves of OS in the derivation set of 22 patients with DLBCL according to high (greater than 1.3, ▴) and low (no more than 1.3, ▪) BCL-6 mRNA expression. BCL-6–high cases, n = 13; BCL-6–low cases, n = 9.
Kaplan-Meier curves in validation set.
Kaplan-Meier curves of OS in the validation set of 39 patients with DLBCL according to high (greater than 1.3, ▴) and low (no more than 1.3, ▪) BCL-6 mRNA expression. BCL-6–high cases, n = 30; BCL-6–low cases, n = 9.
Kaplan-Meier curves in validation set.
Kaplan-Meier curves of OS in the validation set of 39 patients with DLBCL according to high (greater than 1.3, ▴) and low (no more than 1.3, ▪) BCL-6 mRNA expression. BCL-6–high cases, n = 30; BCL-6–low cases, n = 9.
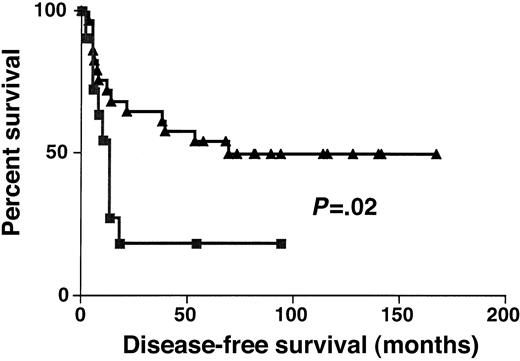
Complete remission rates in DLBCL groups with high (greater than 1.3) and low (1.3) BCL-6 gene expression were 74% and 67%, respectively (P > .05). DFS was significantly longer in DLBCL groups with high (greater than 1.3) rather than low (equal to or lower than 1.3) BCL-6 gene expression (P = .02) (Figure 5). Event-free survival was also significantly longer in DLBCL groups with high (greater than 1.3) rather than low (equal to or lower than 1.3) BCL-6 gene expression (P = .03) (data not shown).
Disease-free survival.
Kaplan-Meier curves of DFS of high (greater than 1.3, ▴) and low (no more than 1.3, ▪) BCL-6 expression in DLBCL.
Disease-free survival.
Kaplan-Meier curves of DFS of high (greater than 1.3, ▴) and low (no more than 1.3, ▪) BCL-6 expression in DLBCL.
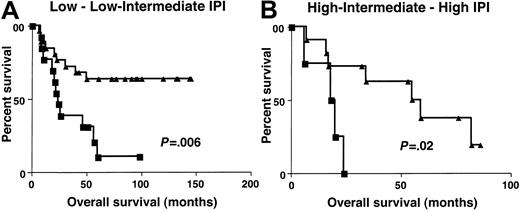
Clinical characteristics at presentation were similar in patients with high (greater than 1.3) and low (equal to or lower than 1.3)BCL-6 gene expression (Table3). To determine whether the molecular definition of DLBCL subgroups by BCL-6 gene expression could add to the prognostic value of IPI, the OS of patients with high (greater than 1.3) and low (equal to or lower than 1.3)BCL-6 gene expression was evaluated separately in patients with low–low intermediate and high intermediate–high IPI scores. Because of the small number of patients in each IPI score subgroup, we combined patients with low or low intermediate (low clinical risk) and high intermediate or high (high clinical risk) scores from both the derivation and the validation sets. The IPI score in this group of patients did not predict patient outcome, probably because of the relatively small number of patients in the group at high clinical risk. However, considering patients with low clinical risk separately, as judged by IPI, patients in the high (greater than 1.3) BCL-6gene expression group had a distinctly better OS than patients with low (equal to or lower than 1.3) BCL-6 gene expression (P = .006) (Figure 6). In patients with high clinical risk, as judged by IPI, the OS was also significantly longer in patients with high (greater than 1.3)BCL-6 gene expression (P = .02). Multivariate regression analysis that included IPI and BCL-6, with OS as the dependent variable, demonstrated that BCL-6 mRNA expression is an independent predictor of OS in DLBCL patients (P = .003). Multivariate regression analysis that included independent components of the IPI score and the BCL-6, with OS as the dependent variable, demonstrated that BCL-6 mRNA expression and LDH levels were 2 independent predictors of OS in these DLBCL patients (Table4).
Overall survival in low and high clinical risk groups.
Kaplan-Meier curves of OS in patients with DLBCL of low clinical risk (A, IPI score, 0-2) and high clinical risk (B, IPI score, 3-5) grouped on the basis of BCL-6 gene expression. BCL-6 greater than 1.3, ▴; BCL-6 no more than 1.3, ▪.
Overall survival in low and high clinical risk groups.
Kaplan-Meier curves of OS in patients with DLBCL of low clinical risk (A, IPI score, 0-2) and high clinical risk (B, IPI score, 3-5) grouped on the basis of BCL-6 gene expression. BCL-6 greater than 1.3, ▴; BCL-6 no more than 1.3, ▪.
To further assess the strength of BCL-6 in predicting survival, we fit Cox proportional hazards model with BCL-6 as the predictor. Given that there was one large BCL-6 value (32.5), it was not appropriate to use the exact values in the model. Hence, we converted BCL-6 exact expression values to ranks and used the ranks as the predictor. In univariate and multivariate analyses, including IPI, BCL-6 expression predicted the OS of the DLBCL patients (P = .023 andP = .045, respectively).
Correlation with immunohistochemistry
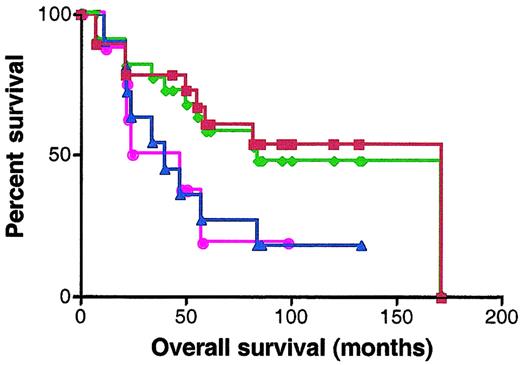
BCL-6 protein expression was analyzed by staining with anti–BCL-6 antibody in 30 patients for whom paraffin-embedded samples were available. Scoring was performed without knowledge of the RNA expression results. Specimens were classified as BCL-6–negative or –positive according to the criteria described in “Materials and methods.” Nineteen specimens were defined as BCL-6 positive and 11 specimens as BCL-6 negative. The OS of BCL-6–positive cases was significantly better than the OS of the BCL-6–negative cases (median OS of 171 and 40 months, respectively; P = .049) (Figure7). There were 7 discrepancies in categorization of the samples as BCL-6 positive and negative and as expressing high and low BCL-6 mRNA levels by immunohistochemistry and quantitative real-time PCR, respectively. Absence of concordance between BCL-6 mRNA and protein expression has been previously reported.30 However, similar prediction of better outcome in patients expressing elevated levels of BCL-6 was observed by both methods (Figure 7).
Kaplan-Meier curves of OS of 30 patients analyzed for BCL-6 expression by real-time RT-PCR and immunohistochemistry.
Red curve, OS of DLBCL patients expressing BCL-6 protein in more than 10% of malignant cells by immunohistochemistry; blue curve, OS of DLBCL patients expressing BCL-6 protein in less than 10% of malignant cells by immunohistochemistry; green curve, OS of DLBCL patients with high (greater than 1.3) BCL-6 mRNA expression; pink curve, OS of DLBCL patients with low (no more than 1.3) BCL-6 mRNA expression.
Discussion
In this study we had 2 aims: to design a specific, reproducible, and robust method for quantitative measurement of BCL-6 gene RNA expression and to evaluate whether BCL-6 gene expression has prognostic significance in DLBCL.
The BCL-6 gene, identified by virtue of its involvement in chromosomal translocations affecting band 3q27, encodes a POZ/Zinc finger sequence-specific transcriptional repressor.31-33Clonal BCL-6 rearrangements cluster within a highly conserved 4.0-kb regulatory region spanning the first noncoding exon containing the promoter and the 5′ region of the first intron—the major breakpoint region.21-23 These rearrangements, observed in 30% to 40% of DLBCLs,20,23,34 result in promoter substitution that leads to deregulated BCL-6 gene expression.21,23 In addition, recent studies disclosed somatic point mutations in 50% to 70% of DLBCLs.35-37Although these mutations occur in the subdomain of the BCL-6regulatory region overlapping with the major breakpoint region, their occurrence is independent of translocation-generated rearrangements. Some of these mutations can significantly deregulate BCL-6expression.24 In addition to its potential role in the pathogenesis of NHL, the BCL-6 gene has an important function in normal lymphocytes. The BCL-6 gene is normally expressed at low levels in a wide variety of tissues, but it is abundantly expressed only in GC B and CD4+ T cells and cortical thymocytes.16 It controls GC formation and participates in the regulation of immune responses.17 18
A simple and precise quantitative method for measurement ofBCL-6 gene expression has not been available. Immunostaining with anti–BCL-6 antibodies is a semiquantitative method that is difficult to standardize. Evaluation of the BCL-6 gene expression by Southern or Western blot analysis requires relatively large amounts of tumor specimens for RNA and protein extraction, respectively. In addition, it is difficult to quantify, may require the use of radioactive materials, and is time consuming and tedious. Evaluation of large numbers of specimens by these methods in a timely fashion may be difficult. Real-time quantitative PCR forBCL-6 gene expression was developed to address the deficiencies of traditional methods. Real-time quantitative PCR exploits the 5′–3′ nuclease activity associated with Taq DNA polymerase and uses a nonextendable, fluorogenically labeled oligonucleotide probe that is target specific.38 During the extension phase of PCR, the reporter dye from the probe is cleaved, producing a fluorescence signal detected with a charge-coupled device camera. The amount of fluorescence produced in a reaction is proportional to the starting target amount during the early phases of amplification. Real-time RT-PCR for BCL-6 gene expression has several advantages—multiple reactions can be run at the same time, the methodology is sensitive and therefore requires a minimal sample (20 ng RNA was used in the present work), and the method is robust and does not require postreaction manipulation, which saves time and reduces the risk for laboratory contamination with PCR product. Using this method, RNA obtained from fine-needle aspiration is sufficient for quantification of BCL-6 mRNA expression in the tumor, and it is possible to obtain quantitative results on the day of biopsy.
In our previous study, we demonstrated that the differentiation stage of B lymphocyte at which neoplastic transformation occurs defines the biologic behavior and the outcome of DLBCL.13 In that study, GC-like DLBCL, defined by a cluster of genes whose expression pattern was similar to gene expression in GC lymphocytes, had a better OS than the activated B cell–like DLBCL. Considerable gene expression heterogeneity existed within each subgroup, and no single gene in either of these large clusters was absolutely correlated in expression with the DLBCL subgroup taxonomy. In the present study, we wanted to investigate whether the assessment of expression of a single GC-specific gene by an accurate and sensitive method would predict the OS of patients with DLBCL. The BCL-6 gene is a good candidate gene for such a study because its expression is necessary for GC formation17 and is strictly regulated so that it is almost exclusively expressed only in GC lymphocytes or lymphomas originating at the GC differentiation stage.16
Previous studies investigated the prognostic significance of theBCL-6 rearrangements and mutations in DLBCL. Offit et al25 reported a better clinical outcome of patients withBCL-6 gene rearrangements. However, 2 subsequent studies failed to show improved survival in DLBCL patients withBCL-6 gene rearrangements.5,20 AlthoughBCL-6 gene rearrangement may deregulate BCL-6gene expression,21,23 patients with DLBCL harboring this rearrangement but not expressing BCL-6 have been reported.39,40 The presence of BCL-6 gene mutations also did not affect patients survival in DLBCL.37 In none of these studies was BCL-6 mRNA or protein expression evaluated.
In the present study, we evaluated the impact of BCL-6 mRNA expression on DLBCL outcome. Despite the relatively small number of cases evaluated, the study shows that BCL-6 mRNA expression has prognostic significance in patients with DLBCL. BCL-6 mRNA expression in DLBCL tumors with a cut-off of 1.3, as established in the derivation set and cross-validated in the validation set of patients, predicts DLBCL patient overall survival: patients with high (greater than 1.3)BCL-6 gene expression had significantly better overall survival than DLBCL patients with low (equal to or lower than 1.3)BCL-6 gene expression. Moreover, our study demonstrates that the BCL-6 gene expression can further stratify patients with low and high clinical risk, as defined by the IPI, and that it predicts DLBCL subgroups with different OS in each IPI clinical risk subgroup. Moreover, even in a small group of patients with DLBCL in whom IPI score may not predict the outcome, probably because of the small sample size in each IPI category (as shown in our study group),BCL-6 gene expression may accurately stratify patients into good and bad prognostic groups, thus suggesting its high robustness compared to the IPI score. BCL-6 was an independent prognostic factor in multivariate analysis when tested side by side with the IPI score or separately with each of the components of the IPI. In approximately half our patients, we also assessed whether immunohistochemistry using anti–BCL-6 antibody may discriminate between DLBCL patients with different outcomes. Indeed, immunohistochemistry also separated DLBCL tumors according to whether they did or did not express BCL-6 and demonstrated better OS in patients whose tumors expressed BCL-6, thus suggesting their GC origin. The predictive power of each method (immunohistochemistry and real-time RT-PCR) was similar; however, the number of cases analyzed by both methods was small. Real-time RT-PCR is quantitative and robust and is not dependent on the interpretative skills of the person performing the analysis, whereas immunohistochemistry is more widely available but is semiquantitative and may result in inter-observer variation. Future large-scale side-by-side comparisons of both methods will demonstrate whether one method is better than the other in predicting OS of patients with DLBCL.
In the present study, we have demonstrated that the expression of a single gene, BCL-6, can predict the outcome of patients with DLBCL. Concomitant analysis of mRNA expression of an additional gene whose expression is characteristic of GC origin, CD10, did not add to the predictive power of BCL-6 mRNA expression (data not shown). Whether BCL-6 gene expression can predict OS for patients with DLBCL as well as or better than multiple gene expression profiling by cDNA micro-arrays is unknown. In our preliminary experiments on a limited number of cases, there was a good correlation between grouping of DLBCL patients into the GC-like DLBCL and the activated B cell–like DLBCL by cDNA micro-arrays and grouping of DLBCL cases into tumors with high and low BCL-6 gene expression by quantitative RT-PCR, respectively (data not shown). Future studies will determine in a side-by-side comparison the predictive power of both methods in the same patients. Examination of the OS and DFS curves (Figures 4-6) in DLBCL groups with high and low BCL-6 gene expression demonstrates that during the first year, the rates of death and relapse are similar in the 2 groups; subsequently, the curves diverge and the outcome are different. Identification of additional prognostic factors that may identify DLBCL patients with different early outcomes may further contribute to the predictive power ofBCL-6 gene expression as a prognostic indicator in DLBCL.
In summary, in the present study, we demonstrate that BCL-6 mRNA and protein expression are important independent predictors of OS in patients with DLBCL. Further large-scale studies are needed to confirm our findings. Consideration should be given to incorporateBCL-6 gene expression measurement into the design of treatment strategies aimed at improving the outcome of patients with DLBCL by up-front risk-adjusted therapies.
Supported by grants CA33399 and CA34233 from the United States Public Health Service–National Institutes of Health. R.L. is an American Cancer Society Clinical Research Professor.
The publication costs of this article were defrayed in part by page charge payment. Therefore, and solely to indicate this fact, this article is hereby marked “advertisement” in accordance with 18 U.S.C. section 1734.
References
Author notes
Ronald Levy, Department of Medicine, Division of Oncology, Rm 1105, Stanford University School of Medicine, Stanford, CA 94305-5151; e-mail: levy@stanford.edu.

