Abstract
It is thought that human T-cell lymphotropic virus type I (HTLV-I) preferentially infects CD4+ T cells in vivo. However, observations of high HTLV-I proviral load in patients with HTLV-I–associated myelopathy/tropical spastic paraparesis suggest that HTLV-I may infect other cell types in addition to CD4+ T cells. To identify in vivo T-cell tropisms of HTLV-I, real-time quantitative polymerase chain reaction (PCR) and intracellular protein staining were used. A high amount of HTLV-I proviral DNA was detected from purified CD8+ T cells by quantitative PCR (between 1.64 and 62.83 copies of HTLV-I provirus per 100 isolated CD8+ T cells). CD8+ T cells expressed HTLV-I–related antigens (HTLV-I Tax and p19 protein) after a short time in cultivation. These results demonstrate that CD8+ T cells are also infected with HTLV-I and express HTLV-I antigens at levels that are comparable to HTLV-I–infected CD4+ cells. Therefore, CD8+ cells are an additional viral reservoir in vivo for HTLV-I and may contribute to the pathogenesis of HTLV-I–mediated disorders.
Introduction
Human T-cell lymphotropic virus type I (HTLV-I), the first human retrovirus to be discovered, was isolated originally from the cultured CD4+ T lymphocytes of a patient with cutaneous T-cell lymphoma.1 Soon after, HTLV-III/lymphadenopathy-associated virus was identified2,3 and subsequently renamed human immunodeficiency virus type 1 (HIV-1). These retroviruses predominantly infect CD4+ cells,4,5 an observation that directly led to defining CD4 as a receptor for HIV-1.6,7HTLV-I can cause a CD4+ T-cell malignancy termed adult T-cell leukemia/lymphoma (ATL)8 and an inflammatory neurologic disease called HTLV-I–associated myelopathy/tropical spastic paraparesis (HAM/TSP).9,10 More recently, other disorders have been associated with HTLV-I infection, including arthropathy,11 alveolitis,12myositis,13 and uveitis.14 Although the receptor for HTLV-I has not been identified, it is believed to be expressed on many cell types15 because HTLV-I infects a wide range of cells in vitro, including endothelial cells and fibroblasts.16 17
HTLV-I has been thought to preferentially infect CD4+ T cells in vivo.18 Studies demonstrating that the surface phenotype of typical ATL cells is CD4+19 supported the finding that CD4+ T cells were highly susceptible to HTLV-I. Mechanistically, HTLV-I is thought to transform infected CD4+ T cells through transactivation of host cellular genes by the HTLV-I Tax protein.20 Peripheral blood mononuclear cells (PBMCs) from HAM/TSP patients are known to proliferate spontaneously in vitro,21 and it has been suggested that the HTLV-I Tax protein in HTLV-I–infected CD4+ T cells transactivates interleukin (IL)-2 and its receptor, which is associated with this spontaneous lymphoproliferation.22 A few studies using polymerase chain reaction (PCR) suggested that non-CD4+ T cells were also infected with HTLV-I in vivo.23 24 However, the studies remain controversial because of the difficulty of excluding contamination with HTLV-I–infected CD4+ cells. In addition, the accuracy of quantitative PCR was not sufficient to allow firm conclusions.
Recently, a reliable and accurate real-time quantitative PCR technique (Taqman, Applied Biosystems, Foster City, CA) was developed.25 HTLV-I (pX) proviral load in HAM/TSP patients was assessed using this technology, and an extraordinarily high proviral load was demonstrated in these patients, ranging from 1.72 to 70.86 copies per 100 PBMCs. Two possibilities were considered to account for such a high proviral burden. First, HTLV-I may have infected other cell types in addition to CD4+ T cells. Second, multiple HTLV-I copies may infect a single cell. In support of the former hypothesis, we have shown that in PBMCs from HAM/TSP patients, both CD4+ and CD8+ T cells spontaneously proliferated. Moreover, the percentage of proliferating CD8+ T cells was 2 to 5 times higher than that of CD4+ T cells.26 Given this observation of the high HTLV-I proviral load in PBMCs from HAM/TSP patients, we hypothesized that, in addition to HTLV-I–infected CD4+cells, CD8+ T cells might also be infected with HTLV-I.
Patients and methods
Patients
Five patients with HAM/TSP (HAM-1 to HAM-5) were tested. The diagnosis of HAM/TSP was made according to neurologic assessment and serologic testing for anti–HTLV-I antibody. All patients had diagnostic cerebral and spinal magnetic resonance imaging. All patients had anti–HTLV-I antibodies in serum and cerebrospinal fluid and had a slowly progressive spastic paraparesis. Informed consent was obtained from all patients.
Cell preparation
PBMCs were isolated from peripheral blood samples on a density gradient with lymphocyte separation medium (ICN Biomedicals, Aurora, OH), and the cells were viably cryopreserved in liquid nitrogen until tested. CD4+ T cells or CD8+ T cells were negatively selected from PBMCs with magnetic beads (MACS CD4+ or CD8+ T-cell isolation kit; Miltenyi Biotech, Auburn, CA) according to the manufacturer's instructions.
HTLV-I Tax and p19 expression in PBMCs
PBMCs at 5 × 10⁵ were placed in a culture well (round-bottom 96-well plate) in 200 μL RPMI-1640 supplemented with L-glutamine, penicillin, streptomycin, and 5% human AB serum. Harvested cells were washed with phosphate-buffered saline containing 1% fetal calf serum and 0.1% NaN3 and incubated with anti–human CD4-phycoerythrin (Caltag Laboratories, Burlingame, CA) and anti–human CD8-Tricolor monoclonal antibodies (mAbs) (Caltag Laboratories) for 20 minutes at 4°C. Cells were then fixed and permeabilized with 4% formaldehyde and 0.1% saponin (CytoFix/Cytoperm Kits; Pharmingen, San Diego, CA) for 20 minutes at 4°C. After washing with 0.1% saponin buffer (Perm/Wash solution; Pharmingen), the cells were incubated with anti–HTLV-I Tax mAb (the reagent was obtained through the AIDS Research and Reference Reagent Program, Division of AIDS, National Institute of Allergy and Infectious Diseases, National Institutes of Health; HTLV-I Tax hybridoma [168A51-42] from Dr Beatrice Langton) or anti–HTLV-I p19 mAb (Chemicon International, Temecula, CA) for 30 minutes at 4°C. After washing, fluorescein isothiocyanate–conjugated goat F(ab′)2 anti–mouse IgG2a or IgG1 mAb (Southern Biotechnology Associates, Birmingham, AL) was used as second antibody for labeling anti–HTLV-I Tax mAb or anti–HTLV-I p19 mAb, respectively. Flow cytometric analyses were performed using a FACS Calibur (Becton Dickinson, Mountain View, CA).
Quantitative PCR
HTLV-I proviral load was measured using an ABI PRISM 7700 Sequence Detector (Applied Biosystems) as described previously.27 DNA was extracted from 1 × 10⁶ cells with the Puregene DNA Isolation Kit (Gentra, Minneapolis, MN) and was adjusted to 10 ng/μL. PCR conditions were as follows: 10 μL DNA solution was added to 40 μL reaction mixture containing 10 mM Tris-HCl (pH 8.3); 50 mM KCl; 10 mM EDTA; 60 nM ROX (passive reference dye to normalize receptor signal); 5.5 mM MgCl2; 0.2 μM of each primer; 0.1 μM Taqman probe; 200 μM each of dATP, dGTP, and dCTP; 400 μM dUTP; 0.5 U uracil-N-glycosylase; and 1.25 U Taq polymerase (Amplitaq Gold; Applied Biosystems).
The primer set for HTLV-I pX region was 5′-ACAAAGTTAACCATGCTTATTATCAGC-3′ positioned at 7276-7302 and 5′-ACACGTAGACTGGGTATCCGAA-3′ positioned at 7355-7334. The primer set for β-actin was 5′-CACACTGTGCCCATCTACGA-3′ positioned at 2146-2165 and 5′-CTCAGTGAGGATCTTCATGAGGTAGT-3′ positioned at 2250-2225. The Taqman fluorescent probe for HTLV-I pX region was 5′-TTCCCAGGGTTTGGACAGAGTCTTCT-3′ positioned at 7307-7332 and for β-actin was 5′-ATGCCCTCCCCCATGCCATCCTGCGT-3′ positioned at 2171-2196. The thermocycler conditions were as follows: 50°C for 2 minutes, 95°C for 10 minutes, then 45 cycles of 95°C for 15 seconds and 60°C for 1 minute.
The amount of HTLV-I proviral DNA was calculated by the following formula: copy number of HTLV-I (pX) per 100 cells = [(copy number of pX)/(copy number of β-actin/2)] × 100.
Results
HTLV-I proviral load in purified T-cell subsets
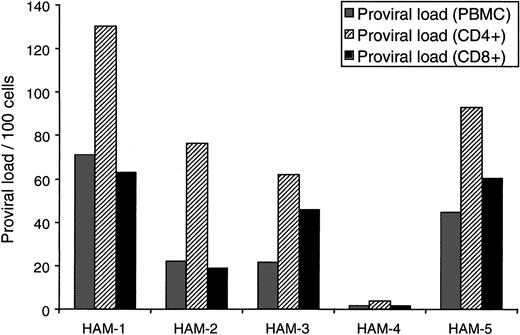
To determine the T-cell tropism of HTLV-I in vivo, we isolated CD4+ and CD8+ T cells from PBMCs of 5 HAM/TSP patients (purity of each T-cell subset is shown in Table1) and quantified the amount of HTLV-I proviral DNA in each cell fraction by Taqman PCR. As shown in Figure1, PBMCs from all HAM/TSP patients contained HTLV-I tax sequences in both CD8+ and CD4+ T cells. Between 1.64 and 62.83 copies of HTLV-I provirus per 100 isolated CD8+ T cells were observed (Figure 1). HTLV-I proviral DNA could not be amplified from HTLV-I–seronegative donors. This result strongly indicates that the HTLV-I–positive PCR signals of CD8+ T-cell fractions resulted from natural HTLV-I infection of CD8+ T cells in vivo. Given the high degree of purity (Table 1) and the extent of CD8+ infection, contaminating HTLV-I–infected CD4+ cells in the purified CD8+ population (even assuming every CD4+ T cell was infected) could not account for the high HTLV-I proviral load observed in HAM/TSP CD8+ cells. Even CD8+ T cells from HAM/TSP patient no. 4, with the lowest proviral load (1.72 copies per 100 PBMCs), contained 1.64 copies of HTLV-I per 100 CD8+T cells.
HTLV-I proviral load in purified T-cell subsets.
CD4+ T cells or CD8+ T cells were negatively selected from PBMCs. The purity of isolated populations is shown in Table 1. HTLV-I proviral load was measured using quantitative PCR for HTLV-I pX region and human β-actin. The gray bars indicate HTLV-I proviral load per 100 PBMCs, the striped bars indicate proviral load per 100 purified CD4+ T cells, and the black bars indicate proviral load per 100 purified CD8+ T cells.
HTLV-I Tax and p19 expression in PMBC
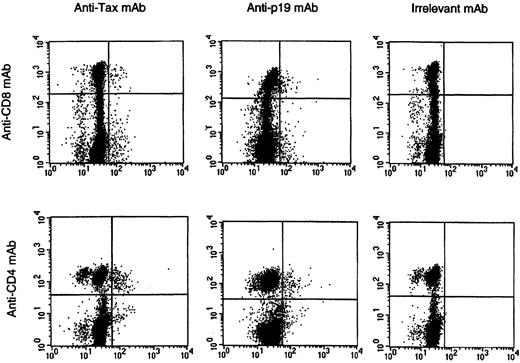
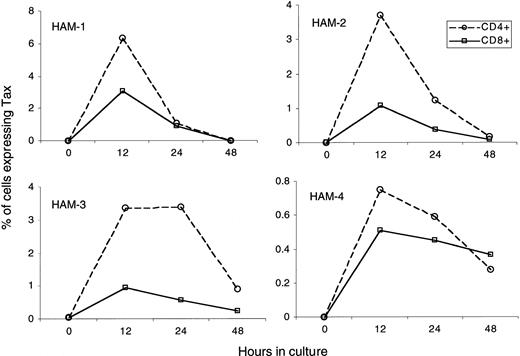
To address the question of whether HTLV-I–infected CD8+ cells express HTLV-I antigen, we cultured PBMCs from HAM/TSP patients for a short time and measured the expression of HTLV-I Tax and p19 (HTLV-I Gag) proteins using an intracellular protein-staining technique.28 As reported previously,28 detection of HTLV-I antigen-expressing cells in uncultured HAM/TSP PBMCs was negligible (Figure2, time 0) and was consistent with HTLV-I RNA analysis of fresh PBMCs from HAM/TSP patients.29However, after briefly cultivating these PBMCs in vitro, we could detect HTLV-I Tax and p19 protein in both CD4+ and CD8+ T cells (Figures 2, 3). Maximum viral antigen expression occurred after 12 hours of cultivation and then declined (Figure 2). The HTLV-I Tax expression time course of CD4+ populations was similar to that of CD8+cells, and all patients exhibited the same trend in protein expression. As expected from the HTLV-I proviral load data (Figure 1), the degree of Tax expression in CD8+ T cells was lower than that in CD4+ T cells (Figure 2). No HTLV-I Tax expression was observed in cells from HTLV-I–seronegative donors.
HTLV-I Tax expression in CD4+ or CD8+ T cells.
PBMC from four HAM/TSP patients were cultured for 0 hr, 12 hr, 24 hr, and 48 hrs. HTLV-I Tax and p19 expression of the cultured cells was measured at each time point. Graphs show Tax expression in CD4+ or CD8+ T cells over time. The open circle (dotted line) indicates percentage of Tax expressing CD4+ T cells in total CD4+ T cells. The open square (solid line) indicates percentage of Tax expressing CD8+ T cells in total CD8+ T cells.
HTLV-I Tax and p19 expression in PBMC.
A representative set of histograms from HAM/TSP patient #2 is shown following 12-hour cultivation. Top histograms show HTLV-I Tax and p19 expression on CD8+ T cells, and bottom histograms show Tax and p19 expression on CD4+ T cells. Irrelevant mAb was used as an isotype-matched control.
To exclude the possibility that HTLV-I antigen expression in CD8+ cells (Figures 2, 3) was due to infection of these cells by HTLV-I–infected CD4+ cells during the short-term (12-48 hours) in vitro culture, we isolated purified CD8+cells by negative selection from HAM/TSP PBMCs (more than 95% CD8+) and cultured them in vitro. After as little as 6 hours of in vitro incubation, HTLV-I Tax and p19 could be detected in these purified CD8+ cells (data not shown).
Percentage of HTLV-I infected CD4+ and CD8+T cells expressing Tax
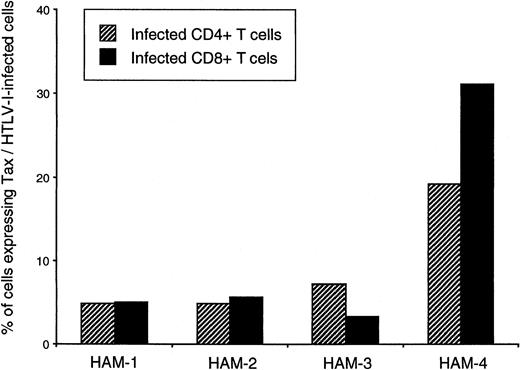
As an estimate of HTLV-I viral activity (viral protein expression) within these different T-cell populations, the proportion of peak Tax expression per infected cell was calculated for isolated CD4+ and CD8+ cells (Figure4). Surprisingly, this analysis suggested that in 3 of 4 HAM/TSP patients, the amounts of HTLV-I expressed per HTLV-I–infected CD4+ or CD8+ T cell were similar, and in one HAM/TSP patient (patient no. 4), the amount of HTLV-I expressed was even higher in CD8+ cells than in CD4+ cells (Figure 4).
Percentages of HTLV-1–infected CD4+ and CD8+ T cells expressing Tax in 4 HAM/TSP patients.
Percentages were calculated using the proviral load of CD4+and CD8+ isolates and maximum Tax expression observed in each T-cell type. Percentages of infected cells expressing Tax were calculated as follows: (number of CD4+ or CD8+cells expressing Tax/total number of CD4+ or CD8+ cells in PBMC culture)/(proviral load in purified CD4+ or CD8+ T cells). Striped bars represent percentages obtained for CD4+ T cells, and black bars represent proportions obtained for CD8+ T cells.
Discussion
Although HTLV-I has been thought to preferentially infect CD4+ T cells in vivo,18 in vitro CD8+ cells could also be infected and immortalized.30,31 In this study, we demonstrate that in PBMC of HAM/TSP patients, CD8+ T cells have a high amount of HTLV-I proviral DNA (Figure 1). CD8+ T cells also express HTLV-I related antigens (HTLV-I Tax and p19 protein) after a short time in cultivation (Figures 2, 3). These results strongly indicate that HTLV-I infects CD8+ T cells in vivo and these naturally infected CD8+ T cells have the ability to produce HTLV-I antigens. Similar observation that short-cultured CD8+ T cells from HTLV-I–infected individuals (HAM/TSP patients and asymptomatic HTLV-I carriers) expressed HTLV-I Tax protein has also been recently reported.32 Interestingly, it has been shown that both CD4+ and CD8+ T cells subsets were equally susceptible to HTLV-2 infection.33
High HTLV-I proviral loads have been demonstrated in patients with HAM/TSP27 and have been correlated with high immune responses, such as HTLV-I–specific cytotoxic T lymphocytes (CTLs)34 and anti–HTLV-I antibody.27 This elevated HTLV-I proviral load and high immune response have been suggested to play a role in HTLV-I–associated disease pathogenesis.35,36 It was originally believed that these high HTLV-I–specific immune responses were solely driven by HTLV-I–infected CD4+ T cells, which are elevated in patients with HAM/TSP.27 In vivo, HTLV-I–infected CD4+ T cells (helper T cells) were thought to become activated and present immunodominant viral peptides37 that stimulate virus-specific CD8+ CTLs. This high frequency of circulating HTLV-I–specific CTLs could then lyse these expanded, activated HTLV-I–infected CD4+ T cells, keeping the circulating viral infection in check.28 If virus-specific CTL recognition of antigen were to occur in a target organ containing HTLV-I–infected cells (heretofore thought only to be inflammatory HTLV-I–infected CD4+ T cells), then an immunopathologic process could ensue.35,36 38
The results in this report provide evidence that, similar to HTLV-I–infected CD4+ T cells, CD8+ T cells in PBMCs of HAM/TSP patients are infected with HTLV-I and are capable of expressing viral protein, including HTLV-I Tax. This protein is known to transactivate both viral and host genes, including IL-2, IL-2 receptor (IL2r),22 and IL-15.39 The transactivation of IL-15 by HTLV-I Tax is of particular interest because this newly described cytokine has been reported to be involved in the maintenance and expansion of memory CD8+ T cells.40 HTLV-I–infected CD8+ T cells may therefore have a role as a significant viral reservoir in vivo and may also drive the high HTLV-I–specific immune response observed in patients with HAM/TSP. It remains to be seen whether comparable levels of HTLV-I–infected CD8+ cells are also observed in ATL patients. This newly reported CD8+ cell tropism should be studied to clarify the pathogenesis of HTLV-I–associated disease and has implications for the therapy of HTLV-I–mediated disorders and other human retroviruses.
We thank Ms Samantha S. Soldan (National Institute of Neurological Disorders and Stroke, Bethesda, MD) for critical comments on this manuscript.
The publication costs of this article were defrayed in part by page charge payment. Therefore, and solely to indicate this fact, this article is hereby marked “advertisement” in accordance with 18 U.S.C. section 1734.
References
Author notes
Steven Jacobson, Viral Immunology Section, Neuroimmunology Branch, National Institute of Neurological Disorders and Stroke, National Institutes of Health, Bldg 10, Rm 5B-16, 9000 Rockville Pike, Bethesda, MD 20892; e-mail: jacobsons@ninds.nih.gov.


