Erythropoiesis results from the proliferation and differentiation of pluripotent stem cells into immature erythroid progenitors (ie, erythroid burst-forming units (BFU-Es), whose growth, survival, and terminal differentiation depends on erythropoietin (Epo). Ineffective erythropoiesis is a common feature of myelodysplastic syndromes (MDS). We used a 2-step liquid-culture procedure to study erythropoiesis in MDS. CD34+ cells from the marrow of patients with MDS were cultured for 10 days in serum-containing medium with Epo, stem cell factor, insulinlike growth factor 1, and steroid hormones until they reached the proerythroblast stage. The cells were then placed in medium containing Epo and insulin for terminal erythroid differentiation. Numbers of both MDS and normal control cells increased 103fold by day 15. However, in semisolid culture, cells from patients with refractory anemia (RA) with ringed sideroblasts and RA or RA with excess of blasts produced significantly fewer BFU-Es than cells from controls. Fluorescence in situ hybridization analysis of interphase nuclei from patients with chromosomal defects indicated that abnormal clones were expanded in vitro. Epo-signaling pathways (STAT5, Akt, and ERK 1/2) were normally activated in MDS erythroid progenitors. In contrast, apoptosis was significantly increased in MDS cells once they differentiated, whereas it remained low in normal cells. Fas was overexpressed on freshly isolated MDS CD34+ cells and on MDS erythroid cells throughout the culture. Apoptosis coincided with overproduction of Fas ligand during the differentiation stage and was inhibited by Fas-Fc chimeric protein. Thus, MDS CD34+-derived erythroid progenitors proliferated normally in our 2-step liquid culture with Epo but underwent abnormal Fas-dependent apoptosis during differentiation that could be responsible for the impaired erythropoiesis.
Introduction
The myelodysplastic syndromes (MDS) constitute a group of clonal hematopoietic stem cell disorders in which hematopoiesis is ineffective, and patients have various degrees of anemia, leukopenia, and thrombocytopenia. Several in vitro culture studies using unsorted bone marrow mononuclear cells from patients with MDS found that erythroid progenitors such as erythroid burst-forming units (BFU-Es) and erythroid colony-forming units (CFU-Es) did not expand correctly in response to erythropoietin (Epo) alone or to a mixture of Epo, stem cell factor (SCF), and interleukin-3 (IL-3).1-3 In most patients with MDS, BFU-Es also failed to emerge from sorted CD34+CD36−cells.4 Proliferation of CD34+ and CD34+CD38− progenitors in serum-free medium was impaired, despite optimal concentrations of SCF, flt-3 ligand, thrombopoietin, IL-3, granulocyte colony-stimulating factor, granulocyte-macrophage colony-stimulating factor (GM-CSF), and Epo.5,6 Progenitors can give rise to blast cell colonies but cannot differentiate along the erythroid lineage, and there is a growth defect at the stage of early progenitor with long-term culture initiating cell activity.7-9 Ineffective erythropoiesis has been correlated with an increase in intramedullary apoptosis of differentiated cells and, to lesser extent, immature CD34+cells.10-12
Several in vitro cell-culture systems have been developed for analysis of normal erythropoiesis. Cultures with Epo-containing cytokine mixtures generate mature populations of erythroid cells.13Although many essentially pure erythroid cells can be obtained, cell proliferation and terminal differentiation are not separated. Negative selection by depletion of nonerythroid cells or positive selection of erythroid cells by cell sorting can also provide cell populations enriched in erythroid progenitors.14-17 However, recovery of highly purified erythroid progenitors is low. Erythroid progenitors derived from cord blood or peripheral blood CD34+ cells were grown efficiently by using an initial amplification of CD34+ cells in serum-free medium containing IL-3, IL-6, and SCF and subsequent culture of the purified CD36+ cells in the same medium plus Epo.18 However, this technique is not suitable for producing MDS erythroid progenitors because few CD34+ cells can be collected from bone marrow of patients with MDS.
To avoid the need for a selection step after CD34+ cell isolation, we therefore used a liquid-culture medium based on that employed to expand avian erythroid progenitors. This procedure is also an effective way to amplify human erythroid progenitors from cord blood or peripheral blood CD34+ cells selectively and obtain their terminal differentiation.19 In this study, CD34+ progenitors purified from the bone marrow of 20 patients with MDS were grown for 10 days in a proliferation medium and then placed in a differentiation medium for an additional 8 days. MDS erythroid progenitors were amplified selectively and then differentiated into enucleate erythrocytes. We found that there was a significant increase in apoptosis during differentiation that was linked to increased expression of Fas and Fas ligand (FasL).
Materials and methods
Materials
The reagents used for culture were detoxified bovine serum albumin (BSA; StemCell Technologies, Vancouver, BC, Canada), sodium heparin (Novo Nordisk Pharma, Mainz, Germany), phosphate-buffered saline (PBS; GibcoBRL, Life Technologies, Paisley, Scotland), Ficoll-Hypaque gradient (Eurobio, Les Ulis, France), MIDI–magnetically activated cell-sorter (MACS) immunoaffinity columns (Miltenyi Biotech, Bergish Badgach, Germany), Dulbecco modified Eagle medium (DMEM), Iscoves modified Dulbecco medium (IMDM; GibcoBRL, Life Technologies), methylcellulose (StemCell Technologies), fetal-calf serum (FCS; Dutscher Laboratories, Brumath, France), sodium bicarbonate, β-mercaptoethanol, iron-saturated transferrin, glutamine, streptomycin, and penicillin (all from Sigma-Aldrich, St Louis, MO). Anti-CD95 antibody (CH11) was provided by Immunotech (Becton Dickinson, Palo Alto, CA). Fas-Fc chimeric protein was purchased from Alexis Biochemicals (Laufelfingen, Switzerland).
The cytokines and hormones were recombinant human (rHu) Epo, SCF (a gift from Amgen, Thousand Oaks, CA), rHu insulinlike growth factor (IGF) 1, dexamethasone, β-estradiol, interferon (IFN) γ, tumor necrosis factor (TNF) α (Sigma-Aldrich), and insulin (Bayer, Leverkunsen, Germany). Antibodies to Akt (sc-8312), ERK 1/2 (sc-154), Bcl-2 (sc-509), Bcl-XL/S (sc-634), Bad (sc-6542), Bax (sc-493), and Bim (sc-8265) were purchased from Santa Cruz Biotechnology (Santa Cruz, CA). Antibodies to phospho-ERK 1/2 (V1141) were obtained from Promega Life Science (Madison, WI), antibodies to serine 473 phospho-Akt (9271S) from New England Biolabs (Beverly, MA), and antibodies to forkhead (FKHRL1; 06-951) and threonine 32 phospho-FKHRL1 (06-952) from Upstate Biotechnologies (Lake Placid, NY). Antibody to FasL (F37720) was supplied by Transduction Laboratories (Lexington, KY).
Cells and culture
Bone marrow samples were collected from 20 patients with MDS (6 with refractory anemia [RA], 7 with RA with ringed sideroblasts [RARS], and 7 with RA with excess of blasts [RAEB] with < 10% blasts) and from 7 healthy donors (Table1). Use of these samples was authorized by the Hospital Ethics Committee, Cochin Port Royal Saint Vincent de Paul Hospital). We obtained informed consent from all marrow donors. Bone marrow was obtained by sternal aspiration, collected into dry bottles containing sodium heparin, and diluted in PBS containing 0.8% BSA. Mononuclear cells were isolated on a Ficoll-Hypaque gradient and washed twice. CD34+ progenitors were separated on MIDI-MACS immunoaffinity columns according to the manufacturer's instructions. On flow cytometry, the purity of the CD34+ cells was always greater than 85%. The CD34+ cells (5 × 10⁵/mL) were placed in DMEM containing 12% FCS, 1% BSA, 15% distilled water, 1.9 mM sodium bicarbonate, 10−4 mol/L β-mercaptoethanol, 300 μg/mL iron-saturated transferrin, and 100 IU/mL streptomycin and penicillin and were incubated at 37°C in a 5% carbon dioxide atmosphere for 10 days. The culture medium also contained 0.5 IU/mL rHu Epo, 50 ng/mL SCF, 40 ng/mL rHu IGF-1, 10−6 mol/L dexamethasone, and 10−6mol/L β-estradiol to promote cell proliferation. The resulting cells were placed in medium containing 1 IU/mL rHu Epo and 1 IU/mL insulin for an additional 8 days to induce erythroid differentiation. Cell cultures were diluted to a concentration of 5 × 10⁵cells/mL every 1 or 2 days by adding the appropriate medium.
Colony-formation assay
Cells were removed from the liquid cultures on day 7, and the clonogenic erythroid and granulomacrophagic progenitors were quantified. Cells were plated on 35-mm plastic culture dishes in duplicate in 1 mL semisolid culture medium (0.8% methylcellulose, 10% FCS, 0.8% BSA, 1.7 mM glutamine, 10−4 mol/L β-mercaptoethanol, and cytokines [StemCell Biotechnologies]) for 10 days. BFU-Es and granulocyte-macrophage colony-forming units (CFU-GMs) were counted under an inverted microscope.
Cytologic and cytogenetic analysis
Samples of cultured cells were removed every 3 days, cytocentrifuged (5 minutes at 500 rpm) on glass slides, and stained with May-Grünwald-Giemsa or Perls stains. Cytologic analysis and quantification of ringed sideroblasts (RS) were done by using a light microscope with a × 100 objective. Cytogenetic abnormalities were detected by using cytospin preparations for fluorescent in situ hybridization (FISH) on interphase nuclei.20 Briefly, cells were fixed in methanol-acetone (50:50 vol/vol) for 20 minutes at −20°C, and nucleic acids were denatured by heating at 92°C for 3 minutes. Samples were incubated with specific probes. Hybridized cells were revealed by staining with avidin– fluorescein isothiocyanate–conjugated (FITC) or antidigoxigenin antibody–rhodamine. DNA was stained with 4′,6-diamino-2-phenylindole before analysis under a fluorescence microscope.
Immunophenotyping
Samples (5 × 10⁴ cells) were removed every 3 days for analysis of surface antigens by flow cytometry. Cells were incubated with FITC or phycoerythrin-conjugated antibodies for 20 minutes at 4°C, washed, suspended in PBS, and analyzed in an EPICS-XL device (Coultronics Beckman Coulter, Miami, FL). Antibodies to CD3, CD14, CD19, CD33, CD34 (HPCA-2 clone), CD36, CD71, and glycophorin A (GPA; Becton Dickinson) were used for immunophenotyping. Nonimmune matched antibodies were used as controls.
Cell stimulation
Cells (10 × 106 cells/mL) were harvested and removed from serum and cytokines by placing them in IMDM containing 0.8% BSA and 200 μg/mL iron-saturated transferrin for 4 hours at 37°C. They were then stimulated with 10 IU/mL rHu Epo for 10 minutes at 37°C before biochemical analyses.
Electrophoretic mobility shift assay
For analysis of STAT5, nuclear extracts (4 μL) corresponding to 2.5 × 10⁵ unstimulated cells or Epo-stimulated cells and 1 μL γ-phosphorus 32, adenosine triphosphate–labeled synthetic oligonucleotide derived from β-casein gene promoter were incubated for 30 minutes on ice in 15 μL buffer of 100 mM sodium chloride (NaCl), 10 mM potassium chloride, 10 mM magnesium chloride, 0.2 mM EDTA, 20 mM HEPES (pH 7.8), 4 mM dithiothreitol, 8% Ficoll, 5% glycerol, 8 mM spermidine, 200 μg/mL BSA, and 100 μg/mL poly(dI-dC) competitor. The oligonucleotide-protein complex was analyzed by electrophoresis on 5% polyacrylamide gels in a Tris borate–EDTA 0.25 × buffer.
Western blotting
Unstimulated or Epo-stimulated cells (106) were solubilized for 5 minutes at 100°C in Laemmli buffer (65 mM Tris [pH 6.8], 20% glycerol, 5% β-mercaptoethanol, 0.01% bromophenol blue, and 2% sodium dodecyl sulfate [SDS]). Proteins were separated by SDS–polyacrylamide gel electrophoresis and transferred to a nitrocellulose membrane (Schleicher & Schuell, Brumath, France). Membranes were incubated in 10 mM Tris (pH 7.4), 150 mM NaCl, 0.1% Tween 20, and 5% low-fat milk for 2 hours to saturate nonspecific sites and then in specific antibody for 2 hours at room temperature. The membranes were then washed and incubated with secondary antibody for 1 hour at room temperature. Proteins were revealed with a chemoluminescent kit according to the manufacturer's instructions (Amersham Pharmacia Biotech, Little Chalfont, United Kingdom).
Analysis of apoptosis
Cell apoptosis was quantified by double staining with annexin V (Boehringer Mannhein, Mannhein, Germany) and propidium iodide (PI; Sigma-Aldrich). Briefly, cells were incubated for 20 minutes at room temperature in 50 mM HEPES (pH 7.4) and 150 mM NaCl containing 2 mM calcium chloride with a mixture of annexin V–FITC (1 μg/mL) and PI (2.5 μg/mL). The reaction was stopped by adding 2 mL HEPES buffer, and the cells analyzed by flow cytometry. In some experiments, CH11 (500 ng/mL) or irrelevant IgM antibodies were added to the culture medium containing 1 IU/mL Epo and incubation was allowed to proceed for 20 hours. Alternatively, Fas-Fc (10 μg/mL) in the same medium was added and this was followed by incubation for 48 hours.
Fas gene expression
Spontaneous Fas gene expression and Fas gene expression induced by TNF-α (10 ng/mL) or IFN-γ (1000 IU/mL) was assessed by fluorescence-activated cell-sorter scanning using FITC-coupled anti-CD95 antibody (Becton Dickinson). Results are expressed as the ratio of fluorescence intensities of cells incubated with specific and irrelevant antibodies.
Statistical analysis
Values are expressed as means ± SD. Continuous variables were compared by using the Student t test.
Results
In vitro proliferation and differentiation of MDS erythroid progenitors
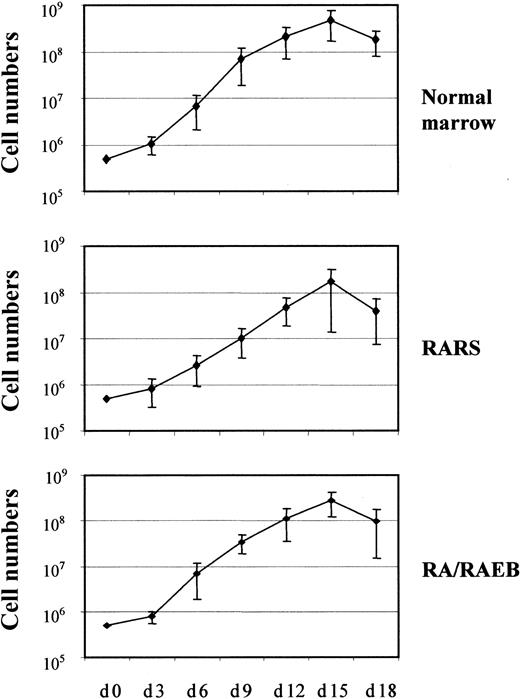
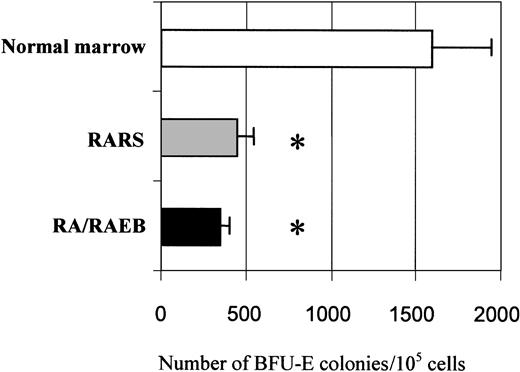
The proliferation and differentiation into the erythroid lineage of MDS-derived CD34+ bone marrow progenitors (7 samples from patients with RARS and 13 from patients with RA or RAEB with < 10% blasts) and CD34+ marrow progenitors from healthy donors (7 samples) were compared. The number of cells was increased 103-fold after 15 days in culture, and the mean increments in normal, RARS, and RA/RAEB cells were similar (Figure1). Cells multiplied during the initial 10-day proliferation step and continued to divide at the beginning of the differentiation step, but cell division had stopped by day 15. The enrichment in erythroid progenitors was assessed by quantifying BFU-Es and CFU-GMs on day 7. The ratio of BFU-Es to CFU-GMs was 100:1 in all cases, confirming the preferential amplification of the erythroid lineage. There were significantly fewer BFU-Es in RARS samples (450 ± 50) and RA/RAEB (350 ± 50) samples than in normal samples (1600 ± 350; P < .05; Figure2). One of the RA/RAEB samples did not show differentiation because of early abortion on day 6, and one showed differentiation into both myeloid and erythroid lineages (RA sample 2).
In vitro proliferation of erythroid progenitors isolated from CD34+ cells.
CD34+ cells from 7 healthy donors and from patients with RARS (n = 7) or RA/RAEB (n = 13) were cultured for 10 days in proliferation medium and then switched to differentiation medium. Cells were counted every 3 days. Results are expressed as cumulative cell numbers (means ± SD).
Quantification of BFU-E in semisolid clonogenic assay.
Cells (5 × 10⁴/mL) from marrow of patients with RA/RAEB (n = 3) or RARS (n = 3) and from healthy donors (n = 3) on day 7 of liquid culture were incubated in methylcellulose medium with Epo, SCF, IL-3, IL-6, and GM-CSF. BFU-E–derived colonies were counted after 10 days. Results are means ± SD of BFU-E colonies for 105 cells seeded. The asterisk indicatesP < .05.
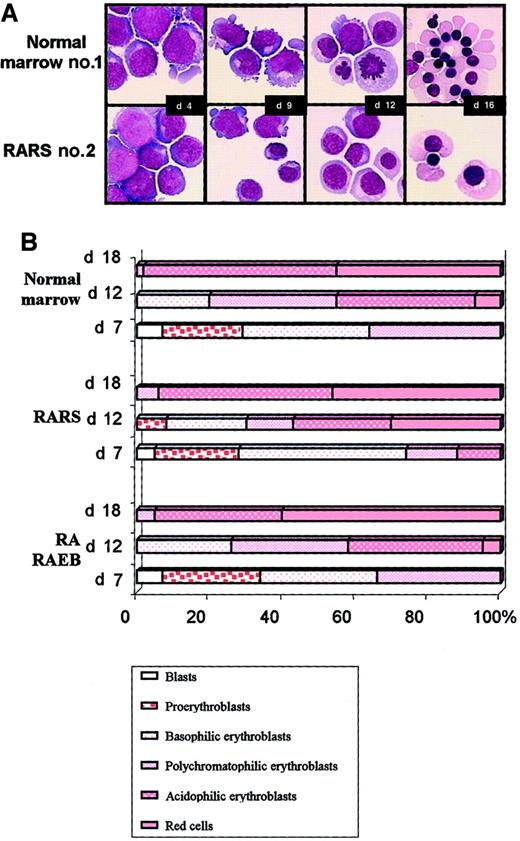
Three samples of normal marrow, 3 of RARS marrow, and 5 of RA/RAEB marrow were examined cytologically every 3 days during the liquid culture. Morphologic aspects of cultured cells from normal sample 1 and RARS sample 2 are illustrated in Figure3A. Both blast cells and cells differentiating into erythroid cells were present on day 4. The kinetic features of erythroid differentiation in RA/RAEB and normal cultures were similar. Equal amounts of proerythroblasts, basophilic, and polychromatophilic erythroblasts were observed in normal and RA/RAEB cultures on day 7 (Figure 3B). Cells matured when they were placed in the differentiation medium, with a prevalence of polychromatophilic (31%) and acidophilic erythroblasts (42%) on day 12. Enucleate erythrocytes accounted for up to 8% of cells on day 12 and for more than 50% of cells on day 18 in both RA/RAEB and control samples. However, erythroid progenitors in RARS samples seemed to differentiate more rapidly than those in RA/RAEB or normal samples, with 24% enucleate erythrocytes on day 12, although the difference was not significant. Cultures contained less than 10% nonerythroid cells, mainly macrophages (except in RA sample 2, in which both erythroid and granulocytic differentiations were observed).
Morphologic analysis.
Cytospin samples were prepared every 3 days and stained with May-Grünwald-Giemsa stain. (A) Cultured cells from normal bone marrow sample 1 and from RARS sample 2. Original magnification, × 100. (B) Erythroid subpopulations after various times in culture. Results are representative of the sequential analysis of cytospin samples prepared from 3 normal, 3 RARS, and 5 RA/RAEB samples.
The CD34+ marker had disappeared from both MDS cultures and normal cultures by day 7, whereas the immature erythroid markers CD71+ and CD36+ were found on 91% ± 3% and 87% ± 3.3% of cells, respectively. Mature erythroid GPA-positive (GPA+) cells accounted for less than 20% of the population at the end of the proliferation step, but their number increased dramatically when the cells were placed in differentiation medium. More than 80% of cells were GPA+ on day 15, when there were fewer than 10% CD33+ and CD14+ cells throughout the culture. B-cell and T-cell subpopulations represented 1% to 3% of total cells in both MDS and normal samples (data not shown). Therefore, MDS-derived CD34+ progenitors proliferated, entered the erythroid lineage, and terminally differentiated under our culture conditions.
Amplification of pathological clones
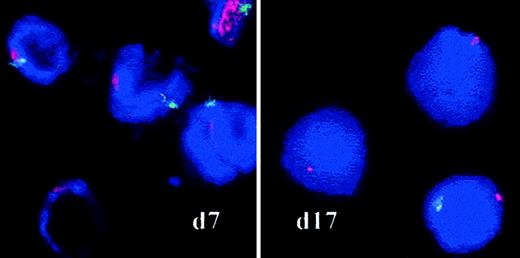
RS were counted between days 8 and 14 in samples from 3 cases of RARS by iron staining using the Perls method to determine whether the proliferating cells belonged to the abnormal clone. RS did accumulate in one case (RARS sample 1) and accounted for 70% of the basophilic and polychromatophilic erythroblasts on day 12, but the proportion of RS varied from 1% to 25% in the 2 other RARS samples. No RS were found in RA/RAEB or normal cultures. We also used FISH analysis of interphase nuclei to detect the abnormal karyotypes identified at diagnosis in patients with MDS (Table 1). Loss or partial deletion of chromosomes was investigated in cytospin samples prepared on days 7 and 17 (Table 2). Twenty percent of the cells in RAEB sample 1 had no Y chromosome on day 7, and 74% had none on day 17 (Figure 4). In RARS sample 2, more than 80% of cells had lost their Y chromosome by days 7 and 17; and in RARS sample 5, 80% of cells had lost the long arm of chromosome 4 after 17 days in culture. Thus, the abnormal clone proliferated during the culture of MDS erythroid progenitors.
FISH on interphase nuclei.
Chromosomes X and Y (RAEB sample 1) were analyzed by FISH with red (X) and green (Y) centromere-specific probes on culture days 7 and 17. Spots were counted on a minimum of 500 cells by 2 independent investigators. Original magnification, × 100.
FISH on interphase nuclei.
Chromosomes X and Y (RAEB sample 1) were analyzed by FISH with red (X) and green (Y) centromere-specific probes on culture days 7 and 17. Spots were counted on a minimum of 500 cells by 2 independent investigators. Original magnification, × 100.
Epo signaling in MDS erythroid progenitors
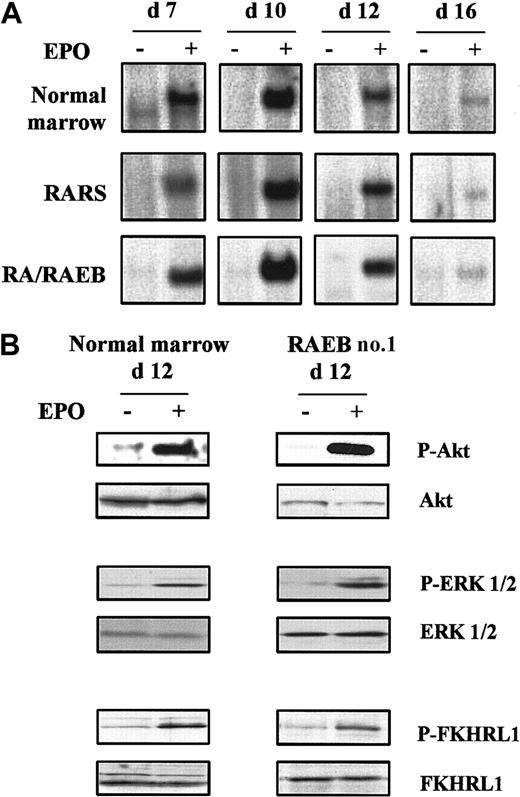
Cultured cells were incubated at 37°C in medium without serum or cytokines for 4 hours, and their ability to activate STAT5, Ras–mitogen-activated protein kinase (MAPK), and phosphatidylinositol 3-kinase (PI3K)–Akt pathways in response to a 10-minute stimulation at 37°C with 10 IU/mL rHu Epo was tested. We analyzed 5 MDS samples, including cells from RARS sample 2, in which 80% of the cells had lost their Y chromosome, and 3 normal controls. The kinetics of Epo-induced STAT5 DNA binding activity was assessed from day 7 to day 16. STAT5 was activated in response to Epo on day 7, reached maximal levels on day 10, and decreased thereafter to become barely detectable on day 16, when most of the cells were terminally differentiated. Epo-induced STAT5 binding activity was also maximal in normal cells during proliferation up to day 10 and decreased during differentiation (Figure5A).
Epo signaling in MDS and normal erythroid progenitors.
Cells were removed from serum and cytokines for 4 hours at 37°C and then stimulated for 10 minutes with 10 IU/mL Epo at 37°C. (A) Kinetics of Epo-induced STAT5 activation analyzed by electrophoretic mobility shift assay. (B) Western blot analysis of phospho-Akt, phospho-ERK 1/2, and phospho-FKHRL1 on day 12. Western blot results with Akt, ERK 1/2, and FKHRL1 were used as controls for protein loading. Data are representative results from 3 normal and 5 MDS samples.
Activation of PI3K-Akt and Ras-MAPK pathways by Epo was evaluated under the same cell-stimulation conditions by Western blotting using antibodies to the phosphorylated forms of Akt, forkhead (FKHRL1), and ERK 1/2. Akt, FKHRL1, and ERK 1/2 in 5 MDS and 3 normal samples were phosphorylated in response to rHu Epo on day 12 (Figure 5B). Thus, the Epo receptor and its downstream signaling pathways were functional in MDS-derived erythroid progenitors.
Increased apoptosis in differentiated MDS erythroid cells
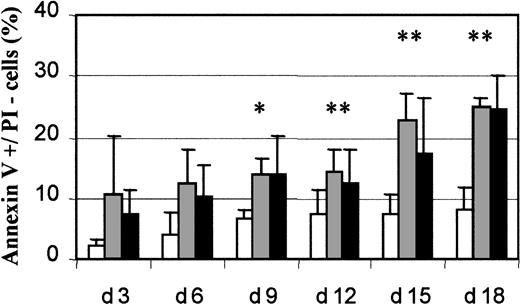
Because several studies reported increased apoptosis in MDS mononuclear cells, we measured apoptosis in 18 MDS samples (6 RARS and 12 RA/RAEB) and 7 normal samples. Cultures of RARS samples contained 12.4% ± 5.4% apoptotic cells (annexin V–positive and PI-negative) cells on day 6 and 22.7% ± 4.3% on day 15, whereas RA/RAEB cultures contained 10.2% ± 5.1% apoptotic cells on day 6 and 17.2% ± 9.2% on day 15 (Figure 6). Cultures of normal marrow had 4.1% ± 3.6% apoptotic cells on day 6 and 7.2% ± 3.5% on day 15. The percentage of apoptotic cells was significantly higher in RARS and RA/RAEB samples than in normal control samples (P < .05) from day 12. The percentage of apoptotic cells in culture was similar in RARS and RA/RAEB samples at all times. We therefore conclude that MDS-derived differentiated erythroid cells have an increased rate of apoptosis compared with normal cells.
Flow cytometry analysis of apoptosis.
Cultured cells were labeled every 3 days with a mixture of annexin V and PI and analyzed by flow cytometry. Apoptotic (annexin V+/PI−) cells from 7 normal (■), 6 RARS (░), and 12 RA/RAEB (▪) cultures were quantified and results expressed as mean percentages ± SD. The asterisk indicates P < .05.
Bcl-2–family antiapoptotic and proapoptotic proteins
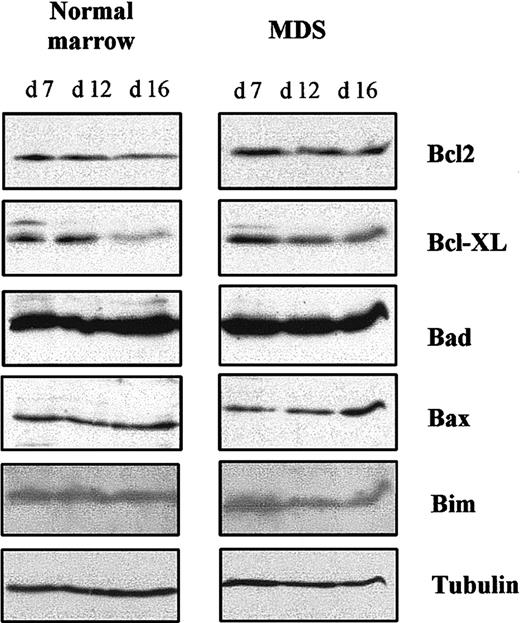
The increased apoptosis we observed could have been due to a lack of antiapoptotic protein, an excess of proapoptotic protein, or both. Therefore, we analyzed expression of antiapoptotic proteins Bcl-2 and Bcl-XL and proapoptotic proteins Bad, Bax, and Bim in 5 MDS samples and 3 normal samples at different times in culture by using Western blotting. Amounts of these proteins in MDS and normal erythroid progenitors were similar on day 7. Expression of Bcl-XLdecreased when normal cells entered terminal erythroid differentiation (day 16) and began to decrease slightly at the beginning of erythroid differentiation in MDS cells (day 12). Bcl-2 remained unchanged throughout the cultures of both MDS and normal cells. Expression of Bad, Bim, and Bax in normal cells remained constant between days 7 and 16, but the concentration of Bax in MDS cells was increased on day 16 (Figure 7). These results show that increased apoptosis in MDS cells at terminal erythroid differentiation (day 16) is correlated with an increase in proapoptotic Bax.
Bcl-2–family antiapoptotic and proapoptotic proteins.
Total cell lysates were prepared at the indicated times and analyzed by Western blotting. Antitubulin antibody was used to control protein loading. Results are representative of analyses of samples from 6 patients with MDS and 3 healthy donors.
Bcl-2–family antiapoptotic and proapoptotic proteins.
Total cell lysates were prepared at the indicated times and analyzed by Western blotting. Antitubulin antibody was used to control protein loading. Results are representative of analyses of samples from 6 patients with MDS and 3 healthy donors.
Fas and FasL
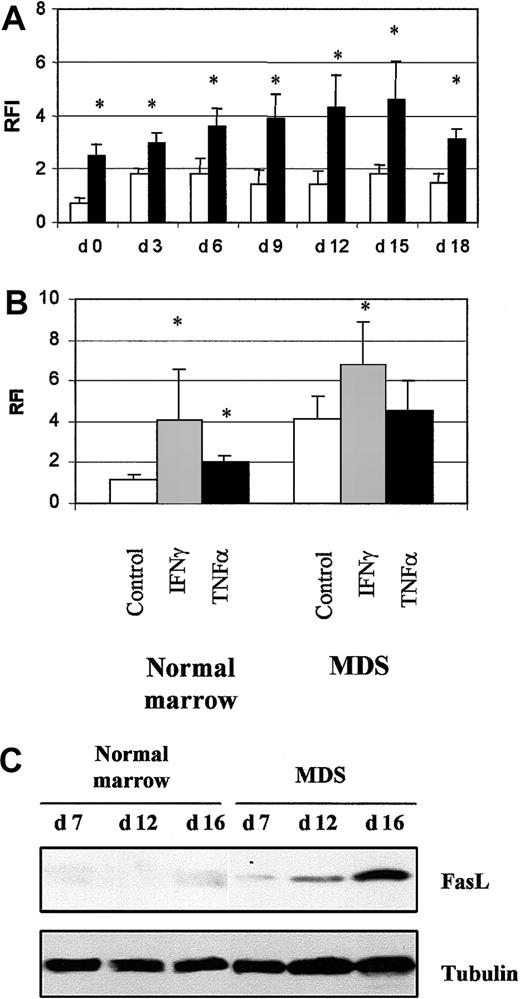
We investigated the role of the death-domain receptor Fas and its ligand in apoptosis in MDS erythroid cells. Fas was detected by flow cytometry on MDS (8 samples) and normal (4 samples) cultured cells. Fas levels were significantly elevated in freshly isolated MDS CD34+ cells (P < .05) and increased during differentiation up to day 15 (Figure 8A). Expression of Fas in cells incubated with INF-γ for 16 hours increased from 1.2 ± 0.1 to 4.0 ± 2.5 (P < .05) in normal samples and from 4.3 ± 1.2 to 6.2 ± 2.0 (P < .05) in MDS samples. In contrast, TNF-α (10 ng/mL) significantly increased the amount of Fas in normal cells but not MDS cells (Figure 8B).
Fas and Fas ligand expression.
(A) Fas expression in 4 normal cultures (■) and 8 MDS (▪) cultures analyzed by flow cytometry. (B) Modulation of Fas expression by incubation with 1000 IU/mL IFN-γ or 10 ng/mL TNF-α for 16 hours in 4 normal and 8 MDS samples. Results are the ratios of fluorescence intensities (RFI) for specific and irrelevant isotype-matched antibody. The asterisk indicates P < .05. (C) Fas ligand analyzed by Western blotting. Antitubulin antibody was used to check protein loading. Results are representative of analyses of 3 normal and 5 MDS samples.
FasL was detected by Western blotting; it appeared in MDS cultures on day 7 and increased dramatically during differentiation (day 16). It was faintly detected in normal cultures only on day 16 (Figure 8C). Although Fas was overproduced throughout the MDS cultures, the percentage of apoptotic cells was significantly elevated from day 12. Thus, the significant increase in apoptosis coincided with increased FasL production.
Fas-related apoptosis
We incubated cells from 6 MDS and 3 normal cultures with 500 ng/mL anti-Fas activating antibody (CH11 clone) for 20 hours to assess the functionality of Fas. We found that the percentage of apoptotic cells in MDS cultures increased from 11.5% ± 2.7% to 24.7% ± 8.1% on day 13 (Table 3). We blocked the interaction between Fas and FasL by incubating MDS erythroid cells (6 samples) containing FasL on day 13 in culture with 10 μg/mL Fas-Fc. Spontaneous apoptosis was reduced by 50%, suggesting that Fas and FasL play a major role in apoptosis in MDS cells.
Discussion
We here characterized the Epo-dependent progenitors derived from MDS CD34+ cells. These cells proliferated efficiently from bone marrow samples from adults with MDS and from healthy adults when cultured in medium plus serum, Epo, SCF, IGF-1, and steroid hormones, resulting in a 103-fold increase in cell numbers in 15 to 18 days. The progenitor cells obtained were fully competent to differentiate terminally into enucleate erythrocytes in response to differentiation factors, Epo, and insulin.
The in vitro amplification of erythroid cells was due to synergy between cytokines. The presence of Epo throughout the culture ensured growth and differentiation of committed progenitors. Omitting Epo from the initial liquid culture led to rapid and massive apoptosis, suggesting that Epo is required for erythroid cell survival and proliferation (data not shown). SCF cooperates with Epo to stimulate accumulation of normal erythroid progenitors and delay erythroid differentiation.15 Because SCF partly rescues BFU-E growth and, to a lesser extent, CFU-E growth in MDS,21,22 it must be indispensable to growth of MDS erythroid progenitors in liquid culture. We also used the cooperative effect of IGF-1 on erythroid cell maturation stimulated by Epo.23 The IGF-1 receptor is not detectable on normal CD34+ cells bearing c-Kit and Epo receptors, but it is detectable on more differentiated cells; thus, erythroid progenitors responding to IGF-1 may be more mature than those responding to SCF.24 Therefore, a combination of Epo, SCF, and IGF-1 may stimulate CD34+ cells and late-stage primitive erythroid progenitors to proliferate. FISH analysis confirmed that abnormal clones were amplified, with high percentages of cytogenetically abnormal cells at the end of the culture. The abnormal clones in MDS marrow samples grew better in liquid culture, although normal hematopoiesis persisted, as was suggested in previous studies.9
Cells in myelodysplastic bone marrow have an increased tendency to undergo apoptosis.10,11 Studies have distinguished between the ability of immature progenitors to proliferate and the propensity of mature cells to undergo apoptosis.12,25 We found that apoptosis was not significantly increased in early erythroid cells; thus, we could not exclude the protective effect of Epo, SCF, and IGF-1 during the proliferation step. In contrast, apoptosis rates were clearly above normal throughout differentiation in both RARS and RA/RAEB samples, despite the presence of Epo and insulin. Thus, the apoptosis of differentiated MDS erythroid cells during culture mimics the apoptosis of erythroid mature cells in MDS bone marrow biopsy specimens and smears assessed by deoxynucleotidyl transferase–mediated deoxyuridine triphosphate nick-end labelling.10 11
We postulated that the increased apoptosis was due to defective cytokine signaling. However, Epo-induced STAT5 DNA binding activity between days 7 to 16 was the same in MDS and normal erythroid cells. This result confirms our previous finding that STAT5 is activated mostly after Epo stimulation in early MDS mononuclear cells.26 Epo-induced phosphorylation of Akt was normal, and we found that FKHRL1 was phosphorylated in response to Epo in both normal and MDS erythroid progenitors, as was shown previously for UT-7 human cells.27 Finally, MAPK and ERK1/2 were also phosphorylated in response to Epo, suggesting that the Ras-MAPK pathway was functional. We conclude that the main intracellular signaling pathways activated by Epo are also activated in cultured MDS erythroid progenitors.
We also investigated the possibility that apoptosis was due to a disequilibrium between proapoptotic Bax, Bad, and Bim and antiapoptotic Bcl-2 and Bcl-XL proteins. In agreement with previous reports showing increased expression of Bcl-2 associated with disease progression,28,29 we never found overexpression of Bcl-2 in early MDS. We did find that the amounts of Bcl-2–family proteins and the percentages of apoptotic cells in undifferentiated erythroid progenitors were similar in normal and MDS cells. In contrast, Parker et al29 reported that the ratio of Bax/Bad to Bcl-2/Bcl-XL was higher in freshly isolated MDS CD34+ cells than in normal cells. Because the synthesis of Bcl-2–family proteins is controlled by cytokines in hematopoietic cell lines,30-33 our results suggest that cytokines also modulate the synthesis of these proteins in cultured erythroid progenitors. We found that Bcl-XL decreased earlier during erythroid differentiation in MDS cultures than in normal cultures. Bax increased at the end of MDS differentiation, whereas Bax and Bad usually decrease when normal cells enter terminal erythroid differentiation.34 It was previously reported that Bcl-2 and Bcl-XL prevent the proapoptotic effect of Bax by binding to Bax as heterodimers.35 Disturbing the stoichiometric ratios between Bcl-XL and Bax could allow formation of Bax and Bax homodimers that induce apoptosis. Thus, increased Bax production could be involved in the apoptotic process during terminal erythroid differentiation in MDS cells.
We previously showed that Fas/CD95 is overexpressed on MDS CD34+, CD33+, and GPA+cells.11 The amount of Fas on MDS GPA+ cells is also inversely correlated with growth of BFU-Es and CFU-Es.26 We here confirmed that Fas is overexpressed on MDS CD34+ cells and during erythroid cell maturation and that Fas is functional. A previous study showed that the amount of FasL in bone marrow mononuclear cells of patients with MDS is increased in direct correlation with requirements for red cell transfusions and is predictive of survival. Furthermore, cells with FasL inhibit in vitro growth of normal clonogenic hematopoietic progenitors.36We also observed that FasL production in MDS cells was increased from the beginning of erythroid differentiation. Apoptosis was increased significantly at the time FasL became detectable, suggesting that FasL expression is a limiting factor for apoptosis in MDS cells. The Fas agonist antibody CH11 increased apoptosis in MDS progenitors, whereas the chimeric Fas-Fc protein inhibited apoptosis, again indicating that Fas and FasL play a major role in apoptosis of differentiated cells in MDS.
The negative regulation of normal erythropoiesis involves Fas and the TNF-related apoptosis-inducing ligand (TRAIL) receptor. FasL or TRAIL on mature erythrocytes is thought to activate Fas or TRAIL receptors on immature erythroid progenitors and induce apoptosis of these cells.37 38 Fas and FasL overproduction in MDS could account for the inhibition of BFU-E growth in semisolid medium because of direct contacts between immature Fas-expressing cells and mature FasL-bearing cells that may lead to apoptosis. This may contribute to abnormal amplification of the physiologic control of erythropoiesis. However, the immature progenitors that did not coexist with mature cells during the first step of liquid culture are protected from apoptosis. In contrast, FasL-bearing cells could activate the Fas abnormally expressed on differentiated cells by means of a paracrine or an autocrine mechanism during differentiation. Regardless of the mechanism, our results strongly support a role for Fas and FasL in the apoptotic process in MDS. Whether Fas and FasL overexpression is an autonomous defect of MDS erythroid cells is not known.
We thank Dr M. Brandt and Dr H. Schurig, Roche Diagnostics GmbH, for donating the recombinant human Epo and Amgen Laboratories for support.
Supported by grants from the Comité de Paris de La Ligue Nationale contre le Cancer (Associate Laboratory 8) and a fellowship from the Association pour la Recherche contre le Cancer (Y.-E.C.).
The publication costs of this article were defrayed in part by page charge payment. Therefore, and solely to indicate this fact, this article is hereby marked “advertisement” in accordance with 18 U.S.C. section 1734.
References
Author notes
Michaëla Fontenay-Roupie, INSERM U363, Institut Cochin de Génétique Moléculaire, Hôpital Cochin, 27, Rue du Faubourg Saint-Jacques, F75679 Paris Cedex 14, France; e-mail: fontenay@cochin.inserm.fr.

