Abstract
Macrophage inflammatory protein-1α (MIP-1α) is produced in high concentration by multiple myeloma (MM) cells in about 70% of patients, and MIP-1α levels correlate with their disease activity. Patients who have high levels of MIP-1α have a poor prognosis. Furthermore, blocking MIP-1α expression in an in vivo model of human MM profoundly decreases both tumor burden and bone destruction, suggesting that MIP-1α is an important mediator of MM bone disease. Therefore, to analyze the regulation of MIP-1α production in MM, we cloned the human MIP-1α promoter and characterized the transcription factor (TF) motifs that control MIP-1α expression in MM cells. The proximal region of MIP-1α promoter was composed of 2 sets of identical transcription regulatory regions consisting of GATA-2+ AML-1+ C/EBPα motifs. Since 2 alternatively spliced variants of the acute myeloid leukemia-1 (AML-1) class of TFs can bind the AML-1 region, AML-1A and AML-1B, the relationship between the expression levels of AML-1A or AML-1B in MM cells and their capacity to express MIP-1α was examined. AML-1A mRNA was relatively overexpressed compared with AML-1B in MM cell lines that produced high levels of MIP-1α (> 1 ng/mL per 106 cells per 72 hours), but AML-1A was not increased in MM cell lines that expressed less than 200 pg/mL MIP-1α. More importantly, the ratio of AML-1A to AML-1B mRNA levels was also increased in 3 of 3 highly purified myeloma cells from patients with MM who expressed increased amounts of MIP-1α. The ratio of AML-1A to AML-1B mRNA in patients with MM was 8-fold higher than in healthy controls. Transduction of AML-1B into the MM-derived MM.1S and ARH-77 cells totally blocked MIP-1α production, while AML-1A did not further increase the already high levels of MIP-1α produced by these cells. Taken together, these data demonstrate that in patients with MM who produce increased concentrations of MIP-1α, the relative level of AML-1B is significantly decreased compared with healthy controls. The data suggest that strategies that enhance AML-1B expression or decrease AML-1A in MM cells may be beneficial therapeutically.
Introduction
Multiple myeloma (MM) is an incurable plasma cell neoplasm that accounts for 13% of all hematologic malignancies.1,2 Bone destruction is a common manifestation of the disease and is a major source of morbidity for the patients. Bone destruction results from highly localized osteoclastic bone resorption that is induced by an osteoclastic stimulatory factor(s) secreted by MM cells and/or marrow stromal cells adjacent to the myeloma cells.3 In vitro studies have implicated several cytokines as potential factors responsible for the bone destruction in MM, including interleukin 1 beta (IL-1β), IL-6, and lymphotoxin. However, none of these cytokines has been found to be consistently elevated in peripheral blood or bone marrow plasma of patients with MM.4,5 Receptor activator of nuclear factor–kappa B ligand (RANKL), a recently described osteoclastogenic factor, has been shown to be up-regulated in bone marrow samples from patients with MM. In addition, blocking RANKL activity with osteoprotegerin or a soluble form of the RANK receptor (RANK-Fc) decreased the bone destruction in an in vivo model of myeloma.6-8 These data demonstrated an important role for RANKL in the bone destruction in myeloma.
We have used an expression cloning approach with a human MM patient–derived cDNA expression library to screen for osteoclast-inducing factors produced by MM cells, and identified macrophage inflammatory protein-1α (MIP-1α) as an osteoclastogenic factor produced by MM cells from patients with the disease. MIP-1α levels in bone marrow plasma from patients with MM correlated with their disease activity.9 Furthermore, we found that MIP-1α in addition to being a potent osteoclastogenic factor, also enhanced the effects of RANKL on human osteoclast (OCL) formation.10 Studies with an in vivo model of MM, in which severe combined immunodeficiency (SCID) mice received transplants of the human MM-derived ARH-77 cells,11demonstrated that when SCID mice received transplants of ARH-77 cells stably transfected with an antisense construct to MIP-1α (AS-ARH), the AS-ARH mice lived longer than control mice and had no radiologically identifiable lytic lesions. Histomorphometric analysis demonstrated that the number of OCLs and the percent of tumor cells per bone area for mice that underwent transplantation with AS-ARH cells were significantly less than control mice that underwent transplantation with ARH-77 cells transfected with the empty vector. Blocking MIP-1α activity inhibited both MM cells homing to the marrow as well as tumor growth. Taken together, these data demonstrated that blocking MIP-1α activity has profound effects on the tumor burden and bone destruction in this in vivo model of MM, and suggest that blocking MIP-1α expression and activity in patients with MM could have a significant therapeutic benefit. Therefore, to identify the factors controlling MIP-1α expression, we have used promoter analysis to characterize the transcription factors (TFs) that regulate the MIP-1α expression in MM cells. We report that the AML-1 class of TFs, AML-1A and AML-1B, regulate MIP-1α expression, and that abnormal expression of these TFs in MM cell lines and bone marrow cells from patients with MM correlates with increased MIP-1α expression.
Patients, materials, and methods
Cell culture and bone marrow samples from patients with multiple myeloma
Human ARH-77, THP-1, HL-60, Reh, and U937 cells were purchased from American Type Culture Collection (ATCC, Rockville, MD). KAS6/1 and MCQ/2 MM cell lines were obtained from Dr D. F. Jelinek (Mayo Clinic, Rochester, MN), and the MM.1S12 MM cell line was kindly provided by Dr S. T. Rosen (Northwestern University, Chicago, IL). These cells were cultured in RPMI 1640 medium supplemented with 10% fetal bovine serum. Bone marrow aspirates were collected into heparinized syringes from patients with MM (Durie-Salmon, stages I-III), and healthy controls. All patients gave informed consent prior to obtaining these samples. These studies were approved by the institutional review board of the University of Pittsburgh.
The bone marrow was pelleted by centrifugation at 1000g at 4°C immediately after collection, and the bone marrow plasma was collected and stored at −80°C for subsequent studies. The cells were resuspended in α–minimal essential media (αMEM)/5% fetal calf serum (FCS), and the mononuclear cell fraction was separated by gradient centrifugation.
Isolation of primary myeloma cells from patients with multiple myeloma
Patient bone marrow–derived myeloma cells were purified by CD138 (syndecan-1) microbeads using a Miltenyi magnetic cell sorting system (Miltenyi Biotec, Auburn, CA) as described by Draube et al.13 Briefly, bone marrow mononuclear cells (108) were incubated with CD138 microbeads for 15 minutes and loaded onto a positive selection column placed in the magnetic field. The column was washed with 1 mL buffer (phosphate-buffered saline [PBS] containing 0.5% bovine serum albumin [BSA] and 2 mM EDTA [ethylenediaminetetraacetic acid]) 3 times. After removing the column from the magnetic field, CD138+ cells were eluted with 1 mL buffer using a plunger and washed with PBS 2 times. The purity of the myeloma cells exceeded 98% as assessed by CD138/CD45 staining and morphology.
Cloning of the human MIP-1α promoter
The human MIP-1α cDNA (1.1 kb)14 was used as a probe for bio-informatics screening of the The National Center for Biotechnology Information (NCBI) human genomic database for the MIP-1α promoter. A 2-kb MIP-1α promoter sequence was identified in a MIP-1α–containing bacterial artificial chromosome (BAC) clone. The BAC clone (accession number AC003976) containing the MIP-1α promoter was then subjected to further analysis. Amplified genomic DNA (130 kb to 170 kb insert) in the BAC clone was digested with restriction enzymes EcoRI, SstI, andXbaI and analyzed by 0.6% agarose gel electrophoresis. The gel was stained with ethidium bromide, transferred to a nitrocellulose membrane, and Southern blot analysis was performed using a32P-labeled MIP-1α cDNA probe (5′, 380 bp). A 4.2-kb genomic DNA fragment that was digested with EcoRI was hybridized with the MIP-1α cDNA probe. The 4.2-kbEcoRI band was transferred into the pBS KSII (Stratagene, La Jolla, CA) vector for further analysis.
Generation of human MIP-1α promoter luciferase reporter constructs and their truncated forms
The 4.2-kb MIP-1α promoter genomic DNA was subjected to DNA sequence analysis to confirm its identity. The 2-kb genomic DNA fragment was digested with SstI and XhoI and subcloned into the luciferase reporter vector, pGL2Enh (Promega, Madison, WI) (pGL2E-MIP). Truncated forms of the MIP-1α promoter reporter construct were generated with the Erase-A-Base system (Promega). Briefly, the full-length construct was digested first withKpnI, resulting in a fragment that could not be degraded by Exonuclease III, and then was digested by MscI, which resulted in a fragment that could be easily degraded by Exonuclease III. The reaction time of the Exonuclease III digestion was adjusted to generate the different truncated forms of the MIP-1α promoter insert. After blunt end generation, self-ligation was performed and the ligation product was transformed into E coli–competent cells. Clones of different insert sizes for the MIP-1α promoter were isolated, and the exact promoter location was confirmed by DNA sequence analysis using a GL1 primer.
Transfection of MIP-1α promoter luciferase reporter constructs and assay for promoter activity
Full-length and truncated MIP-1α promoter constructs were transfected into MM.1S cells, ARH-77 cells, human monocytic cells (HL-60, U937, THP-1), normal human B cells (Reh), or 293 cells using a Lipofectamine Plus kit (Invitrogen, Carlsbad, CA) with minor modification. Briefly, MM.1S, ARH-77, U937, Reh, THP-1, and HL-60 cells (106/well) were cultured in 6-well plates with serum and antibiotic-free RPMI 1640 media. After 3 hours, MIP-1α promoter construct DNAs (1 μg) and Renilla luciferase DNA (1 μg) were diluted with 100 μg serum and antibiotic-free Dulbecco modified Eagle medium (DMEM), and then 6 μg PLUS reagent was added. pTK Renilla luciferase was cotransfected as an internal control as described.15 After 15 minutes of incubation, lipofectamine (4 μg) diluted with 100 μg serum and antibiotic-free DMEM (Invitrogen) was added and the reaction was incubated for another 15 minutes. Transfection reagents were added to cells in 6-well plates with serum and antibiotic-free RPMI 1640 media (Invitrogen). After 6 hours, complete media that contained serum and antibiotics were added, and after 72 hours of incubation in 5% CO2 at 37°C, the luciferase activity was assayed with a luminometer. At the end of the culture period, cells were harvested, washed with PBS, and suspended in passive lysis buffer (Promega). Clear cell lysates were harvested by microcentrifugation, and Firefly and Renilla luciferase activity were measured using a dual luciferase assay system (Promega). The relative activity (ratio between Firefly and Renilla luciferase activity) was calculated, and ratios that were at least 5-fold higher than baseline were considered significant. In selected experiments, AML-1A and AML-1B cDNAs were inserted into the mammalian expression vector pcDNA3 and cotransfected into ARH-77 and MM.1S cells, to test the modulatory effects of these TFs on MIP-1α promoter activity.
Identification of the putative transcription factors that may regulate MIP-1α expression and cloning of the AML-1A and 1B cDNAs
The DNA sequence of the MIP-1α promoter (−671 bp to +45 bp) was analyzed for putative transcriptional regulatory factors using a transcription factor search program, TFSITE (http://www.cbrc.jp/research/db/tfisearch.html). To determine the transcriptional modulatory effects of the AML-1 class of TFs on the MIP-1α expression, we identified expressed sequence tag (EST) clones (accession numbers AI911291 and AL559418) that contain full-length AML-1A and AML-1B cDNA and obtained these EST clones from IMAGE Consortium (National Institutes of Health, Bethesda, MD). They were subcloned into the mammalian expression vector (pcDNA3) and subjected to sequence analysis.
RT-PCR analysis of AML-1A and AML-1B mRNA expression in MM cells and patients with MM
To determine mRNA expression levels of MIP-1α, AML-1A, and AML-1B in MM cells and bone marrow cells from patients with MM compared with healthy controls, we performed reverse transcriptase–polymerase chain reaction (RT-PCR) analysis using AML-1A, AML-1B, MIP-1α, and glyceraldehyde phosphate dehydrogenase (GAPDH) specific primer sets. Total RNA from bone marrow cells from patients and healthy donors were isolated with Trizol reagent (Invitrogen). RNA was precipitated with isopropanol, and the pellets were washed with 70% ethanol, briefly air dried, dissolved in diethylpyrocarbonate-treated water, and stored at −80°C. The primer sequences for the RT-PCR analysis were 5′-CTG GTC ACT GTG ATG GCT GG-3′ (AML-1A sense strand [SS]), 5′-CTG CCT TAA CAT CTC CAG GG-3′ (AML-1A antisense strand [AS]), 5′-CAC CGA CAG CCC CAA CTT CC-3′ (AML-1B SS), 5′-AGG TGG CGA CTT GCG GTG GG-3′ (AML-1B AS), 5′-ACA TTC CGT CAC CTG CTC AG-3′ (MIP-1α SS), 5′-CGG TTG TCA CCA GAC GCG G-3′ (MIP-1α AS), 5′-ACC ACA GTC CAT GCC ATC AC-3′ (GAPDH SS), and 5′-TCC ACC ACC CTG TTG CTG TA-3′ (GAPDH AS). The PCR conditions typically were 94°C for 30 seconds, 60°C for 30 seconds, 72°C for 1 minute, and 21 to 32 cycles for each target. The PCR product was subjected to agarose gel analysis, and the bands were scanned and quantified by densitometer.
Statistical analysis
Results were compared by a 2-way analysis for repeated measures and were considered significant if P < .05.
Results
Cloning of the human MIP-1α promoter and generation of deletion constructs
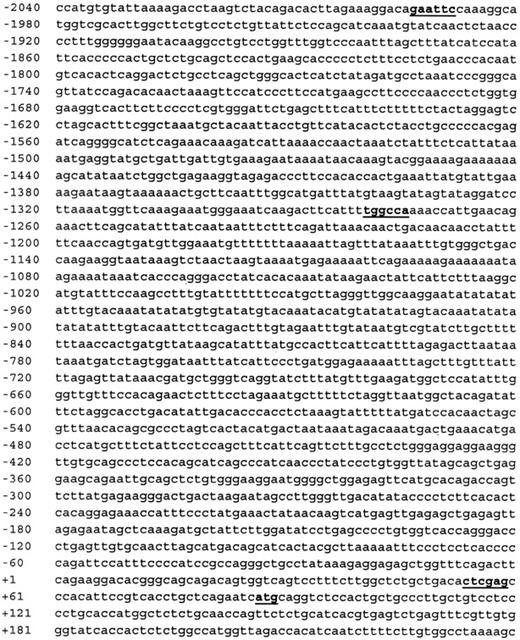
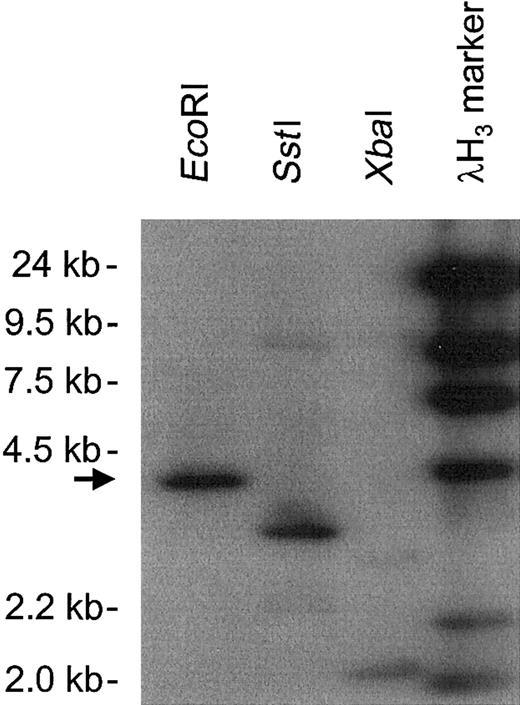
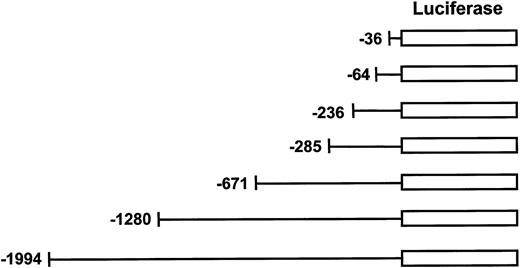
The DNA sequence of the human MIP-1α promoter was identified in the NCBI human genome project database and is shown in Figure1. A BLAST search using the MIP-1α promoter sequence was used to identify a BAC clone that contained the MIP-1α promoter. A 4.2-kb genomic DNA fragment was identified by hybridization with a MIP-1α cDNA probe (Figure2) and truncated forms of the MIP-1α promoter generated as described in “Patients, materials, and methods” are shown in Figure 3.
Genomic sequence of the hMIP-1α promoter.
The DNA sequence of a 2-kb hMIP-1α promoter was determined using the NCBI database. EcoRI (−1995: gaattc) andXhoI (+54: ctcgag) sites (in bold) were used for subcloning into luciferase reporter constructs. Transcriptional starting site (+1) and translational starting Met site (+98:atg) were determined by Nakao et al,14and the MscI site (−1275: tggcca) was used for Erase-A-Base studies.
Southern blot analysis of BAC clone AC003976, which contained the hMIP-1α promoter.
The genomic insert DNA digested with EcoRI, SstI, and XbaI was hybridized with an hMIP-1α cDNA probe. A 4.2-kb EcoRI band was selected (arrow) and subjected to further analysis.
Southern blot analysis of BAC clone AC003976, which contained the hMIP-1α promoter.
The genomic insert DNA digested with EcoRI, SstI, and XbaI was hybridized with an hMIP-1α cDNA probe. A 4.2-kb EcoRI band was selected (arrow) and subjected to further analysis.
Generation of human MIP-1α reporter constructs.
Truncated forms of hMIP-1α promoter were generated from the 2-kb pGL2E-MIP construct by the Erase-A-Base system and followed by sequence analysis to confirm the 5′ end of the hMIP-1α promoter. These luciferase reporter constructs were transfected into the various cell lines to assess MIP-1α promoter activity.
MIP-1α promoter activity is enhanced in MM-derived ARH-77 cells, but not in other hematopoietic cell types
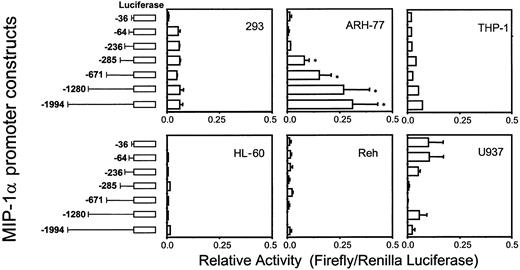
To test the various MIP-1α promoter deletion constructs for their relative activity, full-length (2 kb) or truncated forms of MIP-1α promoter luciferase reporter constructs were transfected into various cell types including MM-derived ARH-77 cells. As shown in Figure 4, the full-length MIP-1α promoter construct dramatically enhanced basal luciferase activity more than 50-fold in ARH-77 cells compared with the 64-bp basal promoter. Furthermore, the truncated MIP-1α promoter construct that contained 671 bp of the MIP-1α promoter increased luciferase activity to similar levels as the full-length promoter construct. In contrast, luciferase activity was not significantly enhanced when the full-length MIP-1α promoter construct was transfected into nonmyeloma cells such as HL-60, U937, THP-1, Reh, and 293 cells. These data suggest that ARH-77 cells express a specific transcription activator(s) that up-regulates MIP-1α expression, and that the proximal region (671 bp) of the MIP-1α promoter may be critical for enhanced MIP-1α expression in ARH-77 cells.
Luciferase activities of the hMIP-1α promoter constructs.
The hMIP-1α promoter luciferase reporter constructs were cotransfected with the pTK Renilla luciferase construct into the various cell lines and relative activities (Firefly/Renilla luciferase activity) were determined. The promoter construct containing −671 bp of the MIP-1α promoter significantly enhanced luciferase activity in ARH-77 MM cells, but not in nonmyeloma HL-60, U937, THP-1, Reh, and 293 cells. Similar results were seen in 2 independent experiments (*P < .05). Error bars indicate SE.
Cotransfection of AML-1A, but not AML-1B, enhances MIP-1α promoter activity
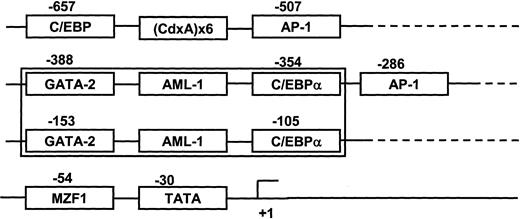
The DNA sequence of the MIP-1α promoter (−671 bp to +45 bp) was analyzed for putative transcriptional regulatory regions. The proximal domain was composed of 2 sets of distinct transcription regulatory regions (GATA-2+ AML-1+ C/EBPα) between −388 bp to −354 bp and −153 bp to −105 bp (Figure5). Since the AML-1 class of TFs are known as hematopoietic and bone-specific TFs, we determined the modulatory effects of these TFs on MIP-1α promoter activity. Two major forms of the AML-1 transcription factors that bind this region, AML-1A and AML-1B, result from alternative splicing of the AML-1 gene.16 17 Using an EST clone database search, we identified and cloned AML-1A and AML-1B cDNAs that contained the open reading frame into the mammalian expression vector pcDNA3.
Schematic diagram of transcription factor (TF) response elements that may regulate MIP-1α expression.
The proximal domain of the hMIP-1α promoter was composed of 2 sets of distinct transcription regulatory regions, GATA-2 plus AML-1 plus C/EBPα including one TATA box and 2 AP-1 sites.
Schematic diagram of transcription factor (TF) response elements that may regulate MIP-1α expression.
The proximal domain of the hMIP-1α promoter was composed of 2 sets of distinct transcription regulatory regions, GATA-2 plus AML-1 plus C/EBPα including one TATA box and 2 AP-1 sites.
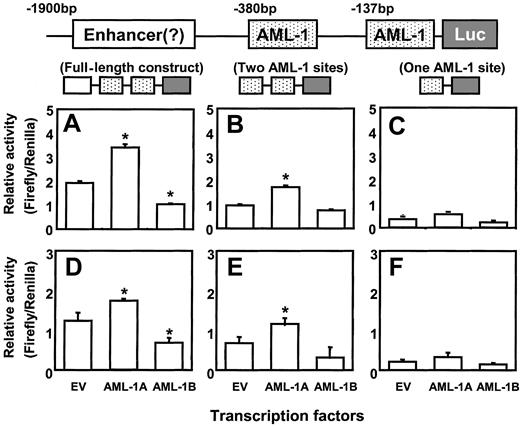
We then cotransfected the AML-1A and AML-1B cDNAs with either full-length or truncated forms of the hMIP-1α promoter luciferase construct into ARH-77 and MM.1S cells. As shown in Figure6C,F the reporter construct that contained only one AML-1 binding element did not display increased promoter activity in ARH-77 and MM.1S cells, regardless if the cells were cotransfected with AML-1A or AML-1B. In contrast, cotransfection of the reporter construct that contained 2 AML-1 binding elements with the AML-1A construct into ARH-77 and MM.1S cells significantly increased MIP-1α promoter activity compared with the reporter construct that contains one AML-1 binding site or to control cells cotransfected with empty vector (EV) (Figure 6B,E). Furthermore, cotransfection of the full-length luciferase reporter construct with AML-1A further increased MIP-1α promoter activity (Figure 6A,D). In contrast, AML-1B significantly decreased MIP-1α promoter activity about 50% in ARH-77 and MM.1S cells compared with the controls cotransfected with EV, when AML-1B was cotransfected with the full-length MIP-1α luciferase construct (Figure 6A,D). AML-1B did not significantly affect the luciferase activity of the proximal MIP-1α promoter construct that contained 671 bp (Figure 6B,E).
AML-1A, but not AML-1B, increases hMIP-1α promoter activity.
The MIP-1α promoter constructs were cotransfected with AML-1A and AML-1B cDNAs in pcDNA3 into ARH-77 (A-C) and MM.1S (D-F) cells, to test the modulating effects of the AML-1 class of TFs on MIP-1α promoter activity. Cotransfection of AML-1A or AML-1B with the luciferase reporter construct (Luc) containing one AML-1 binding motif did not significantly enhance promoter activity. In contrast, cotransfection of the reporter construct that contained 2 AML-1 binding elements with the AML-1A construct into ARH-77 and MM.1S cells significantly increased MIP-1α promoter activity compared with the empty vector (EV) control (Figure 6B,E). Furthermore, cotransfection of the full-length luciferase reporter construct with AML-1A further increased MIP-1α promoter activity (Figure 6A,D). AML-1B significantly decreased full-length MIP-1α promoter activity about 50% in ARH-77 and MM.1S cells compared with the EV control. Similar results were seen in 3 independent experiments (*P < .05).
AML-1B but not AML-1A is down-regulated in MM.1S, ARH-77, and MCQ-2 MM cells and in highly purified myeloma cells from patients who have enhanced MIP-1α expression
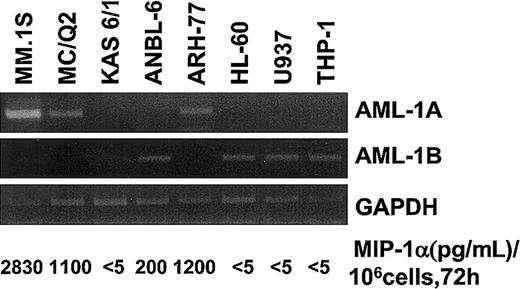
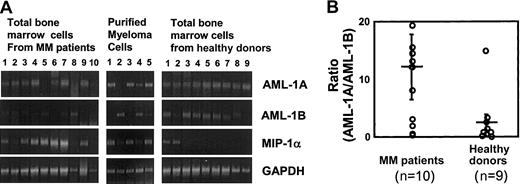
To study the relationship between the expression levels of AML-1A or AML-1B and MIP-1α expression in MM cell lines and patients with MM compared with healthy controls, the mRNA expression levels for MIP-1α AML-1A, and AML-1B were determined by RT-PCR. As shown in Figure 7, mRNA expression levels of AML-1B were decreased in MM cells that released more than 1 ng/mL MIP-1α into their 72-hour conditioned media (106 cells) (MM.1S, ARH-77, and MCQ-2), but not in KAS 6/1 and ANBL-6 MM cells, which released less than 200 pg/mL MIP-1α. Nonmyeloma cells such as HL-60, U937, and THP-1 did not express MIP-1α or AML-1A mRNA, but expressed easily detectable amounts of AML-1B mRNA. Similarly, MIP-1α mRNA expression levels were increased 2- to 5-fold in 7 of 10 samples of bone marrow mononuclear cells from patients with MM and in 3 of 5 samples of CD138+ myeloma cells purified from these patients. Interestingly, mRNA expression levels of AML-1B were decreased in 5 of 7 samples of bone marrow mononuclear cells from patients with MM (patients 3, 4, 6, 7, and 9) and 3 of 3 CD138+ myeloma cells from these patients (patients 1 and 3) who expressed increased levels of MIP-1α mRNA, while AML-1B mRNA was easily detectable in 7 of 9 bone marrow samples from healthy donors. In contrast, AML-1A mRNA expression was detected in 8 of 10 bone marrow samples from patients with MM, 4 of 5 CD138+myeloma cells from patients with MM, and 9 of 9 bone marrow samples from healthy controls (Figure8A). Calculation of the mRNA expression ratios for AML-1A to AML-1B in these subjects showed that the average ratio of mRNA expression of AML-1A to AML-1B was 8-fold higher in patients with MM than in healthy controls (Figure 8B), and in patients with increased MIP-1α expression (patients 1, 3, 4, 5, 6, 7, and 9), the AML-1A/AML-1B ratio was increased more than 10-fold (P = .022).
Expression levels of AML-1A and AML-1B mRNA in various cells.
mRNA expression levels of AML-1A, AML-1B, and MIP-1α were determined in various cell lines including MM-derived cell types by RT-PCR analysis. Expression levels of AML-1A mRNA were up-regulated in the MIP-1α, producing MM cells (MM.1S, ARH-77, and MC/Q2). Relative expression levels of AML-1B mRNA were up-regulated in the MM cells expressing low levels of MIP-1α and non-MM hematopoietic cells.
mRNA expression levels of AML-1A and AML-1B in patients with MM versus healthy controls.
mRNA expression levels of MIP-1α, AML-1A, and AML-1B were examined by RT-PCR analysis in total bone marrow cells and purified CD138+ myeloma cells from patients with MM, compared with samples from healthy donors. mRNA expression levels of MIP-1α were increased in 7 of 10 total bone marrow cells and 3 of 5 CD138+ myeloma cells from patients with MM. mRNA expression levels of AML-1B were decreased in 5 of 7 total bone marrow cells and 2 of 3 myeloma cells from patients with MM who showed increased MIP-1α expression. AML-1A mRNA expression was detected in 8 of 10 and 4 of 5 myeloma cells from patients with MM, and 9 of 9 normal samples (A). The ratio of mRNA expression of AML-1A to AML-1B was 8-fold higher in patients with MM than in healthy controls and was increased more than 10-fold in patients with increased MIP-1α expression, such as in patients 1, 3, 4, 5, 6, 7, and 9 (P = .022) (B). Horizontal bars indicate the average; vertical bars, SE.
Transduction of AML-1B into ARH-77 or MM.1S MM cells totally blocks MIP-1α expression
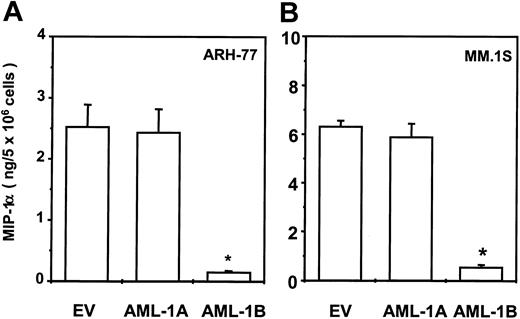
To test the effects of AML-1A and AML-1B on MIP-1α expression in MM cells, the AML-1A, AML-1B cDNA, or the empty pcDNA3 vector was stably transfected into the ARH-77 and MM.1S cells as described previously.9 After G418 selection, MIP-1α protein levels were measured using an enzyme-linked immunosorbent assay (ELISA) kit. As shown in Figure 9, transduction of AML-1B cDNA markedly inhibited MIP-1α protein production in ARH-77 (Figure 9A) and MM.1S (Figure 9B) cells (< 200 pg/mL). In contrast, transduction of the AML-1A cDNA did not further increase the already high levels of MIP-1α in ARH-77 and MM.1S cells compared with cells stably transfected with EV (ARH-77, 2 to 3 ng/5 × 106; MM.1S, 6 to 7 ng/5 × 106 cells, cultured for 48 hours).
Transduction of AML-1B cDNA into ARH-77 and MM.1S cells totally blocked MIP-1α expression.
AML-1A, AML-1B cDNA, or pcDNA3 vector were stably transfected into the ARH-77 (A) and MM.1S (B) cells and expression levels of MIP-1α were measured using an ELISA kit. Transduction of AML-1B cDNA markedly decreased MIP-1α production in ARH-77 and MM.1S cells (< 200 pg/mL) and transduction of AML-1A cDNA did not significantly alter MIP-1α expression. Similar results were seen in 2 independent experiments (*P < .05).
Discussion
In the present study, we found that human MIP-1α promoter activity is up-regulated in the MM-derived ARH-77 cell line but not in other hematopoietic cell types such as THP-1, HL-60, Reh, and U937. These data suggest that specific regulatory factor(s) that enhance MIP-1α promoter activity were present in ARH-77 cells. We further demonstrated that the 671-bp proximal region of hMIP-1α promoter was responsible for the increased MIP-1α promoter activity. The proximal region of MIP-1α promoter is composed of 2 sets of distinct transcription regulatory domains (GATA-2+AML-1+ C/EBPα). Since the AML-1 class of TFs are hematopoietic and bone specific, and is expressed in hematopoietic cells at high levels,18-20 we determined the roles of these TFs on MIP-1α promoter activity and MIP-1α production in MM-derived ARH-77 cells.
The AML-1 class of TFs occurs in 2 major forms (AML-1A and AML-1B) that can bind AML-1 response motifs.17 AML-1A is a truncated form of AML-1B and lacks a portion of the C-terminal nuclear matrix targeting domain.21,22 Normally, AML-1B modestly up-regulates mRNA transcription of hematopoietic genes such as granulocyte colony-stimulating factor (G-CSF), macrophage colony-stimulating factor (M-CSF), and IL-3,23 and markedly activates transcription of these genes to higher levels in collaboration with other tissue-specific regulators such as AP-1, C/EBP, ets-1, PU-1, and c-Myb.24,25 In contrast, AML-1A competitively binds AML-1 response motifs and inhibits AML-1B–dependent transcriptional activation.26 However, we found that AML-1A increased MIP-1α promoter activity, whereas AML-1B inhibited up-regulation of the MIP-1α promoter by AML-1A. Interestingly, the MM-derived ANBL-6 cell that expressed less than 200 pg/mL MIP-1α and other hematopoietic cell types such as HL-60, U937, and THP-1 expressed only the AML-1B transcript but not the AML-1A transcript. MM cell lines that produced high levels of MIP-1α (>1 ng/mL) predominantly expressed the AML-1A transcript, rather than AML-1B. These data demonstrate that AML-1A enhances MIP-1α promoter activity while AML-1B inhibits the transcriptional activation of the MIP-1α gene, and suggest that the transcriptional activities of the AML-1 class of TFs significantly differ depending on the cell type and tissue examined. These differences may contribute to the tissue-specific functions of the AML-1 class of TFs.27 28Consistent with these observations is our finding that the ratios of AML-1A to AML-1B mRNA expression levels were dramatically increased more than 10-fold in bone marrow samples from patients with MM who expressed MIP-1α. Furthermore, transduction of the MM-derived MM.1S and ARH-77 cell lines with AML-1B markedly decreased MIP-1α production. Surprisingly, transduction of MM.1S and ARH-77 cells with AML-1A did not further increase MIP-1α production, even though it increased MIP-1α promoter activity in these cells. These data suggest that MIP-1α production by MM.1S and ARH-77 cells is already maximal, and that transduction and overexpression of AML-1A does not further enhance MIP-1α production. AML-1B appears to act as a competitive inhibitor of transcriptional up-regulation of MIP-1α promoter activity by AML-1A and as a negative regulator of MIP-1α production.
Other TFs in addition to the AML-1 class of TFs may be involved in the transcriptional regulation of the MIP-1α promoter and cooperatively up-regulate MIP-1α promoter activity. Supporting this hypothesis is our finding that the 2-kb MIP-1α promoter construct demonstrated enhanced promoter activity compared with that of the 671-bp proximal MIP-1α promoter construct. These data suggest that enhancer element(s) are present in the upstream 1.4-kb region of the 671-bp proximal promoter. Furthermore, cotransfection of AML-1A with core binding factor beta (CBFβ), an activation subunit of the AML-1 class of TFs,29 30 further enhanced MIP-1α promoter activity. In contrast, cotransfection of AML-1B with CBFβ did not alter the MIP-1α promoter activity (S.J.C., unpublished data, August 2002).
Patients with increased levels of MIP-1α have a poor prognosis. However, it is unclear if this is simply due to the elevated expression levels of MIP-1α or results from the other genes that are also up-regulated in MM cells producing MIP-1α. Abnormal expression of the AML-1 class of TFs, which results in enhanced MIP-1α production, also may increase the expression of other genes that affect MM cell growth, MM cell adhesion to stromal cells, or their sensitivity to chemotherapy.31-33
We detected both AML-1A and AML-1B mRNA transcripts by RT-PCR and found that the mRNA expression pattern of AML-1A and AML-1B was abnormal in bone marrow samples and highly purified MM cells from patients with MM who express high levels of MIP-1α compared with healthy controls. Presently, it is not clear why AML-1B is not expressed in bone marrow cells from patients with MM, how it decreases MIP-1α production, or which other genes may be affected by the abnormal expression pattern of the AML-1 class of TFs in MM. Further studies to address these questions should provide valuable insights into the control of MM cell activity and novel approaches to blocking MIP-1α expression.
Prepublished online as Blood First Edition Paper, January 30, 2003; DOI 10.1182/ blood-2002-08-2641.
Supported by the Multiple Myeloma Research Foundation (grant title: Role of MIP-1α in Myeloma Bone Disease) and funds from the Veterans Administration (VA Merit Review Award).
The publication costs of this article were defrayed in part by page charge payment. Therefore, and solely to indicate this fact, this article is hereby marked “advertisement” in accordance with 18 U.S.C. section 1734.
References
Author notes
G. David Roodman, Suite 601, Kaufmann Medical Bldg, 3471 Fifth Ave, Pittsburgh, PA 15213; e-mail:roodmangd@msx.upmc.edu.

This feature is available to Subscribers Only
Sign In or Create an Account Close Modal