Abstract
Our objective was to estimate the in vivo rates of thrombin and fibrin generation to better understand how coagulation is regulated. Studied were 9 males undergoing cardiopulmonary bypass (CPB). The rates of thrombin, total fibrin, and soluble fibrin generation in vivo were based on measured levels of prothrombin activation peptide F1.2, thrombin-antithrombin complex, fibrinopeptide A, and soluble fibrin, combined with a computer model of the patient's vascular system that accounted for marker clearance, hemodilution, blood loss, and transfusion. Prior to surgery, the average thrombin generation rate was 0.24 ± 0.11 pmol/s. Each thrombin molecule in turn generated about 100 fibrin molecules, of which 1% was soluble fibrin. The thrombin generation rate did not change after sternotomy or administration of heparin, then rapidly increased 20-fold to 5.60 ± 6.65 pmol/s after 5 minutes of CPB (P = .000 05). Early in CPB each new thrombin generated only 4 fibrin molecules, of which 35% was soluble fibrin. The thrombin generation rate was 2.14 ± 1.88 pmol/s during the remainder of CPB, increasing again to 5.47 ± 4.08 pmol/s after reperfusion of the ischemic heart (P = .000 08). After heparin neutralization with protamine, thrombin generation remained high (5.34 ± 4.01 pmol/s, P = .0002) and total fibrin generation increased, while soluble fibrin generation decreased. By 2 hours after surgery, thrombin and fibrin generation rates were returning to baseline levels. We conclude that cardiopulmonary bypass and reperfusion of the ischemic heart results in bursts of nonhemostatic thrombin generation and dysregulated fibrin formation, not just a steady increase in thrombin generation as suggested by previous studies.
Introduction
When the coagulation system is activated it produces a series of markers that can be measured in vitro and in vivo. These include prothrombin activation fragment F1.2, a measure of the amount of thrombin generated1 ; thrombin-antithrombin (TAT) complex, a measure of the amount of thrombin inhibited2 ; fibrinopeptide A (FPA), a measure of the total amount of fibrinogen converted to fibrin3 ; and soluble fibrin, a measure of circulating nonhemostatic fibrin.4 Activation marker levels measured during coagulation activation in vitro, in purified or plasma systems, have been used to evaluate the effect of coagulation factor levels on thrombin generation and function.5, 6, 7 Changes in marker levels during in vitro studies are due to changes in the rate of coagulation activation or inhibition only. In vivo the situation is more complex: these activation markers are being formed and cleared simultaneously. Bauer et al1 and Nossel et al3 used the concentrations and half-lives of F1.2 (t1/2, ∼ 90 minutes) and FPA (t1/2, ∼ 4 minutes) to estimate the rates of thrombin and fibrin generation in vivo under steady-state conditions when the rate of formation was not changing. The purpose of this study was to use activation marker levels to determine the in vivo rates of thrombin and fibrin generation when the rates of coagulation activation and marker levels are varying. In this study, we developed a method for directly estimating the rates of thrombin and fibrin generation occurring in vivo using measured levels of activation markers like F1.2, TAT, FPA, and soluble fibrin combined with a computer model of the individual patient's vascular system that continuously accounts for marker clearance, hemodilution, blood loss, and transfusion in each patient. The vascular model used in this study is a modification of previous models that were used to assess changes in fibrinolytic marker levels and to evaluate the effect massive blood loss has on fibrinolysis during liver transplantation.8, 9, 10, 11 As a clinical problem we chose to study coagulation during cardiopulmonary bypass (CPB) for several reasons: (1) CPB results in a reproducible stimulation of coagulation that can be used to study the regulation of this system,12 (2) CPB is an important clinical tool used in the treatment of heart disease that still has significant risk and side effects associated with it, and (3) many new drugs (such as aprotinin) and technologies (such as heparin-coated bypass circuits) are being developed and used to reduce hemostatic activation and side effects, even though their precise mechanism of action is still debated.13 The long range goal is to use this method of analysis to better understand the regulation of the hemostatic system and to hopefully suggest which new therapies are likely to be the most effective in preventing, suppressing, or eliminating hemostatic disorders.
Patients, materials, and methods
Human subjects
Studies on human subjects were carried out according to the principles of the Declaration of Helsinki. Informed consent was obtained from all participants and the study was approved by the University of Washington Human Subjects Review Committee. A total of 9 men were studied ranging in age from 50 to 74 years (mean, 59 ± 7 years). All subjects underwent coronary artery bypass graft surgery utilizing standard CPB (no aprotinin or other antifibrinolytics, standard CPB circuits without heparin or other coatings). All patients received routine anesthetic and surgical care. Porcine heparin was administered as a loading dose of 250 IU/kg, and supplemented as needed to maintain a kaolin-activated clotting time of longer than 450 seconds during bypass. CPB utilized a membrane oxygenator, arterial filter, and centripetal pump head. Heparinization was reversed with protamine sulfate following completion of CPB. Cardiac output was measured using thermodilution techniques.
Blood sampling
Blood was collected from an arterial line at 10 time points: (1) after induction of anesthesia, (2) after sternotomy, (3) after heparin administration, (4) after 5 minutes of CPB, (5) after 15 minutes of CPB, (6) after 30 minutes of CPB, (7) 5 minutes prior to reperfusion of the heart, (8) 5 minutes after reperfusion, (9) 5 minutes after protamine administration, and (10) 2 hours after surgery. At each time point, 4.5 mL arterial blood was added to 0.5 mL of 0.105 M citrate for assays of factor II activity, factor X activity, antithrombin activity, heparin activity, and fibrinogen, while 5 mL arterial blood was anticoagulated with 11 mM citrate and 25 μM PPACK (D-Phe-Pro-Arg-chloromethylketone) for assays of F1.2, TAT, FPA, and soluble fibrin. All samples were immediately centrifuged at 1800g for 30 minutes at 4°C, aliquoted, and frozen at –80°C until analyzed.
Assay methods
F1.2 (Dade-Behring, Marburg, Germany), TAT complex (Dade-Behring), and soluble fibrin (Organon Teknika, Durham, NC) were measured using enzyme immunoassay kits.2,14,15 The soluble fibrin assay utilizes monoclonal antibodies specific for a neoepitope on the gamma-chain that is specific for fibrin and a second antibody that recognizes only fibrins with intact C-terminal alpha-chains that have not been degraded by plasmin. The assay is highly specific for intact unpolymerized soluble fibrin.16 Antithrombin activity and anti-Xa heparin activity were measured using chromogenic methods (Diagnostica Stago, Parsippany, NJ).17,18 Heparin activity measurements were converted into moles of active heparin based on a specific molar activity of unfractionated porcine heparin of 3.65 × 10⁹ IU/mol.18 Fibrinogen was measured using a kinetic clottable method (Diagnostica Stago).19 Factor II and Factor X activity were measured using prothrombin time-based one-stage clotting assays. FPA was measured using a competitive enzyme immunoassay.20
Statistical evaluation
Comparisons within a group used repeated measures analysis of variance (ANOVA) and the least significant difference (LSD) multiple comparisons test. Statistica-/Mac software (Stat-Soft, Tulsa, OK) was used for all statistical calculations.
Estimation of thrombin and fibrin generation rates
The level of F1.2 in plasma is an indication of the amount of thrombin being formed.1 Under baseline conditions the level of F1.2 in blood is a relatively stable parameter in most individuals. Bauer et al estimated the baseline rate of F1.2 formation, and thus the thrombin generation rate (TGR), using the concentration of F1.2 and the rate of F1.2 clearance: TGR (mol/s) = kBCVP, in which kB is the fraction of plasma F1.2 cleared per second in the steady-state, C is the concentration of F1.2, and VP is the plasma volume.1 This method of estimating thrombin generation works well when the rate of thrombin generation is stable. When more rapid changes are occurring, on the order of minutes between samples, or the plasma volume is changing, as occurs during hemodilution, a more sophisticated vascular model is needed. In prior studies we developed a model circulatory system that was used to analyze changes in the fibrinolytic system.8 We found that this improved circulatory model was more accurate for the analysis of rapidly changing factors than models assuming the plasma was a single, well-mixed pool.10 In this study we have modified the circulatory model again to analyze the effects that open-heart surgery and cardiopulmonary bypass have on thrombin and fibrin generation rates.
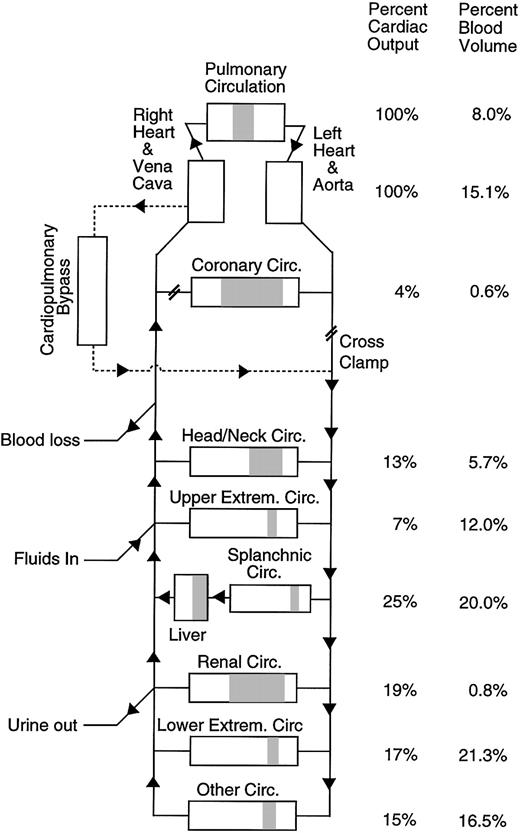
To estimate the rate of thrombin or fibrin generation in vivo for a particular patient at a specific time during surgery, the model vascular system is set up to match the patient's vascular system and surgical procedure as closely as possible (Figure 1). The model vascular system mimics everything that is happening to the patient that might affect the level of factors in the blood such as marker clearance by the liver, hemodilution going on CPB, blood loss, or transfusion. To estimate the thrombin generation rate occurring in the patient, the thrombin generation rate in the model is adjusted to produce the best fit between the measured level of the activation marker in the patient (F1.2 or TAT) and the predicted level of the activation marker in the vascular model. The resulting thrombin generation rate in the model is the best estimate of the in vivo thrombin generation rate in the patient with all other factors taken into account. Each time a thrombin molecule is formed, the vascular model assumes that an F1.2 is formed along with it and that the thrombin molecule is eventually inhibited by antithrombin forming TAT. Each time a fibrin molecule is formed the model assumes 2 FPA fragments are formed. Thrombin and fibrin generation are assumed to occur throughout the vascular system of the patient and the bypass circuit. The model circulatory system used in this study is described in detail on the Blood website; see the Supplemental Document link at the top of the online article. Complete details of the computer program including a copy of the source code and the clinical data set are available at http://depts.washington.edu/labweb/dept/staff/bios/hemostas/.
Diagram of the human circulatory model including cardiopulmonary bypass circuit. The figure shows the relative arterial, microvascular (shaded), and venous blood volumes for different regions of the model. Total blood volume and cardiopulmonary bypass circuit volume in the model are adjusted to match the individual subject being simulated.
Diagram of the human circulatory model including cardiopulmonary bypass circuit. The figure shows the relative arterial, microvascular (shaded), and venous blood volumes for different regions of the model. Total blood volume and cardiopulmonary bypass circuit volume in the model are adjusted to match the individual subject being simulated.
Results
Hemostatic marker levels
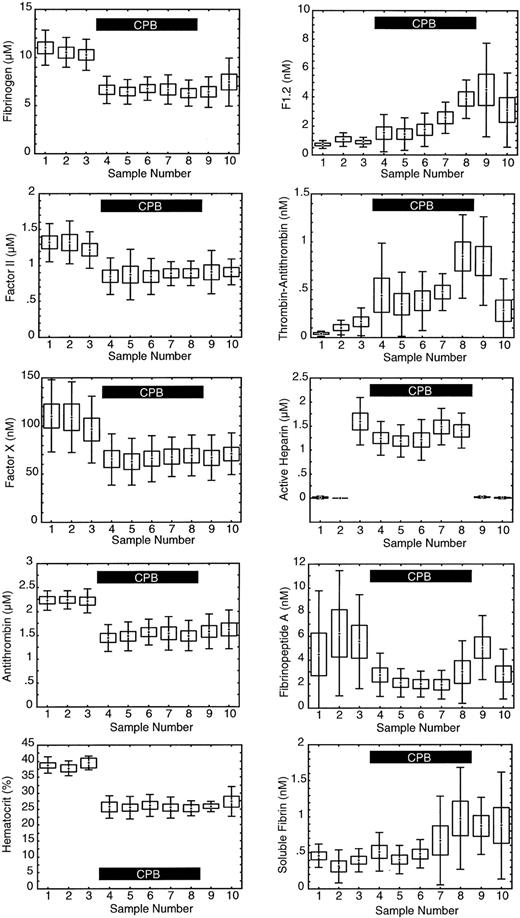
As expected, hematocrit, antithrombin, fibrinogen, factor II, and factor X levels all showed a significant decrease (P = .000 001) immediately after going on CPB (sample 4) due to hemodilution by the bypass circuit priming fluid (Figure 2). At baseline, prior to the start of surgery, the average F1.2 level was 710 ± 260 pM versus an average TAT level of 43 ± 26 pM, a 17-fold difference. Both TAT and F1.2 reflect the thrombin generation rate. At baseline when the thrombin generation rate is relatively constant the difference in absolute concentration reflects the faster clearance of TAT versus F1.2. The baseline half-life of TAT was estimated to be 6 ± 5 minutes for the 9 subjects in this study based on the known half-life of F1.2 and the baseline concentrations of F1.2 and TAT: half-life TAT = 90 minutes × ([TAT pM]/[F1.2 pM]). In Figure 2 it appears the relative change in TAT is much greater than F1.2, but when the absolute changes were compared they were similar. Compared with baseline, within 5 minutes of going on CPB F1.2 levels increased on average 578 pM, while TAT increased 295 pM, a 2-fold difference. When rapid, intense changes in thrombin generation occur, TAT and F1.2 may both show similar absolute changes in concentration. The relative change in F1.2 versus TAT depends on the rate of change in thrombin generation and the clearance. While both F1.2 and TAT show a rise during CPB, indicating increased thrombin generation in general, the actual rate of thrombin generation at any time cannot be discerned from the measured levels alone without accounting for the effects of marker half-life, hemodilution, and others.
Measured levels of hemostatic factors. The levels are as follows: 1 indicates baseline; 2, after sternotomy; 3, after heparinization; 4, after 5 minutes of cardiopulmonary bypass (CPB); 5, after 15 minutes of CPB; 6, after 30 minutes of CPB; 7, 5 minutes prior to reperfusion of heart and lungs; 8, 5 minutes after reperfusion; 9, after protamine infusion; and 10, 2 hours after surgery. Center point indicates mean; box, standard error of the mean; and error bars, standard deviation; n = 9. The solid black box in each graph indicates the period of CPB.
Measured levels of hemostatic factors. The levels are as follows: 1 indicates baseline; 2, after sternotomy; 3, after heparinization; 4, after 5 minutes of cardiopulmonary bypass (CPB); 5, after 15 minutes of CPB; 6, after 30 minutes of CPB; 7, 5 minutes prior to reperfusion of heart and lungs; 8, 5 minutes after reperfusion; 9, after protamine infusion; and 10, 2 hours after surgery. Center point indicates mean; box, standard error of the mean; and error bars, standard deviation; n = 9. The solid black box in each graph indicates the period of CPB.
The average level of FPA significantly decreased during CPB (P = .043), and then rose again after heparin was neutralized at the completion of CPB (sample 9). The average level of soluble fibrin increased significantly after reperfusion of the ischemic heart (P = .000 22).
Estimating the rate of thrombin generation in vivo
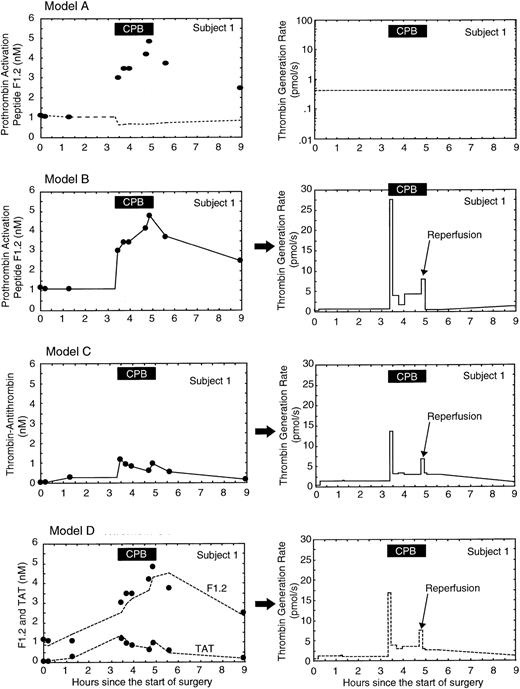
The concentrations of F1.2 and TAT increased after going on CPB, even though these proteins were being hemodiluted along with other factors in the plasma. The increase in F1.2 and TAT within 5 minutes after going on CPB indicated a substantial rise in the rate of thrombin generation. Figure 3 shows the measured levels of F1.2 and TAT in subject 1, the predicted levels from the model system, and the predicted thrombin generation rate for subject 1 using 4 different models of thrombin generation. In model A (Figure 3), thrombin generation is assumed to stay constant throughout the procedure at the baseline level. With constant thrombin generation the model system predicts the F1.2 level will fall during CPB due to hemodilution. In model B (Figure 3) thrombin generation in the circulatory model of subject 1 is adjusted to match the predicted F1.2 levels with the measured F1.2 levels. Model B shows a burst of thrombin generation immediately after going on CPB to levels 60-fold above baseline, a sustained average 7-fold increase in thrombin generation throughout CPB, a smaller 18-fold burst in thrombin generation after reperfusion of the ischemic heart, a return toward baseline levels after CPB and the neutralization of heparin by protamine, and a slight rise to double baseline levels during the first 2 hours after surgery. Even though the average concentration of TAT in subject 1 was 10-fold less than that of F1.2 and the pattern of change during CPB was different, model C (Figure 3) shows that when the effects of different clearance rates and hemodilution were taken into account, both markers produced similar absolute rates and patterns of thrombin generation during CPB: a burst of thrombin generation immediately after starting CPB, a modest increase throughout CPB, another burst of thrombin when the ischemic heart was reperfused, followed by lower levels after CPB. Overall, thrombin generation rates estimated using F1.2 versus TAT were not significantly different, and the 2 thrombin generation rates were highly correlated (r = 0.83). Since the pattern of thrombin generation was similar for F1.2 and TAT, the best estimate of the thrombin generation rate was obtained by adjusting the thrombin generation rate for each sample point to minimize the error between predicted and measured levels of both F1.2 and TAT simultaneously (model D, Figure 3).
Estimating thrombin generation in subject 1 during cardiopulmonary bypass (CPB) using F1.2 and thrombin-antithrombin (TAT) levels. The left column of graphs shows the measured levels (filled circles) and predicted levels (lines) from the circulatory model for each activation marker. The right column of graphs shows the resulting predicted thrombin generation rate from the circulatory model. In model A, the thrombin generation rate in the circulatory model was held constant at the baseline level. The fit with measured F1.2 levels is poor; the predicted F1.2 levels show the effect of hemodilution if thrombin generation was constant. In model B, the thrombin generation rate in the model was adjusted to produce the best fit between measured and predicted levels of F1.2 only. In model C, the thrombin generation rate in the model was adjusted to produce the best fit between measured and predicted levels of TAT only. In model D, the thrombin generation rate in the model was adjusted to produce the best fit between measured and predicted levels of both F1.2 and TAT simultaneously. The solid black box at the top of each graph indicates the period of CPB.
Estimating thrombin generation in subject 1 during cardiopulmonary bypass (CPB) using F1.2 and thrombin-antithrombin (TAT) levels. The left column of graphs shows the measured levels (filled circles) and predicted levels (lines) from the circulatory model for each activation marker. The right column of graphs shows the resulting predicted thrombin generation rate from the circulatory model. In model A, the thrombin generation rate in the circulatory model was held constant at the baseline level. The fit with measured F1.2 levels is poor; the predicted F1.2 levels show the effect of hemodilution if thrombin generation was constant. In model B, the thrombin generation rate in the model was adjusted to produce the best fit between measured and predicted levels of F1.2 only. In model C, the thrombin generation rate in the model was adjusted to produce the best fit between measured and predicted levels of TAT only. In model D, the thrombin generation rate in the model was adjusted to produce the best fit between measured and predicted levels of both F1.2 and TAT simultaneously. The solid black box at the top of each graph indicates the period of CPB.
Effect of TAT half-life on predicted thrombin generation
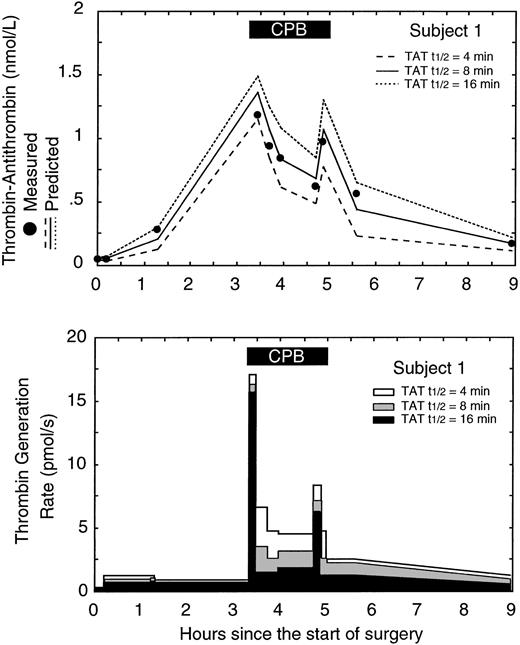
Figure 4 shows the measured TAT levels from subject 1 versus the predicted TAT levels and predicted thrombin generation rates using 3 different half-lives for TAT (the half-life for F1.2 was held constant at 90 minutes). The best fit between measured and predicted TAT levels occurred using a TAT half-life of 8 minutes in the model system. Half-lives shorter than 8 minutes resulted in the model underestimating the true TAT level and likely overestimating the true thrombin generation rate. Half-lives longer than 8 minutes resulted in the model overestimating the true TAT level and likely underestimating the true thrombin generation rate. In general only a single half-life for F1.2 and TAT produced the best fit for each subject. Overall the average best fit half-lives for F1.2 and TAT were 88 ± 24 minutes and 9 ± 6 minutes, respectively, similar to values previously reported.1,21,22
Effect of changes in the thrombin-antithrombin (TAT) half-life used in the model on the predicted thrombin generation rate in subject 1. (A) The measured level of TAT (•) versus the predicted level of TAT in the circulatory model using 3 different TAT half-lives: 4, 8, and 16 minutes. The lowest error between measured and predicted TAT levels occurred with a half-life of 8 minutes. (B) The effect of different TAT half-lives in the circulatory model on the predicted thrombin generation rates. The gray curve corresponds to the best fit between measured and predicted TAT levels and represents the best estimate of the in vivo thrombin generation rate. The solid black box at the top of the figure indicates the period of cardiopulmonary bypass (CPB).
Effect of changes in the thrombin-antithrombin (TAT) half-life used in the model on the predicted thrombin generation rate in subject 1. (A) The measured level of TAT (•) versus the predicted level of TAT in the circulatory model using 3 different TAT half-lives: 4, 8, and 16 minutes. The lowest error between measured and predicted TAT levels occurred with a half-life of 8 minutes. (B) The effect of different TAT half-lives in the circulatory model on the predicted thrombin generation rates. The gray curve corresponds to the best fit between measured and predicted TAT levels and represents the best estimate of the in vivo thrombin generation rate. The solid black box at the top of the figure indicates the period of cardiopulmonary bypass (CPB).
Effect of hemodilution, blood loss, and transfusion
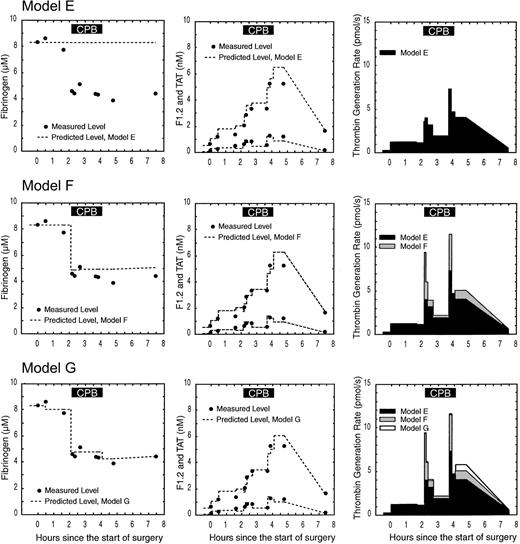
Figure 5 shows the effect of CPB on the levels of fibrinogen, F1.2, and TAT in subject 2 and the corresponding predicted levels and thrombin generation rates using 3 different models. In model E (Figure 5), it is assumed there is no CPB circuit, no hemodilution, and no blood loss or transfusion. In subject 2, actual hemodilution resulted in a drop in the fibrinogen level of approximately 45%. Because hemodilution is not taken into effect in model E, the fit between predicted and total fibrinogen is poor. Hemodilution is also not taken into account for F1.2 and TAT; this results in a lower estimate of thrombin generation compared with models that account for hemodilution (models F and G).
Effect of hemodilution, blood loss, and transfusion on the predicted fibrinogen, F1.2, thrombin-antithrombin (TAT), and thrombin generation rates in subject 2. Each row shows the measured levels (filled circles) versus predicted levels (dotted line) for fibrinogen (first column), F1.2 and TAT (second column), and the resulting thrombin generation rate (third column). Model E assumes no hemodilution; blood loss or transfusion is occurring, resulting in a poor fittothe fibrinogen data and underestimation of the thrombin generation rate. Model F incorporates hemodilution but not blood loss or transfusion, resulting in a better fit with fibrinogen during early CPB and a higher estimate of thrombin generation. Model G incorporates hemodilution, blood loss, and transfusion in the circulatory model, resulting in the best fit between measured and predicted fibrinogen, F1.2 and TAT, and the most accurate estimate of in vivo thrombin generation. The solid black box at the top of the figure indicates the period of cardiopulmonary bypass (CPB).
Effect of hemodilution, blood loss, and transfusion on the predicted fibrinogen, F1.2, thrombin-antithrombin (TAT), and thrombin generation rates in subject 2. Each row shows the measured levels (filled circles) versus predicted levels (dotted line) for fibrinogen (first column), F1.2 and TAT (second column), and the resulting thrombin generation rate (third column). Model E assumes no hemodilution; blood loss or transfusion is occurring, resulting in a poor fittothe fibrinogen data and underestimation of the thrombin generation rate. Model F incorporates hemodilution but not blood loss or transfusion, resulting in a better fit with fibrinogen during early CPB and a higher estimate of thrombin generation. Model G incorporates hemodilution, blood loss, and transfusion in the circulatory model, resulting in the best fit between measured and predicted fibrinogen, F1.2 and TAT, and the most accurate estimate of in vivo thrombin generation. The solid black box at the top of the figure indicates the period of cardiopulmonary bypass (CPB).
In model F (Figure 5), hemodilution is taken into account, but not blood loss and transfusion. The pump prime volume was 1900 mL, while the subject's estimated blood volume was 4105 mL. The fit between measured and predicted fibrinogen immediately after CPB starts is better in model F where the effect of hemodilution can clearly be seen. The fit to measured fibrinogen in model F worsens after CPB is complete due to blood loss and transfusion that were not accounted for. Accounting for the effect of hemodilution on the F1.2 and TAT levels led to a higher estimate to thrombin generation rates in model F versus model E. Incorporating hemodilution into the circulatory model produced better fits to hematocrit and stable protein data like fibrinogen and resulted in up to a 173% increase in the predicted thrombin generation rate immediately after starting CPB.
In model G (Figure 5), hemodilution, blood loss, and transfusion are all taken into account. After surgery, subject 2 showed a 750 mL blood loss and received red cell and plasma transfusions. Model G fits the fibrinogen data better than model E or F during the postoperative period. Incorporating blood loss and transfusion into the circulatory model produced better fits to hematocrit and stable protein data like fibrinogen during period of blood loss and transfusion, resulting in up to a 14% change in the predicted thrombin generation rate. Incorporating hemodilution, blood loss, and transfusion resulted in the best fit between measured and predicted fibrinogen, F1.2, and TAT levels and thus represents the best estimate of the in vivo thrombin generation rate.
Thrombin and fibrin generation in vivo
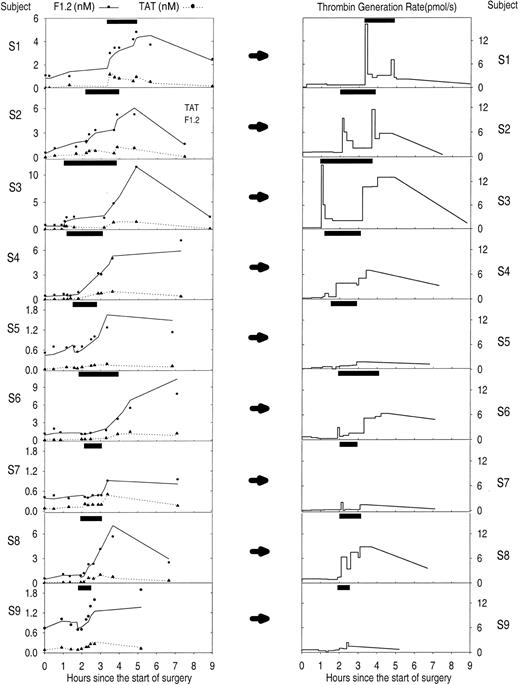
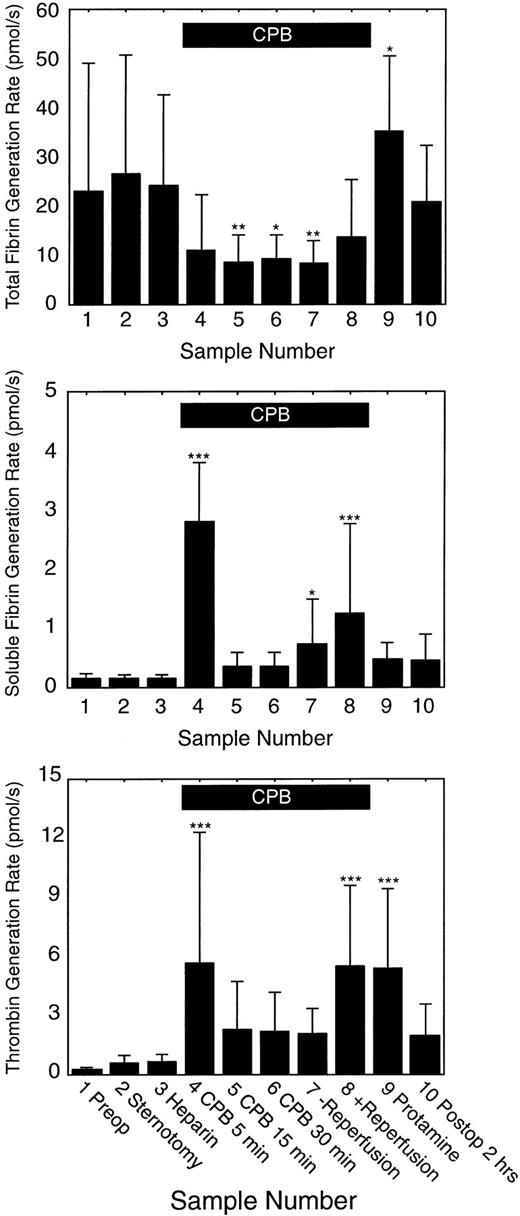
Figure 6 shows the predicted thrombin generation rates versus time from the start of surgery for each of the 9 subjects in the study. Overall there was a good fit between measured and predicted F1.2 and TAT levels for all 9 subjects (Figure 6). Figure 7 shows the average thrombin, total fibrin, and soluble fibrin generation rates for all 9 subjects for each sample point in the study. The average thrombin generation rate was not significantly increased above baseline after sternotomy or heparinization prior to starting CPB. All subjects showed increased thrombin generation 5 minutes after going on CPB (average, 22-fold increase compared with baseline; P = .000 05). Of 9 subjects, 7 showed a sustained increase in thrombin generation for the remainder of CPB, but the response was variable: subjects 5 and 9 showed little response to CPB or reperfusion with only 2-fold to 7-fold changes in thrombin generation at any time, while subjects 7 and 9 showed thrombin generation rates at or below baseline at some point during CPB. On average, thrombin generation was not significantly increased above baseline for sample points 5 to 7 during CPB. All subjects also showed increased thrombin generation after reperfusion of the ischemic heart (sample 8: average, 22-fold increase compared with baseline; P = .000 08). All subjects showed increased thrombin generation compared with baseline after neutralization of heparin (sample 9: average, 25-fold increase; range, 4-fold to 68-fold increase; P = .0002). Overall, thrombin generation fell back toward baseline levels by 2 hours after surgery.
Estimated thrombin generation rate in 9 subjects during cardiopulmonary bypass (CPB) surgery using both F1.2 and thrombin-antithrombin (TAT) levels. The left column of graphs shows the measured levels (•, F1.2; ▴, TAT) and circulatory model predicted levels (solid line, F1.2; dotted line, TAT) of each activation marker. Note variable scale of the y axis. The right column of graphs shows the resulting predicted thrombin generation rate from the circulatory model using both markers simultaneously. The y-axis is the same for all subjects showing noticeable variations in response to CPB among the 9 subjects. The solid black box at the top of each graph indicates the period of cardiopulmonary bypass.
Estimated thrombin generation rate in 9 subjects during cardiopulmonary bypass (CPB) surgery using both F1.2 and thrombin-antithrombin (TAT) levels. The left column of graphs shows the measured levels (•, F1.2; ▴, TAT) and circulatory model predicted levels (solid line, F1.2; dotted line, TAT) of each activation marker. Note variable scale of the y axis. The right column of graphs shows the resulting predicted thrombin generation rate from the circulatory model using both markers simultaneously. The y-axis is the same for all subjects showing noticeable variations in response to CPB among the 9 subjects. The solid black box at the top of each graph indicates the period of cardiopulmonary bypass.
Average thrombin, total fibrin, and soluble fibrin generation rates for each sample time (n = 9). Solid bars indicate the mean level; error bars indicate the standard deviation. The solid black box at the top of the figure indicates the period of cardiopulmonary bypass (CPB). Significantly different than baseline: *P < .05; **P < .01; and ***P < .001.
Average thrombin, total fibrin, and soluble fibrin generation rates for each sample time (n = 9). Solid bars indicate the mean level; error bars indicate the standard deviation. The solid black box at the top of the figure indicates the period of cardiopulmonary bypass (CPB). Significantly different than baseline: *P < .05; **P < .01; and ***P < .001.
On average total fibrin generation was not significantly different from baseline prior to CPB. Average total fibrin generation fell to less than 50% of baseline levels by 15 minutes into CPB and remained reduced compared with baseline until after reperfusion of the ischemic heart. Total fibrin generation increased above baseline levels after CPB was complete and heparin neutralized with protamine, then fell toward baseline levels by 2 hours after surgery. On average, soluble fibrin generation was not significantly different from baseline until CPB started. Within 5 minutes after starting CPB, soluble fibrin generation increased dramatically (average, 22-fold increase compared with baseline; range, 14-fold to 41-fold increase; P < .000 001). Soluble fibrin generation dropped to near baseline levels by 15 minutes into CPB, then slowly rose again to above baseline levels just prior to reperfusion of the ischemic heart. Soluble fibrin generation increased in 8 of 9 subjects after reperfusion of the ischemic heart (average, 7-fold increase; range, no change to 21-fold increase; P = .0002).
Ratio of thrombin to fibrin generation rates
Using the ratio of the fibrin generation rates (total and soluble) to the thrombin generation rate, the model was used to estimate the number of total and soluble fibrin molecules produced per thrombin molecule generated (Table 1). Prior to the start of CPB, there were about 100 total fibrin molecules produced per thrombin generated. This ratio did not change significantly prior to the start of CPB. On average during CPB only about 6 total fibrin molecules were generated per thrombin formed (P < .0003). After CPB was complete and heparin neutralized, about 11 total fibrin molecules were formed per thrombin, which rose to 17 total fibrin molecules per thrombin by 2 hours after surgery.
Thrombin and fibrin generation
. | Thrombin generation, pmol/s . | Fibrin molecules produced per thrombin* . | Percent total fibrin formed as soluble fibrin† . |
|---|---|---|---|
| Baseline | 0.24 ± 0.11 | 108 ± 133 | 1 ± 1 |
| CPB, 5 min | 5.60 ± 6.65‡ | 4 ± 3‡ | 35 ± 34‡ |
| CPB, 30 min | 2.13 ± 2.00 | 8 ± 6‡ | 4 ± 4 |
| Reperfusion | 5.47 ± 4.08‡ | 5 ± 7‡ | 10 ± 11‡ |
| 2 h after surgery | 1.90 ± 1.60 | 17 ± 16‡ | 3 ± 3 |
Ratio of total fibrin generation rate to thrombin generation rate, number of total fibrin molecules produced for each new thrombin formed.
Ratio of soluble fibrin generation rate to total fibrin generation rate, percent of total fibrin generated in the form of soluble fibrin.
P < .001 compared with baseline.
There was a spike in the formation of both thrombin and soluble fibrin immediately after going on CPB (Figure 7). Prior to starting CPB there were about 0.7 soluble fibrin molecules formed for every thrombin formed. Within 5 minutes after starting CPB this ratio increased to about 1.7 soluble fibrin molecules per thrombin generated (P = .0033), even though total fibrin formation per thrombin was decreased more than 10-fold. There was a small rise in soluble fibrin formation and a bigger rise in thrombin generation associated with reperfusion of the ischemic heart near the end of CPB. This was not associated with a rise in the number of soluble fibrin molecules formed per thrombin though. From 15 minutes after starting CPB through the postoperative period the ratio was on average 0.3 soluble fibrin molecules formed per thrombin.
Prior to starting CPB, approximately 1% of the total fibrin formed was soluble fibrin. Within 5 minutes of starting CPB, the fraction of soluble fibrin increased on average to 35% of the total fibrin formed (P = .000 001). During the remainder of CPB about 8% of the total fibrin formed was soluble fibrin. Postoperatively, the ratio returned to baseline with about 3% of total fibrin formed being soluble fibrin.
Discussion
Classically, analysis of in vivo coagulation data has combined statistical analysis of coagulation factor changes with an interpretation based on the investigator integrating what is known about the kinetic regulation of the system, from in vitro studies, with the qualitative pattern of changes seen in the in vivo data. This approach has been very successful and has led to our current understanding of hemostatic regulation in disease. An important point is that it is not the only approach. Once assay methodology and our theory of system regulation is mature enough, a computer modeling approach allows investigators to specifically state assumptions used in the model and in interpreting the data. This interaction between experimental data and a quantitative theoretical model is used extensively in the physical sciences and in the analysis of in vitro biologic systems, but has been used less often for the analysis of changes occurring in vivo.
Analysis of CPB using a quantitative hemostatic model is dependent on 3 factors. First, samples must be taken at appropriate times during the procedure to detect potentially important changes that are occurring, such as the bursts in thrombin generation seen immediately after starting CPB and reperfusion. These time points have often been missed in prior studies. Second, assays must be carefully chosen to encompass critical aspects of the system being studied with results generated in molar units so that kinetic analysis can be performed on the data. Stable proteins such as fibrinogen and antithrombin were used to evaluate hemodilution, blood loss, and transfusion so that these effects could be accounted for in analyzing markers that were changing rapidly like F1.2, TAT, and FPA. Third, the model system is critical since it allows specific assumptions to be defined, tested, and used in analysis and interpretation; allows kinetic processes to be directly compared, such as thrombin versus fibrin generation; and allows kinetic interactions to be studied, as we have done in the fibrinolytic system.8,9
In this study we determined that the process of open-heart surgery utilizing CPB had different effects on thrombin and fibrin generation. At baseline prior to starting surgery, the average thrombin generation rate was about 0.24 picomoles of thrombin per second. On average each thrombin produced resulted in the formation of about 100 total fibrin molecules, of which about 1% was soluble fibrin (Table 1). These rates represent normal baseline hemostasis in a group of older males with heart disease. Sternotomy and heparinization did not significantly affect the thrombin or fibrin generation rates, the number of fibrins produced per thrombin, or the amount of soluble fibrin formed. Initiation of CPB had profound effects on coagulation. Within 5 minutes of starting CPB, thrombin generation increased 20-fold, but each thrombin was producing only 4 total fibrin molecules, of which 35% was now soluble fibrin. Soluble fibrin does not participate in hemostasis to the same degree that fibrin formed at the wound does. When increased, soluble fibrin indicates dysregulation of the hemostatic process.4 Since surgery itself did not significantly affect the thrombin or fibrin generation rates but the start of CPB did, this suggests that exposure of blood to the artificial surface of the bypass circuit led to an increase in the formation of nonspecific or nonhemostatic thrombin, which produces less fibrin overall but more soluble fibrin. This is evidence both that CPB suppresses normal hemostasis as well as increases nonspecific thrombin and fibrin formation.
By 15 to 30 minutes into CPB the nonspecific activation of coagulation had moderated somewhat. Thrombin generation and soluble fibrin formation were reduced from their peaks, but fibrin formation per thrombin was still low. Release of the cross clamp and reperfusion of the ischemic heart resulted in another burst of thrombin and soluble fibrin generation, again suggesting nonhemostatic coagulation activation. Cessation of CPB and neutralization of heparin with protamine was associated with a drop in thrombin generation and a rise in total fibrin generation but with reduced soluble fibrin formation, indicating a return toward normal hemostasis once CPB was complete. While this trend continued in the postoperative period, it should be noted that the number of fibrins produced per thrombin generated was still low even 2 hours after surgery. Comparison of thrombin and fibrin generation rates provides an indication of the changes in coagulation regulation that are occurring during CPB.
Prior studies have typically evaluated thrombin generation based on statistical changes in activation marker levels at the end of CPB, but did not estimate the actual rates of thrombin or fibrin generation in vivo. Prior studies made the important discoveries that appropriate heparin levels, shed blood reinfusion, and bypass circuit coatings all play a role in determining the overall rate of thrombin generation during CPB.23, 24, 25, 26 Reduced thrombin generation during CPB was associated with reduced blood loss and transfusion requirements after CPB.24,26,27
This suggests 2 broad categories of mechanisms related to thrombin generation during CPB. First, excessive coagulation activation due to inappropriate heparin levels or direct reinfusion of shed blood from cardiotomy suction all led to a general increase in thrombin generation that is worse the longer the bypass run lasts.23,25,26,28 Second, initial exposure of blood to the bypass circuit surface and to the ischemic endothelium of the heart leads to transient bursts of thrombin and soluble fibrin during the procedure. The precise mechanism of this transient rise in thrombin generation after exposure to the artificial surface is not clear, but it suggests that improvements in the biocompatibility of the bypass circuit surface could lead to reduced thrombin generation. Estimation of thrombin and fibrin generation rates using this type of model could be used to evaluate whether improved bypass circuit materials or other treatments are effective in reducing hemostatic dysregulation during CPB. Improved hemostasis would be suggested if the thrombin generation rate was decreased and the ratio of fibrins formed per thrombin increased. The burst of thrombin generation after reperfusion of the heart may be due to increased expression of tissue factor and other procoagulants on the endothelial surface of the heart due to ischemia/hypoxia.29, 30, 31 Again, improved methods for open heart surgery may lead to less ischemic/hypoxic injury, which would be indicated by a reduction in thrombin generation after reperfusion.
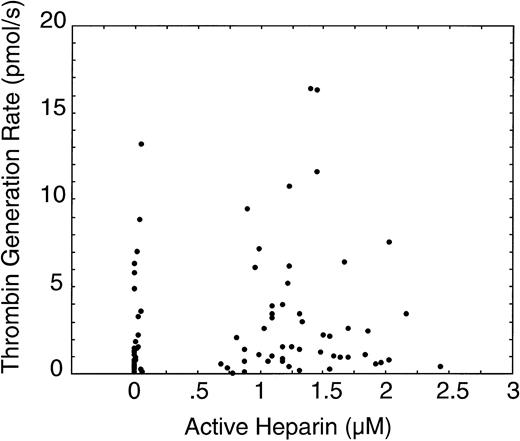
Changes in thrombin generation during CPB were not correlated with the heparin concentration (P = .20, r = 0.14, Figure 8). Instead, the highest levels of thrombin generation occurred in the first few minutes after starting CPB and immediately after reperfusion of the ischemic heart. Heparin concentration may affect the average rate of thrombin generation, but it was not correlated with the rapid changes that were occurring during CPB. In a previous study we determined that changes in F1.2 soon after CPB started were not correlated with infusion of shed blood.25 While reinfusion of shed blood is associated with an overall increase in F1.2, it is not associated with the spike in F1.2 that occurs immediately after going on CPB.
Comparison of the thrombin generation rate versus the heparin concentration for all subjects at all sample times.
Comparison of the thrombin generation rate versus the heparin concentration for all subjects at all sample times.
In developing this type of model it is important to test the effect different assumptions in the model have on the output of the model, in this case the predicted thrombin and fibrin generation rates. We evaluated the ability of the model to correctly simulate the effects of hemodilution, blood loss, and transfusion. The model correctly predicted that the change in the concentration of plasma proteins after starting CPB is a function of the priming fluid volume in the bypass circuit and the plasma volume of the patient. As expected, hemodilution had the biggest effect soon after starting CPB, while blood loss and transfusion modeling improved the fit most during the postoperative period (Figure 5 and the supplemental document). We evaluated different clearance models, concluding that a monophasic model was simpler and easier to understand while providing thrombin generation estimates that were nearly identical to a more complex biphasic model (supplemental document). We tested the effect of different marker half-lives on the model and found that only a single half-life for F1.2 or TAT produced the best fit between measured and predicted levels of these markers (Figure 4). The best fit half-lives from the model were similar to the measured half-lives from previous studies.1,21,22 We also evaluated the potential effect of other thrombin inhibitors, such as heparin cofactor II, concluding that a model assuming 100% of thrombin was inhibited by antithrombin was simpler without significant change to the results. Finally we compared the thrombin generation rates estimated by the model based on 2 different markers of thrombin generation, F1.2 and TAT. As shown in Figure 3, the qualitative pattern and absolute quantitative rate of estimated thrombin generation was similar using F1.2 and TAT. This indicates that the algorithm used to estimate thrombin generation was at least consistent for different markers.
This study has several limitations. First, it was not large enough and was not designed to evaluate clinical outcome (bleeding, postoperative thrombosis). The goal was to better understand the coagulation changes that are occurring during CPB so that future larger studies could incorporate a simplified version of the model to study hemostatic alterations, clinical outcome, and possible therapeutic options. Second, thrombin and fibrin generation rates in this study were the total rate for the entire vascular system including the bypass circuit. It is likely that thrombin and fibrin generation may be relatively localized in different regions of the vascular system, such as the bypass circuit soon after starting CPB and the ischemic heart during reperfusion.32 The local rate of thrombin and fibrin generation in these areas is likely much higher than the overall rate reported.
Prepublished online as Blood First Edition Paper, December 12, 2002; DOI 10.1182/blood-2002-08-2400.
The online version of the article contains a data supplement.
The publication costs of this article were defrayed in part by page charge payment. Therefore, and solely to indicate this fact, this article is hereby marked “advertisement” in accordance with 18 U.S.C. section 1734.
The authors would like to acknowledge the help of Louise Soltow in obtaining the samples used in the study.

This feature is available to Subscribers Only
Sign In or Create an Account Close Modal