Abstract
We investigated whether a developmental immaturity of the dendritic cells (DCs) compartment could contribute to the high susceptibility to infections observed in newborns. DCs are among the first cells to colonize the spleen, but the ontogeny of DC subsets follows distinct steps. At birth, plasmacytoid DCs and CD4-CD8α- DCs are found in the spleen, whereas CD8α+ and CD4+ DCs are not present. Then, the CD8α+ DC compartment quickly develops and reaches an adult size by day 7, whereas the CD4+ DC compartment slowly increases to become predominant by the age of 3 weeks. The production of interleukin (IL)–12p70 by DCs is particularly efficient after birth, reflecting the stronger capacity of the neonatal CD8α- DCs to secrete IL-12 compared with its adult counterpart. Like-wise, neonatal DCs produced type I and II interferons. In vivo, following microbial stimulation, up-regulation of major histocompatibility complexes (MHCs) and of costimulatory molecules on DCs was induced clearly showing the activation of neonatal DCs in the neonatal environment. Therefore, despite a markedly different DC subset composition in early life compared with the adult DC compartment, neonatal DCs are fully competent in their innate immune functions.
Introduction
Early life is a period of high susceptibility to infectious diseases and a stage of immune maturation.1 T-helper 2 (Th2) responses are preferentially induced as well as poor cytotoxic T-cell responses contributing to an increased susceptibility to intracellular pathogens. Much focus has been put on the study of intrinsic defects of neonatal T-cell functions, but under appropriate stimulatory conditions, neonatal T cells mount adultlike response in vitro.2 In vivo, Th1 responses can be induced under certain circumstances in both mouse3,4 and human5,6 neonates. This led to the hypothesis that neonatal immune defects might result from a developmental immaturity of antigen-presenting cell (APC) functions.
Dendritic cells are critical for the stimulation of naive T cells and the regulation of Th1 and Th2 immune responses.7 Dendritic cells (DCs) have also emerged as a key component of the innate immune response and therefore a deficiency in the DC system may account for susceptibility to infections. Early studies by Lu and colleagues8,9 indicated that adherent APCs from neonatal mice express low levels of major histocompatibility complex class II (MHC II), and can be found within 3 days of life in the thymus but not before 2 weeks of age in the spleen. A recent report indicates that the spleen of murine newborns might contain only a few number of DCs, with a majority of CD11c- DC–like population lacking MHC II expression.10 However, more recently, we showed that, at 7 days of life, a substantial number of CD11c+ DCs are present in the spleen and that these cells are able to induce cytotoxic T lymphocyte (CTL) responses in adult recipient mice.11 Here, in order to better understand neonatal immune responses, we analyzed in detail the ontogeny of CD11c+ DCs and their capacity to provide innate responses to microbial stimuli in early life. The present report gives important insights into the development of the DC compartment and shows that neonatal DCs can efficiently respond to microbial agents.
Materials and methods
Mice
BALB/c and C57BL/6 adult mice were purchased originally from CER JANVIER (Le Genest St Isle, France). For pups, pregnant females were purchased from CER JANVIER or mice were bred and housed onsite, and periodic screening showed the colony to be free of commonly occurring infectious agents. Breeding cages were checked daily for new births, and the day of birth was recorded as the day when the litter was found. Neonatal mice were defined as 7 days old or younger and adult mice as 7 to 10 weeks old.
Immunohistochemistry
One-day-, 3-day-, or 7-day-old mice, and adult mice were killed and spleens were fixed in a special fixative containing zinc acetate (0.5%), zinc chloride (0.05%), and calcium acetate (0.05%) in Tris buffer (tris(hydroxymethyl)-aminomethane) at pH 7, for 48 hours. They were embedded in low–melting point paraffin (37°C; polyethylenglycol distearate; Sigma, St Louis, MO). Paraffin sections 5-μm thick were deparaffinized in absolute ethanol, air dried, and used for double-CD11c/CD3 or -CD11c/CD45R immunolabeling. They were first incubated in 0.03% H2O2 to neutralize endogen-peroxidase activity, and after washing, incubated in phosphate-buffered saline (PBS) with 4% bovine serum albumin (BSA) and 0.05% saponine. All antibodies were diluted in the same buffer containing BSA and saponine. Sections were incubated with an anti-CD11c biotinylated antibody (Ab) (HL3; BD Pharmingen, San Diego, CA) overnight at 4°C, and then with streptavidin-biotin. The peroxidase activity was revealed using 3-amino-9-ethylcarbazole (AEC; Sigma). Slides were then incubated with anti-CD3 rabbit antibodies (DAKO, Carpinteria, CA) at room temperature (RT) for 1 hour, and then with antirabbit antibodies coupled to alkaline phosphatase. Fast blue was used as the substrate of alkaline phosphatase. For CD11c/CD45R labeling, sections were incubated successively with a rat monoclonal anti-CD45R/B220 (RA3-6B2; Cedarlane, ON, Canada) for 1 hour at RT, then with an antirat antibody coupled to alkaline phosphatase (DAKO), and with the alkaline phosphatase antialkaline phosphatase (APAAP; DAKO). The phosphatase activity was revealed using NBT-BCIP (nitro blue tetrazolium/5-bromo-4-chloro-3-indolyl phosphate). The slides were mounted in Aquamount medium.
Culture medium and reagents
Complete medium (CM) consisted of RPMI-1640 containing l-alanyl-l-glutamine dipeptide supplemented with 10% fetal calf serum (FCS), 5 × 10⁻⁵ M of beta-2-mercaptoethanol, and antibiotics (penicillin 100 U/mL, streptomycin 100 μg/mL). For cytokine production, DCs were incubated in serum-free HL-1 medium (Bio Whittaker, Walkersville, MD) containing granulocyte-macrophage colony-stimulating factor (GM-CSF) alone or with other cytokines as indicated in the legends. Recombinant mouse interleukin 4 (IL-4), IL-12p70, and rat interferon-γ (IFN-γ) used for in vitro cytokine production were purchased from R&D Systems (Minneapolis, MN). Recombinant IL-10 was purchased from Peprotech (Rocky Hill, NJ).
Cell purification
For DC preparation, spleens were cut into small fragments and digested by collagenase D and DNAseI (400 U/mL and 50 μg/mL respectively; Roche Molecular Biochemicals, Mannheim, Germany), then dissociated in Ca2+-free medium in the presence of EDTA (ethylenediaminetetraacetic acid). DCs were positively selected by anti-CD11c Microbeads (N418; Miltenyi Biotec, Bergisch-Gladbach, Germany) and AutoMACs (Miltenyi Biotec). Purity was more than 95% for adult DCs and 85% to 95% for neonatal DCs. The yield of DCs per spleen was approximately 104 per 1-day-old mouse, 1 × 10⁵ to 2 × 10⁵ per 7-day-old mouse, and 3 × 10⁶ to 4 × 10⁶ per adult mouse.
In some experiments, CD8α+ and CD8α- DC subsets were further sorted by flow cytometry on a FACSTARplus (BD, San Jose, CA) to obtain more than 99% of cell purity.
Flow cytometry analysis
Cells were washed and resuspended in PBS containing 1% FCS and 0.1% NaN3, incubated with anti-CD32/CD16 Fc Block (2.4G2 clone; BD Pharmingen) to avoid nonspecific staining, and labeled at 4°C for 30 minutes in the dark with different combinations of the following fluorescein isothiocyanate (FITC), phycoerythrin (PE), peridinin chlorophyll A protein (PerCP), allophycocyanin or biotin-conjugated monoclonal Abs (mAbs): anti-CD11c (HL-3), anti-CD8α (53-6.7), anti-CD4 (RM4-5), anti-CD11b (M1/70), anti-CD19 (1D3), anti-CD25 (7D4), anti-CD3ϵ (145-2C11), anti-CD45R/B220 (RA3-6B2), anti-CD45RB (16A), anti–Gr-1 (RB6-8C5), anti-CD80 (16-10A1), anti-CD86 (GL1), anti-Ab (25-9-17), anti-Ad (AMS-32.1), anti-DX5, and control immunoglobulin G2b (IgG2b; A95-1). For intracellular cytokine staining, anti–IL-12p40/70 (C15.6) and isotype control mAb IgG1 (R3-34) were used after cell fixation/permeabilization (see “Intracellular cytokine staining”). All mAbs were purchased from BD Pharmingen, except anti-CD205 (NLDC-145; Cedarlane), anti-F4/80 (CI: A3-1; Serotec, Oxford, United Kingdom), and anti-33D1 (33D1; American Type Culture Collection [ATCC], Rockville, MD). Biotinylated mAbs were detected by streptavidin-conjugated PE or FITC (BD Pharmingen). Cells were analyzed on a FACSCalibur flow cytometer (BD Biosciences, San Diego, CA) after gating out autofluorescent cells with CellQuest software (BD Biosciences).
DC-stimulating molecules
An oglionucleotide with unmethylated CpG motifs (underlined) (ODN 1826; TCCATGACGTTCCTGACGTT, CpG ODN)12 and control ODN (ODN 1982; TCCAGGACTTCTCT CAGGTT, Cntl ODN) were synthesized by GENSET (Paris, France). Poly I:C was purchased from Amersham (Little Chalfont, United Kingdom).
Intracellular cytokine staining
DCs purified as described in “Cell purification” were pulsed with ODN 1826 or ODN 1982 for 1 hour, then brefeldin A was added. After 3 hours, surface staining of DCs was performed for CD11c together with B220, CD8α, or CD11b. Then, intracellular cytokine staining was performed with the Pharmingen kit following manufacturer's protocol, using anti–IL-2p40/p70 (clone C15.6) or control IgG1 labeled with allophycocyanin (Pharmingen). Samples were analyzed by fluorescence-activated cell sorter (FACS).
Cytokine ELISA assay
All cytokines were detected by standard sandwich enzyme-linked immunosorbent assay (ELISA). Maxisorp plates (NUNC, Rockilde, Denmark) were coated with purified anti–IL-12p70 or anti–IFN-γ capture mAbs (9A5 and R4-6A2 clones respectively; BD Pharmingen), and detection was done by using corresponding biotinylated mAbs (C17.8 and XMG1.2 clones; BD Pharmingen). The plates were developed by using streptavidin–horseradish peroxidase (HRP; BD Pharmingen) and O-phenylenediamine (Sigma) as substrate. The assays were standardized with recombinant murine cytokines (BD Pharmingen). IFN-α was detected by mouse IFN-alpha ELISA Kit (R&D Systems).
Results
DCs during the organogenesis of the spleen
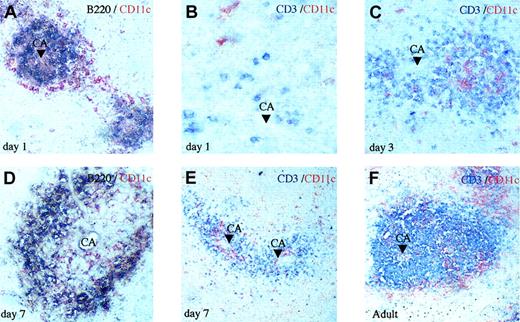
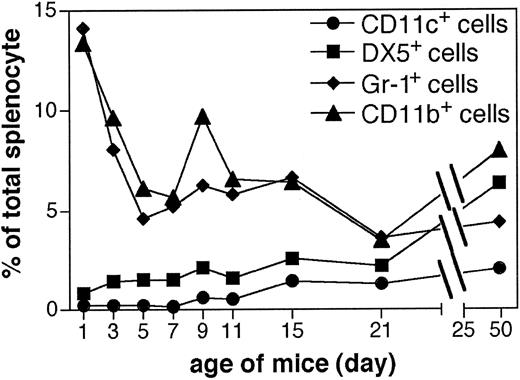
In order to document how and when DCs arise in the spleen, we performed an immunohistochemical staining of DCs together with B or T cells during the first week of life. Analysis of spleen tissue sections showed that at day 1, B cells are found around arterioles and they are surrounded by a thin ring of DCs (Figure 1A), whereas CD3+ cells are rare and sparse on the tissue section (Figure 1B). By day 3, T cells occupy the periarteriolar zone (Figure 1C) surrounded by B cells (data not shown). The increase of T cells was confirmed by FACS analysis, with DC–T-cell ratios of 1:0.3 to 1:1 at day one and 1:1.7 to 1:2 at day 3. By day 7, the spleen architecture is fairly recognizable, as patches of white pulp around central arterioles become clearly visible. In the white pulp, B cells are located at the periphery (Figure 1D), whereas DCs are mainly visualized in the T-cell zone (Figure 1E), as within the adult spleen (Figure 1F). These results clearly show that DCs are present in the spleen at very early times, but before 7 days of life the lymphoid tissue is not yet structured as that of adult lymphoid tissue, as previously shown for B and T cells.13 Table 1 shows the total CD11c+ DC number found in the spleen from birth to adulthood. At day 7, the spleen DC–T-cell ratio has reached an adultlike 1:5 to 1:10 ratio.11 In contrast, DX5+ natural killer (NK) cells are about 3to 5-fold more numerous than DCs along the first week of life (Figure 2). It can be noticed in Figure 2 that a high percentage of neutrophils (Gr-1+ and CD11b+), about 10% to 15% of total spleen cells, are also found in the spleen after birth. Therefore, altogether our data show that at very early stages, the spleen contains a high ratio of innate effector cells, indicating that DCs might play a role in the innate immune responses.
Early colonization of the spleen by DCs. Paraffin sections (37°C) of spleens from neonates at days 1 (A-B), 3 (C), and 7 (D-E) and adult mice (F) as indicated were labeled for CD11c DCs (red) together with B220 B cells (purple) or CD3 T cells (blue). B cells first appear around the central arteriole (CA) with a ring of DCs (A). Rare T cells are seen at day 1 (B), but at day 3 they are much more numerous and clearly organized around the central arteriole mixed with DCs (C). At day 7, multiple T-cell zones are found and DCs are clearly visualized in the white and red pulp (D-E) as in adult spleen (F). Original magnifications, × 500 (B), × 250 (A,C-D), and × 125 (E-F).
Early colonization of the spleen by DCs. Paraffin sections (37°C) of spleens from neonates at days 1 (A-B), 3 (C), and 7 (D-E) and adult mice (F) as indicated were labeled for CD11c DCs (red) together with B220 B cells (purple) or CD3 T cells (blue). B cells first appear around the central arteriole (CA) with a ring of DCs (A). Rare T cells are seen at day 1 (B), but at day 3 they are much more numerous and clearly organized around the central arteriole mixed with DCs (C). At day 7, multiple T-cell zones are found and DCs are clearly visualized in the white and red pulp (D-E) as in adult spleen (F). Original magnifications, × 500 (B), × 250 (A,C-D), and × 125 (E-F).
No. of different subsets of splenic DCs from 1-day-old mice to 7-week-old BALB/c mice
. | . | . | DC subset no., × 104 . | . | . | . | |||
|---|---|---|---|---|---|---|---|---|---|
| Age of mouse, d . | SP no., × 106 . | DC no., × 104 . | CD4-/8α- . | CD4-/8α+ . | CD4+/8α- . | CD4+/8α+ . | |||
| 1 | 4.4-5.6 | 1.2-1.5 | 1.1-1.4 | 0.04-0.08 | 0.04-0.07 | 0.008-0.02 | |||
| 7 | 51.7-128 | 11.2-23.3 | 5-11 | 3.9-10 | 1.2-2.1 | 0.6-1.5 | |||
| 15 | 112-130 | 160-191 | 55-72 | 60 | 31-45 | 13 | |||
| 21 | 211-268 | 280-356 | 62-90 | 101-106 | 97-136 | 19-24 | |||
| 49 | 213-226 | 574-623 | 101-106 | 100-110 | 339-374 | 27-36 | |||
The counted number of total splenocytes (SP) and the calculated number of total splenic CD11chigh DCs and DC subsets obtained from FACS data as in Figure 3F are indicated. Data represent the cell numbers obtained from 2 to 7 mice
Ontogeny of innate spleen cells. At various ages, pooled spleen cells of 4 BALB/c mice were analyzed by FACS for the expression of CD11c, DX5, Gr-1 and CD11b expression. Results are expressed as the percentage of positive cells out of the total spleen cells.
Ontogeny of innate spleen cells. At various ages, pooled spleen cells of 4 BALB/c mice were analyzed by FACS for the expression of CD11c, DX5, Gr-1 and CD11b expression. Results are expressed as the percentage of positive cells out of the total spleen cells.
Ontogeny of DC populations in the spleen: a step-by-step colonization by the different DC subsets
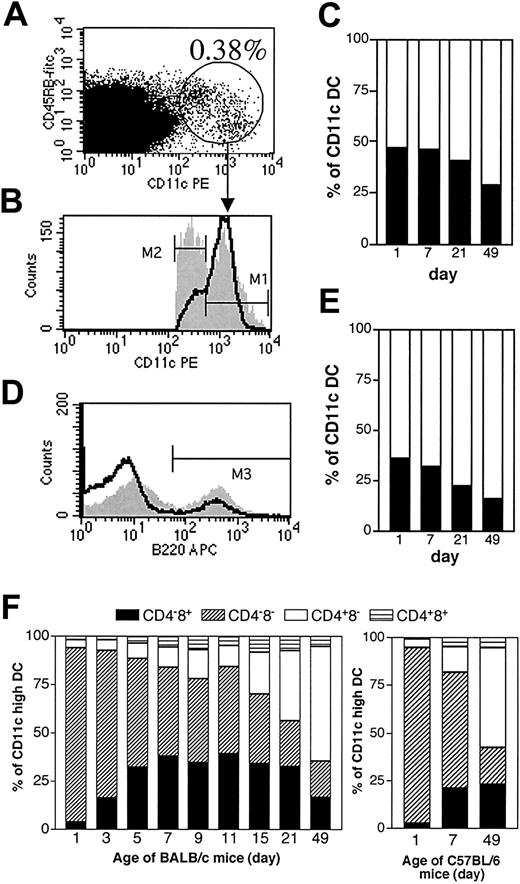
We then analyzed the ontogeny of the different DC populations in the spleen of mice in the early days of life. According to the level of CD11c expression, DCs can be divided in 2 groups: CD11clow and CD11chigh (Figure 3A-B). As shown in Figure 3B-C, neonatal DCs display a higher frequency of CD11clow DCs (about 50%) compared with adult DCs that are mainly CD11chigh. Recently, the mouse homolog of human plasmacytoid DC (PDC) subset, responsible for IFN-α production,14 has been described and characterized as CD11clow.15,16 We thus analyzed whether the abundant CD11clow population referred to this PDC subset. When we assessed the presence of PDCs, by analyzing the expression of B220 (Figure 3D-E) and Ly6C/G (data not shown), we found in BALB/c mice that PDCs are about 30% to 40% of total spleen DCs during the first 2 to 3 weeks of life, whereas they only represent 10% to 15% in adult spleen. Like their adult counterpart, neonatal PDCs expressed CD45RB (Figure 3A) but lack CD8, CD11b, and CD205 expression (not shown). However, in contrast to the adult PDC phenotype, CD4 is poorly expressed during the first week of life (not shown).
Ontogeny of mouse splenic DC populations analyzed by flow cytometry. (A) Spleen DCs of BALB/c (A-F) or C57BL/6 (F) mice were analyzed from birth to adulthood for the expression of CD11c (A-C) together with B220 (D-E), CD4 (F), CD8α (F). (A) Day-1 spleen cells analyzed for CD11c and CD45RB. (B) Level of CD11c is shown for cells gated in panel A and taken from day-1 (gray) versus adult animal (bold line) cells. M1 and M2 gates define CD11chigh and CD11clow DCs, respectively. (C) CD11c+ cells were analyzed at various ages for CD11chigh (□) and CD11clow (▪) DC populations according to gating shown in panel B. (D) Gated CD11c+CD19- cells were analyzed for B220 expression in day-1 (gray) versus adult spleen (bold line) cells. M3 defines B220+ cells. (E) The percentage of PDCs (B220+) in the spleen is shown at various ages according to gating shown in panel D. PDCs were CD11clowCD4+/-CD8α-CD19-B220+CD45RB+Ly6C/G+MHCIIlow at all developmental stages, but CD4 was poorly expressed early in life (not shown). □ represents B220-; ▪, B220+. (F) At various ages, CD11chigh DCs from BALB/c and C57BL/6 mice were analyzed for CD4 and CD8α expression. Calculated percentages correspond to the mean of results obtained in 3 to 5 mice analyzed in the same experiment.
Ontogeny of mouse splenic DC populations analyzed by flow cytometry. (A) Spleen DCs of BALB/c (A-F) or C57BL/6 (F) mice were analyzed from birth to adulthood for the expression of CD11c (A-C) together with B220 (D-E), CD4 (F), CD8α (F). (A) Day-1 spleen cells analyzed for CD11c and CD45RB. (B) Level of CD11c is shown for cells gated in panel A and taken from day-1 (gray) versus adult animal (bold line) cells. M1 and M2 gates define CD11chigh and CD11clow DCs, respectively. (C) CD11c+ cells were analyzed at various ages for CD11chigh (□) and CD11clow (▪) DC populations according to gating shown in panel B. (D) Gated CD11c+CD19- cells were analyzed for B220 expression in day-1 (gray) versus adult spleen (bold line) cells. M3 defines B220+ cells. (E) The percentage of PDCs (B220+) in the spleen is shown at various ages according to gating shown in panel D. PDCs were CD11clowCD4+/-CD8α-CD19-B220+CD45RB+Ly6C/G+MHCIIlow at all developmental stages, but CD4 was poorly expressed early in life (not shown). □ represents B220-; ▪, B220+. (F) At various ages, CD11chigh DCs from BALB/c and C57BL/6 mice were analyzed for CD4 and CD8α expression. Calculated percentages correspond to the mean of results obtained in 3 to 5 mice analyzed in the same experiment.
Splenic CD11chigh DCs are usually subdivided in different subsets according to the cell surface expression of CD4 and CD8α molecules,17,18 which are more or less associated with different functional properties.19 In adult mice, the composition of the spleen corresponds to about 50% of CD4+ DCs and 25% to 30% CD8α+ DCs, and the remaining DCs are double-negative (DN) for CD4 and CD8α. This distribution is shown in Figure 3F for adult BALB/c and C57BL/6 mice, respectively. Strikingly, during early life, CD4/CD8α distribution on DCs is markedly different from that observed in adults. Indeed, at birth almost all DCs are double-negative (DN) for CD4 and CD8α and this DN subset remains dominant until the second week of life (Figure 3F). The percentage of the CD4-CD8α+ subset rapidly increases during the first days of life and reaches its maximum at day 7. In contrast, the size of the CD4+CD8α- subset starts to increase from the second week of life to become the major DC subset in adult spleen. The calculated numbers of the different DC subsets found in the spleen from 1-day-old to adult BALB/c mice are shown in Table 1. Altogether, these results show that the ontogeny of the various spleen DC subsets follows different streams resulting in a different composition of DCs at early stages of life compared with adulthood.
The surface phenotype of the CD4-CD8α- DC subset evolves during ontogeny
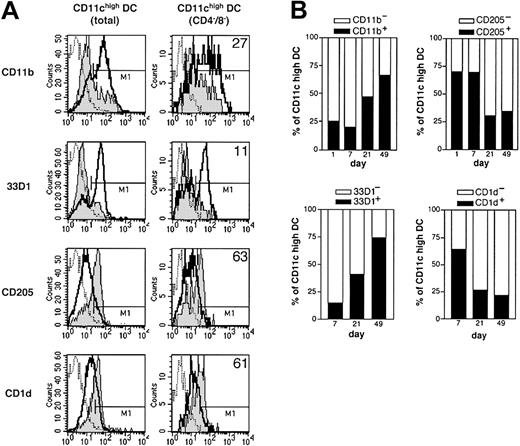
CD4 or CD8α expression is mutually exclusive on CD11chigh DCs and is strongly associated with a set of other surface molecules. In adult spleen, the CD4+CD8α- DC subset expresses myeloid markers such as CD11b, F4/80, and 33D1, but only low levels of CD1d and CD205, which are associated with the CD4-CD8α+ DC subset.18,20-22 The same pattern of expression of these molecules was found for neonatal CD4+CD8α- and CD4-CD8α+ DCs along the development as early as these subsets are found (data not shown). The DN (CD4-CD8α-) found in an adult spleen displays a CD4-like phenotype18 as it expresses CD11b, F4/80, and 33D1. Interestingly, the opposite phenotype was found on DN DCs during the first 2 weeks of life. Indeed, when the DN DC subset was analyzed, it displays mainly a CD8α-like phenotype, expressing CD205 and CD1d but poorly expressing CD11b and 33D1 during the first week of life and therefore was markedly different from adult DN DCs (Figure 4A). From 2 weeks of age, a progressive transition of spleen DN DCs occurs from a CD8α-like to the CD4-like phenotype found in adults. Consequently, at days 1 and 7, CD11chigh DCs were mainly CD205+CD1d+33D1-CD11b- as opposed to their 3-week-old and adult counterparts (Figure 4B). These results show that the DN CD11chigh DC subset does not represent a stable subset during ontogeny. The original molecular surface pattern found on neonatal DCs may influence either the susceptibility to infection or the development of immunity.
Early-life DCs display a distinct pattern of cell surface markers compared with adult DCs. (A) CD11chigh total cells (left) and CD11chighCD4-CD8- double-negative cells (DN DC, right) as defined in Figure 3, were FACS analyzed for the expression of CD11b, 33D1, CD205, and CD1d. DCs from 7-day-old mice (gray histogram) and adult mice (bold line) were compared. M1 gate for each marker delineate positive cells in reference to control antibody (dotted line) and the percentage of positive 7-day-old DCs of the right column are shown. (B) At various ages, CD11chigh total cells are analyzed by FACS for CD11b, 33D1, CD205, and CD1d as in the left column in panel A.
Early-life DCs display a distinct pattern of cell surface markers compared with adult DCs. (A) CD11chigh total cells (left) and CD11chighCD4-CD8- double-negative cells (DN DC, right) as defined in Figure 3, were FACS analyzed for the expression of CD11b, 33D1, CD205, and CD1d. DCs from 7-day-old mice (gray histogram) and adult mice (bold line) were compared. M1 gate for each marker delineate positive cells in reference to control antibody (dotted line) and the percentage of positive 7-day-old DCs of the right column are shown. (B) At various ages, CD11chigh total cells are analyzed by FACS for CD11b, 33D1, CD205, and CD1d as in the left column in panel A.
Innate responses of neonatal DCs
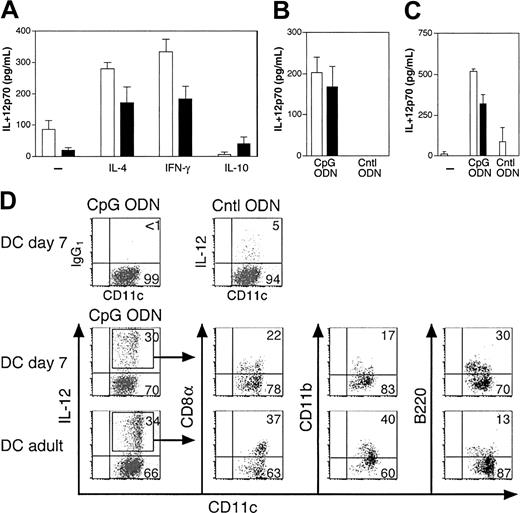
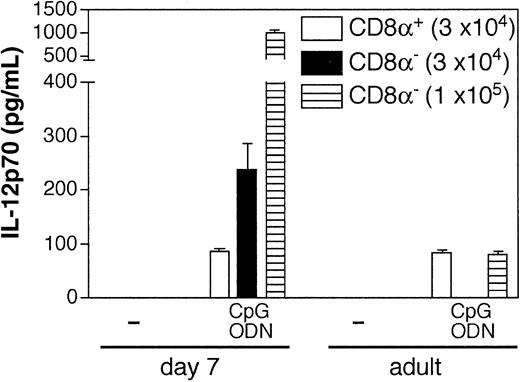
Toll-like receptors (TLR) are unequally distributed among human DC subsets,23-25 and the same may be true for mouse DCs. Moreover, innate responses to a given microbial product are qualitatively and quantitatively heterogeneous among DC subsets. For instance, IL-12 was shown to be produced mainly by CD8α+ DCs.21,26,27 Therefore, we next investigated the innate responses of neonatal DCs. The analysis of IL-12 production by purified neonatal DCs upon CpG ODN stimulation showed that DCs from 7-day-old mice were consistently more efficient in producing IL-12p70 than adult-derived DCs (Figure 5A). IL-12 response by 7-day DCs is increased in the presence of IL-4 or IFN-γ, but not IL-10, showing that cytokine-mediated control of IL-12 production was identical to that of adult DCs. DCs from 1-day-old mice were also efficient in producing IL-12 (Figure 5B). Similar results were obtained in BALB/c and C57BL/6 mice (Figure 5A,C). Analysis of IL-12 production by DC subsets was also performed by intracellular cytokine staining (Figure 5D). For 7-day-old DCs, the 3 main populations, B220+ DCs, CD8α+ DCs, and DN DCs (in the present case as CD8α-B220-CD11b- cells) were involved in IL-12 production, whereas in adults CD8α+ and CD11b+ DCs produced mainly IL-12. Of note, among DC subsets, adult CD8α+ DCs and neonate DN DCs displayed the highest intensity of IL-12 intracellular staining (data not shown), indicating that they are in each case the main producers of IL-12. Although IL-12 intracellular staining does not only reflect the bioactive IL-12p70, the efficient IL-12p70 production by 1-day-old DCs (Figure 5B), a time where only very rare CD8α+ DCs are found (Figure 3F), strongly supports the view that DN DCs participate to biologically active IL-12 production at this stage. To verify this point, CD11chigh DCs taken at day 7 and at adult age were sorted by FACS as CD8α- and CD8α+ DC subsets and tested for IL-12p70 secretion. Upon CpG-ODN stimulation, both neonatal and adult CD8α+ DC subsets produced IL-12p70 with a similar efficiency at 3 × 10⁴ cells/well (Figure 6). In contrast, when CD8α- DCs were stimulated under the same conditions, only neonatal DCs, but not adult DCs, produced detectable amounts of IL-12p70. When 105 CD8α- DCs were stimulated, IL-12 was produced by both neonatal and adult CD8α- DCs but with a higher efficiency for neonatal DCs. This discrepancy between neonate and adult responses most likely stems from the composition of the purified CD8α- DCs population, which contains 80% to 90% of DN DCs in neonatal spleen but only 20% of DN DCs in adult spleen. Altogether, these results clearly show that neonatal murine spleen DCs do not have any intrinsic defect in their capacity to produce bioactive IL-12.
IL-12 production of early life DCs in response to stimulation by CpG ODN. (A-C) Purified splenic CD11c+ DCs were stimulated in various conditions and supernatants were harvested after 24 hours and analyzed by ELISA for IL-12p70 production. (A) DCs (105) from 7-day-old (□) and adult (▪) BALB/c mice were stimulated with 10 μg/mL CpG ODN in serum-free HL-1 medium containing GM-CSF in the absence or presence of IL-4 (5 ng/mL), rat IFN-γ (10 ng/mL) or IL-10 (2 ng/mL). (B) Indicated numbers of DCs from adult (▪; 3.75 × 10⁴) or 1-day-old (□; 3.75 × 10⁴) BALB/c mice were cocultured with 10 μg/mL CpG ODN or control ODN (Cntl ODN) in HL-1 medium containing GM-CSF and IL-4. (C) DCs from adult (▪) or 7-day-old (□) C57BL/6 mice were stimulated as indicated. (D) Purified 7-day-old or adult splenic CD11c+ DCs were stimulated under the same conditions as in panel B and stained for CD11c and IL-12 in combination with CD8α, CD11b, or B220. Isotype control antibody staining for CpG-ODN–stimulated DCs and IL-12 staining for Cntl ODN–stimulated DCs are shown as control (top). To analyze IL-12 production by different subpopulations of DCs, IL-12 positive cells are gated as indicated (boxes) and DCs from 7-day-old (middle) or adult (bottom) mice are compared. Numbers in panel C indicate the frequency of DCs in each quadrant. Data are from one of 3 experiments with similar results.
IL-12 production of early life DCs in response to stimulation by CpG ODN. (A-C) Purified splenic CD11c+ DCs were stimulated in various conditions and supernatants were harvested after 24 hours and analyzed by ELISA for IL-12p70 production. (A) DCs (105) from 7-day-old (□) and adult (▪) BALB/c mice were stimulated with 10 μg/mL CpG ODN in serum-free HL-1 medium containing GM-CSF in the absence or presence of IL-4 (5 ng/mL), rat IFN-γ (10 ng/mL) or IL-10 (2 ng/mL). (B) Indicated numbers of DCs from adult (▪; 3.75 × 10⁴) or 1-day-old (□; 3.75 × 10⁴) BALB/c mice were cocultured with 10 μg/mL CpG ODN or control ODN (Cntl ODN) in HL-1 medium containing GM-CSF and IL-4. (C) DCs from adult (▪) or 7-day-old (□) C57BL/6 mice were stimulated as indicated. (D) Purified 7-day-old or adult splenic CD11c+ DCs were stimulated under the same conditions as in panel B and stained for CD11c and IL-12 in combination with CD8α, CD11b, or B220. Isotype control antibody staining for CpG-ODN–stimulated DCs and IL-12 staining for Cntl ODN–stimulated DCs are shown as control (top). To analyze IL-12 production by different subpopulations of DCs, IL-12 positive cells are gated as indicated (boxes) and DCs from 7-day-old (middle) or adult (bottom) mice are compared. Numbers in panel C indicate the frequency of DCs in each quadrant. Data are from one of 3 experiments with similar results.
IL-12p70 production by neonatal CD8α- and CD8α+ DC subsets. Magnetically purified CD11chigh DCs from adult or 7-day-old BALB/c mice were sorted as CD8α- and CD8α+ DC subsets by flow cytometry (purity was > 99% for all DC subsets). The indicated cell number was stimulated with 10 μg/mL CpG-ODN or left untreated, and 24-hour supernatants were tested for IL-12p70 content by ELISA. Data are representative of 2 experiments.
IL-12p70 production by neonatal CD8α- and CD8α+ DC subsets. Magnetically purified CD11chigh DCs from adult or 7-day-old BALB/c mice were sorted as CD8α- and CD8α+ DC subsets by flow cytometry (purity was > 99% for all DC subsets). The indicated cell number was stimulated with 10 μg/mL CpG-ODN or left untreated, and 24-hour supernatants were tested for IL-12p70 content by ELISA. Data are representative of 2 experiments.
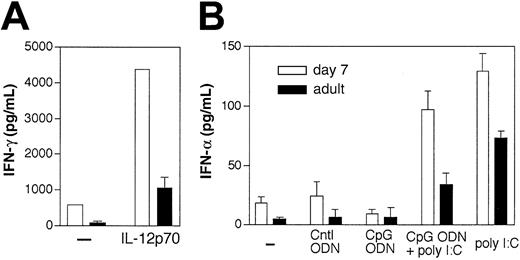
In the presence of IL-12, DCs were shown to produce IFN-γ,28 which is important for nitric oxide–mediated antibacterial activity. However, there is a controversy about whether the CD8α+ DC subset28 or the CD8α- DC subset29 is responsible for IFN-γ production. Neonatal DCs were also very efficient in producing IFN-γ in response to IL-12 stimulation compared with adult DCs (Figure 7A). Following stimulation of 105 neonatal CD8α- DCs with CpG ODN (that induces IL-12 as shown in the previous paragraph), we found that these cells were able to produce a high amount of IFN-γ (data not shown). However, we were not able to test the neonatal CD8α+ DC subset using an equivalent cell number (only tested with 3 × 10⁴ cells or below and no IFN-γ was found; data not shown) to definitely assess that this subset could not produce IFN-γ. Finally, neonatal DCs were tested for their capacity to produce IFN-α, a key component of antiviral innate immunity that was recently shown to be produced by murine plasmacytoid DCs.15 Upon Poly I:C stimulation, 7-day-old mouse DCs more efficiently produced IFN-α (Figure 7B) compared with adult DCs. This phenomenon probably reflects the fact that the spleen of neonates contains a higher number of PDCs (Figure 3D-E). The presence of CpG ODN did not induce any IFN-α production by DCs and did not modify IFN-α production following Poly I:C stimulation. Altogether, these results show that stimulation through TLR9 and 3 (sensors for CpG ODN and Poly I:C, respectively30,31 ) can efficiently induce IL-12 and type I and II interferon responses by neonatal DCs and thus show that DCs can play an important role in early-life host defense.
Type I/II IFN production by early life DCs in response to different stimuli. (A) IFN-γ production by 8 × 10⁴ purified splenic CD11c+ DCs in HL-1 medium containing GM-CSF and IL-4, in response to 5 ng/mL IL-12. Purity of cells was 96% for day-7 DCs and 97% for adult DCs. (B) IFN-α production by C57BL/6 DCs stimulated with CpG ODN (10 μg/mL) alone or in combination with poly I:C (100 μg/mL) for 24 hours. Supernatants were harvested and analyzed by ELISA. One of 3 similar experiments is shown.
Type I/II IFN production by early life DCs in response to different stimuli. (A) IFN-γ production by 8 × 10⁴ purified splenic CD11c+ DCs in HL-1 medium containing GM-CSF and IL-4, in response to 5 ng/mL IL-12. Purity of cells was 96% for day-7 DCs and 97% for adult DCs. (B) IFN-α production by C57BL/6 DCs stimulated with CpG ODN (10 μg/mL) alone or in combination with poly I:C (100 μg/mL) for 24 hours. Supernatants were harvested and analyzed by ELISA. One of 3 similar experiments is shown.
DC activation in vivo
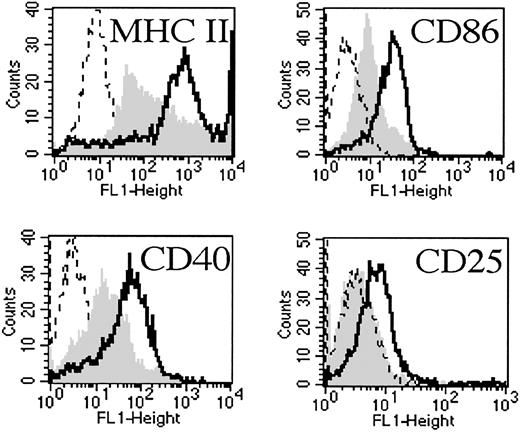
In addition to cytokine production, another important parameter of DC activation following microbial stimulation is the up-regulation of MHCs and costimulatory molecules required for productive interaction with naive T cells. We recently showed that in vitro stimulation with lipopolysaccharide (LPS) led to this activation state.11 In order to document if such DC activation can also be obtained in vivo, 7-day-old mice were injected with CpG ODN or control ODN. Three hours later, DCs were purified and phenotypically analyzed by FACS. Figure 8 shows that under these conditions, DCs from CpG-ODN–treated mice were strongly activated as shown by the up-regulation of MHC II, CD40, CD86, and CD25. These results clearly show that the neonatal environment does not affect the activation/maturation of neonatal DCs.
In vivo maturation of neonatal DCs. Seven-day-old mice were intraperitoneally injected with 100 μg CpG-ODN (bold line) or control ODN (gray histogram). Three hours later, spleen DCs were purified and analyzed by FACS for MHC II, CD40, CD86, and CD25 expression. Dashed line corresponds to isotypic control mAb on DCs purified from CpG-ODN–injected mice. Data are representative of 3 experiments.
In vivo maturation of neonatal DCs. Seven-day-old mice were intraperitoneally injected with 100 μg CpG-ODN (bold line) or control ODN (gray histogram). Three hours later, spleen DCs were purified and analyzed by FACS for MHC II, CD40, CD86, and CD25 expression. Dashed line corresponds to isotypic control mAb on DCs purified from CpG-ODN–injected mice. Data are representative of 3 experiments.
Discussion
Here we described the ontogeny of spleen DCs and analyzed their functional properties during the early period of life. Our data highlight that DCs develop after birth as an arm for innate resistance to pathogens, but are also in early life a competent partner for the stimulation of the T-cell–adaptive immunity.
At birth, only 2 DC populations are found in the mouse spleen, CD11clow B220+ and CD11chigh CD4-CD8α- DN. This observation raises the question whether these cells represent DC precursors, terminally differentiated DCs, or immature DCs. Recent reports indicate that blood and bone marrow CD11clow B220+ cells can behave as a precursor and give rise to all DC subsets.32,33 This DC subset has reduced T-cell allostimulatory abilities (maybe related to regulatory functions34 ), but it is functional at the level of innate responses as it has the capacity to produce IL-12 and IFN-α in vitro and in vivo.15,35,36 Regarding the CD11chigh CD4-CD8α- DN population, it is important to note the progressive transition of this DN DC from a CD8α-like DC phenotype toward a CD4-like DC along the development. This phenomenon may reflect the ontogeny of CD8α+ and CD4+ DCs, starting by a first wave of CD8α+ DCs after birth followed by a second wave of CD4+ DCs at 2 to 3 weeks of age. This could indicate that the neonatal DN subset represents a transition state rather than a full precursor, which would first give rise to CD8α+ DCs and then evolve to generate CD4+ DCs. It is quite striking to see how the developmental composition of the DC system is comparable to the dendropoiesis obtained after transfer of common myeloid or lymphoid precursors to adult recipient mice, where a first wave of CD8α+DCs is followed by a second wave of CD4+DCs.37,38 However, the CD4-CD8- DN DCs are poorly generated following transfer of DC precursors,38 which indicates that the high number of DN DCs in early life may represent a particular feature of the developmental program of the DC system during spleen neogenesis. The expression of CD8α on DCs has been proposed to result from the maturation program of DCs.39 This hypothesis fits well with the rapid increase of CD8α+ DCs observed during the first week of life that may correspond to first microbial stimulations following early postnatal contacts with commensals. Nevertheless, it remains also possible that the successive waves of DC subsets may also correspond to the internal clock of the DC development.
The predominance of CD11clow PDC (B220+) and CD11chigh DN (CD4-CD8α-) DC populations in the neonatal spleen strongly affects the molecular surface pattern of the DC system compared with the adult situation. For instance, in early life, both subsets lack CD11b expression. The expression of CD11b/CD18 integrins, the opsonic CR3 receptor, is critical for the control of infection through phagocytosis and intracellular killing of microorganisms. However, neutrophils, which express CR3, are particularly abundant (from 10%-15% of total spleen cells) in early life and probably largely compensate the CR3 deficiency of the dendritic cell pool. Interestingly, the neonatal DN DC subset expresses CD205 and CD1d. The presence of CD205, rich in carbohydrate recognition domains that putatively recognize glycosidic bacterial patterns,40 indicates how bacterial uptake may take place. Expression of CD1d, a key element for presentation of glycolipidic structures,41,42 on most neonatal DCs seems to define a preferential and early link between DCs and NK T cells. It is also interesting to note that the early colonization of the neonatal spleen by the other cell types reflects an innate immune period. Indeed, NK-cell frequency is superior to T-cell frequency during the first week of life. The T-cell number remains lower than the DC number before 3 days of life, and an adultlike T-cell–DC ratio in the spleen is reached by day 7, when the different areas of the spleen are clearly organized. It can be added that terminal deoxynucleotidyl transferase is not expressed in the mouse thymus before 4 to 5 days after birth,43 and therefore the full T-cell–receptor (TCR) diversity appears later in the periphery. Altogether, this supports the view that the mouse spleen cell composition first refers as an innate host defense system in the first days of life, and the dendropoiesis reflects this phenomenon.
Targeting TLR9 with CpG ODN stimulation, we show here that neonatal DCs produced high amounts of IL-12 and IFN-γ. We previously showed that CD40 is up-regulated on neonatal DCs following microbial stimulation11 and can contribute to the amplification of IL-12 production.44 Importantly, cytokine-mediated control of IL-12 production was found identical for neonatal and adult DCs. In humans, the distribution of neonatal DC subsets is also different from adults as the cord blood contains two thirds of plasmacytoid/lymphoid CD11c- and one third myeloid CD11c+ DCs conversely to what is found in adult peripheral blood.45 However, because TLR expression patterns are variable among human DCs,23-25 differences between adultand cord blood–derived DCs may be observed or not, depending on the stimulus (in relationship with DC subset/precursor distribution in cord vs adult blood). The parallel between murine and human dendropoiesis takes into account the fact that immune maturation is much less advanced in mice at birth compared with humans, for which it takes place during fetal life (reviewed in Siegrist1 ). DCs derived from in vitro culture of cord blood mononuclear cells show a reduced capacity to produce IL-12p70 compared with those derived from monocyte taken in adult peripheral blood.46,47 This difference is due to limited IL-12p35 expression upon stimulation and is corrected by the addition of IFN-γ.
The nature of the microbial stimuli is a critical parameter as it strongly influences the cytokine-secretion pattern by DC subsets.48 Therefore, we cannot exclude that other stimuli than those we used may show differences between neonatal versus adult DC IL-12 response. Our data clearly show that there is no intrinsic defect in neonatal DCs for the production of bioactive IL-12 and that mouse neonatal spleen DCs can be even more efficient (at least after CpG-ODN stimulation) than adult DCs for IL-12p70 production. The reason for this seems to rely on the high capacity of neonatal CD8α- DCs to produce IL-12p70. More generally, the high capacity of neonatal DCs to produce IL-12, IFN-γ, and IFN-α shows that DCs can efficiently participate in natural resistance against intracellular pathogens.
Human cord blood–derived DCs were shown to have a reduced capacity for allogeneic stimulation of T cells, in terms of proliferation and IFN-γ production.47,49 These observations suggest that in humans, the neonatal Th2 bias may stem from neonatal DCs. However, the functions of human neonatal DCs may need to be also investigated with circulating cord blood DCs rather than with in vitro–generated DCs to be fully conclusive. In mice, we found that neonatal and adult spleen DCs induce comparable allogeneic CD8 T-cell stimulation and are also capable of triggering CTL responses11 and Th1 responses (C.-M.S., R.L.-M., C.L., manuscript in preparation). This is in agreement with the data reported here showing that neonatal DCs can be efficiently activated leading to the production of IL-12 (a Th1 polarization factor) and to the up-regulation of MHC and costimulatory molecules (required for efficient T-cell priming). Altogether, our data support the view that in mice there is no developmental immaturity of neonatal DCs functions.
Prepublished online as Blood First Edition Paper, March 27, 2003; DOI 10.1182/blood-2002-09-2966.
Supported by the European Commission (grant EC QLK2-CT-1999-00429), and a PhD fellowship from the French government (BGF) (C.-M.S.).
The publication costs of this article were defrayed in part by page charge payment. Therefore, and solely to indicate this fact, this article is hereby marked “advertisement” in accordance with 18 U.S.C. section 1734.
We warmly thank Anne-Marie Balazuc for FACS cell sorting.

This feature is available to Subscribers Only
Sign In or Create an Account Close Modal