Abstract
In order to gain insights in the true molecular mechanisms involved in cell fate decisions, it is important to study the molecular details of gene activation where such decisions occur, which is at the level of the chromatin structure of individual genes. In the study presented here we addressed this issue and examined the dynamic development of an active chromatin structure at the chicken lysozyme locus during the differentiation of primary myeloid cells from transgenic mouse bone marrow. Using in vivo footprinting we found that stable enhancer complex assembly and high-level gene expression are late events in cell differentiation. However, even before the onset of gene expression and stable transcription factor binding, specific chromatin alterations are observed. This includes changes in DNA topology and the selective demethylation of CpG dinucleotides located in the cores of critical transcription factor binding sites, but not in flanking DNA. These results firmly support the idea that epigenetic programs guiding blood cell differentiation are engraved into the chromatin of lineage-specific genes and that such chromatin changes are implemented before cell lineage specification. (Blood. 2004;103:2950-2955)
Introduction
Hematopoietic cells arise from pluripotent hematopoietic stem cells (HSCs) in the bone marrow and develop via different types of precursor cells, which become progressively committed to the different branches of the blood cell system. Such specialization is based on cell fate decisions ultimately leading to the coordinated and regulated expression of cell-type– and cell-stage–specific genetic programs. However, a number of experiments have indicated that the presence of specific mRNA molecules is only the end point of a cascade of differentiation decisions. A vast body of evidence from genetic studies demonstrates that genes encoding for chromatin components or chromatin modification factors play essential roles in all phases of the development of multicellular organisms. At individual genes these epigenetic regulatory proteins are recruited by sequence-specific transcription factors and influence the transcriptional status and the accessibility to the transcription machinery by altering chromatin structure and the spectrum of biochemical tags attached to individual chromatin components.1,2 To address these processes at the molecular level and to identify the order of events taking place during the developmentally controlled activation of genes, we are studying the regulation of chromatin structure of genes expressed in the myeloid lineage of the hematopoietic system. One of them is the chicken lysozyme locus (clys). clys expression in myeloid cells is controlled by at least 5 cis-regulatory elements. Three enhancers situated 6.1 kb, 3.9 kb, and 2.7 kb upstream of the transcription start site, a silencer element at -2.4 kb, and a complex promoter have been identified.3 All active cis-regulatory elements colocalize with DNaseI hypersensitive sites (DHSs) in chromatin4-6 (Figure 1). Experiments in transgenic mice have shown that transcription of the lysozyme gene is already active in granulocyte-macrophage precursors (CFU-GMs).7 Lysozyme expression is strongly responsive to inflammatory stimuli such as bacterial lipopolysaccharide (LPS) which up-regulates lysozyme mRNA expression up to 20-fold from a low basal level.8
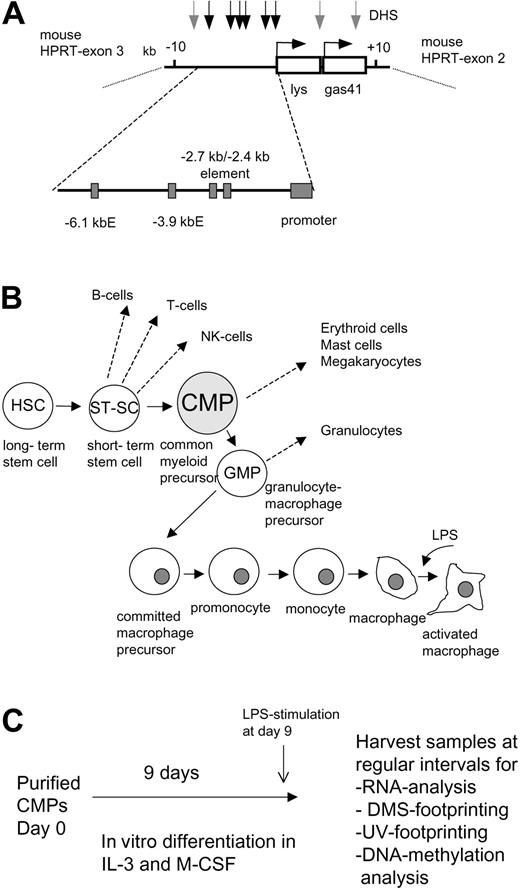
Experimental outline. (A) Map of the chicken lysozyme locus (+10 kb to -10 kb relative to the transcription start) and its position in the mouse X-chromosome. The clys and the gas41 gene in the transgene are indicated as white boxes. The direction of transcription is depicted as a horizontal arrow. DNaseI hypersensitive sites (DHS) observed in macrophages are indicated as vertical arrows, with black arrows indicating the position of cis-regulatory elements. Cis-elements are depicted as gray boxes, with E standing for enhancer. (B) Schematic outline of macrophage differentiation. (C) Experimental strategy.
Experimental outline. (A) Map of the chicken lysozyme locus (+10 kb to -10 kb relative to the transcription start) and its position in the mouse X-chromosome. The clys and the gas41 gene in the transgene are indicated as white boxes. The direction of transcription is depicted as a horizontal arrow. DNaseI hypersensitive sites (DHS) observed in macrophages are indicated as vertical arrows, with black arrows indicating the position of cis-regulatory elements. Cis-elements are depicted as gray boxes, with E standing for enhancer. (B) Schematic outline of macrophage differentiation. (C) Experimental strategy.
Using retrovirally transformed chicken cell lines representing defined stages of macrophage differentiation,9 we have recently presented evidence that chromatin reorganization of clys starts early in development prior to the onset of gene expression. Using UV-photofootprinting, which identifies changes in DNA topology caused by the interaction with proteins,10 we detected the formation of a chromatin fine structure characteristic for lysozyme-expressing macrophages in multipotent myeloid precursor cell lines. This was independent of the stable binding of end-stage transcription factors and actual gene expression,11 indicating that already early in hematopoietic development, lineage-specific chromatin remodelling events take place. Later chromatin immunoprecipitation experiments indeed showed that in the same multipotent precursor cell lines lysozyme chromatin is partially accessible, as we found evidence for a transient interaction of transcription factors with lysozyme chromatin.12
However, all studies with precursor cell lines representing fixed differentiation stages have significant limitations. In addition to their transformed state such cells may have accumulated epigenetic alterations in culture. Furthermore, they do not permit the examination of dynamic alterations at the chromatin of specific genes during the process of their transcriptional activation in development. To be able to study these events in primary cells we used gene targeting to generate mice carrying a single copy of the chicken lysozyme locus inserted into the hypoxanthine-phosphoribosyl-transferase (HPRT)–locus13 and established an in vitro differentiation system for macrophage maturation based on purified multipotent precursor cells from transgenic mouse bone marrow.14 In the study presented here we used these models to assay the dynamics of DNA demethylation, chromatin fine structure alterations, and transcription factor occupancy at clys cis-regulatory elements. Our results show that a high level of gene expression and complete enhancer complex assembly are only found at late differentiation stages. However, this is preceded by chromatin alterations that are complete before the activation of gene expression. In addition, specific methylated CpG dinucleotides at cis-regulatory elements are demethylated with different kinetics. These results firmly support the idea that a lineage-specific chromatin structure is already in place prior to the onset of gene expression and before cell lineage specification.
Materials and methods
Precursor cell purification and cell culture
Myeloid precursor cells from the bone marrow of chicken lysozyme transgenic mice were purified by cell sorting and cultured exactly as previously described.14 Embryonic stem (ES) cells carrying the chicken lysozyme knock-in construct inserted into the mouse HPRT locus were grown on Sto-feeder cells as described.15 B cells were sorted from the spleen of chicken lysozyme transgenic mice after myeloid lineage depletion and staining with an antibody against CD19. Freshly isolated embryonic fibroblasts from transgenic mice were prepared as described.16
Real-time PCR
Total RNA was prepared using Trizol (Invitrogen, Hasley, United Kingdom) according to the manufacturer's instructions, and genomic DNA was removed by DNaseI treatment. First-strand cDNA synthesis from RNA samples was carried out using oligo (dT)15 primer and Moloney murine leukemia virus reverse transcriptase (Invitrogen) in a reaction volume of 20 μL. cDNA was amplified with real-time quantitative polymerase chain reaction (PCR; ABI Prism 7700 sequence detection system; Perkin Elmer, Shelton, CT) with SYBR Green using a real-time PCR kit (Applied Biosystems, Weiterstadt, Germany). Glyceraldehyde-3-phosphate dehydrogenase (GAPDH)–specific primers were used for internal control PCR and all gene-specific signals were normalized to this value. Primer sequences were as follows: mouse GAPDH (GAPDH): forward 5′-ACCTGCCAAGTATGATGACATCA and reverse 5′-GGTCCTCAGTGTAGCCCAAGAT; chicken lysozyme (c-lys): forward 5′-CGACTACGGAATCCTACAGATCAA and reverse 5′-CTTAAGCACGGGATGTTGCA; mouse c-fms: forward 5′-CCAGATCTCCTGCGTTGATTTC and reverse 5′-CCACAGACACCTCCTGCAAGA.
In vivo footprinting analysis
In vivo dimethyl sulphate (DMS) and UV footprinting with the different cell types and during in vitro differentiation were performed exactly as described.14 Alterations in G(N7) DMS reactivity were visualized by ligation mediated (LM)–PCR, and alterations in UV dimer formation were examined by terminal transferase-dependent (TD)–PCR. In both cases the following primers were used: promoter (upper strand): P1: 5′-GACCTCATGTTGCCAGTGTCG; P2: 5′-CAGTGTCGTACACACAGCGGG; P3: 5′-ACACACAGCGGGACTGCAAGC; -3.9 enhancer (upper strand): D376: 5′-GAGCTACACAACCCTTCAGC; D376A: 5′-CAGCTGTCTCTCCCTTGATGG; D376B: 5′-GATGGCAGCCTGCCCCACAAG; -6.1 enhancer (lower strand): U6.1E1: 5′-TACCGAGGAACAAAGGAAGGCT; U6.1E2: 5′-TTTAGAGAACTGGCAAGCTGT; U6.1E3: 5′-GAACTGGCAAGCTGTCAAAAAC.
LM-PCR–generated bands from radioactive sequencing gels were quantified on a Molecular Imager FX (Bio-Rad, Hercules, CA). TD-PCR samples were run on a LI-COR sequencer (Li-Cor, Lincoln, NE), and quantification of band intensity on digitized data was done as described.11
DNA modification with bisulfite and PCR amplification
Bisulfite treatment for DNA methylation analysis was performed exactly as published previously.17 Primers were designed to be complementary to the upper and lower strands after modification. Primer sequences are available on request. PCR products were sequenced and signals corresponding to T and unmodified C were analyzed and quantified using a CEQ 8000 sequencer (Beckman Coulter, Hialeah, FL).
Results
The clys locus harbors 2 differentially expressed gene loci: clys and cgas41, both of which reside in the same domain of general DNaseI sensitivity.18,19 Figure 1A depicts the position of the transgenic lysozyme locus within the X-linked mouse HPRT locus.13 Macrophages generated from the bone marrow of male and female transgenic mice faithfully expressed the gene in a myeloid-specific and lipopolysaccharide (LPS)–inducible fashion and in male mice displayed the same pattern of transcription factor site occupancy as the endogenous gene in chicken cells.11-13
We previously demonstrated clys expression in mouse CFU-GM cells,7 but had no information about earlier myeloid developmental stages. To address this issue we studied dynamic changes of clys chromatin structure during myeloid precursor maturation in vitro.14 The experimental strategy is outlined in Figure 1B-C. Following purification of common myeloid progenitor cells (CMPs)20 from the bone marrow of male transgenic mice, cells were cultured in differentiation medium for up to 9 days, followed by an overnight stimulation with LPS. Cells cultured this way progressed through the different macrophage differentiation stages outlined in Figure 1B as a homogenous population displaying distinct and dynamic alterations of morphology, surface marker, and marker gene expression.14 Purified cells at day 0 were small blast cells, expressed a high level of c-kit, did not express detectable macrophage–colony-stimulating factor (M-CSF) receptor on their surface and expressed a high level of the CD31 (PECAM-1) surface marker, which is recognized by the ER-MP12 antibody.21 In differentiation medium, these cells immediately started to proliferate and at day 2 of differentiation, developed into nonadherent CFU-GMs that started to express a high level of M-CSF receptor. At day 4, cells differentiated into monocytic cells, had lost the expression of CD31, and started to down-regulate M-CSF receptor expression. From day 7 onward, cells displayed macrophage morphology and had lost the expression of monocytic markers. Aliquots of differentiating cells were taken at regular intervals to measure mRNA expression, transcription factor occupancy, DNA topology, and DNA methylation.
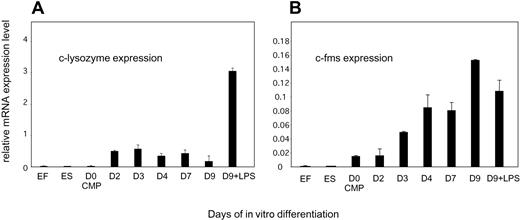
Figure 2A depicts the analysis of clys mRNA expression during in vitro differentiation as measured by real-time PCR. Mouse ES cells carrying the clys knock-in construct and transgenic embryonic fibroblasts served as lysozyme nonexpressing negative control cells. As an additional control, we measured expression of the endogenous c-fms gene, which encodes the M-CSF receptor. We have previously shown that this gene is already active in CMPs and its promoter is already occupied by transcription factors.14 This expression pattern was reproduced with the precursor cells purified from chicken lysozyme transgenic mice (Figure 2B). The pattern of clys mRNA expression followed an entirely different time course (Figure 2A). No or little clys mRNA could be detected in CMPs. Significant expression was first detected at day 2 of differentiation at the CFU-GM stage. The same result was obtained with the endogenous mouse lysozyme gene7,14 (data not shown). Between day 2 and day 3 of differentiation cells still proliferated as nonadherent blast cells; thereafter they became adherent, but clys mRNA levels did not change. A high level of clys mRNA expression could only be detected after LPS stimulation at day 9 of differentiation.
Expression of the chicken lysozyme transgene and the endogenous c-fms gene during macrophage differentiation. Total RNA was prepared from cells at the indicated days of differentiation and relative mRNA levels were measured by real-time PCR with primers specific for GAPDH as an internal control and clys- and c-fms–specific primers. Transgenic mouse ES cells and embryonic fibroblasts served as a negative control. (A) Chicken lysozyme transgene. (B) Endogenous c-fms gene. The values represent the means and standard deviations of 5 independent experiments.
Expression of the chicken lysozyme transgene and the endogenous c-fms gene during macrophage differentiation. Total RNA was prepared from cells at the indicated days of differentiation and relative mRNA levels were measured by real-time PCR with primers specific for GAPDH as an internal control and clys- and c-fms–specific primers. Transgenic mouse ES cells and embryonic fibroblasts served as a negative control. (A) Chicken lysozyme transgene. (B) Endogenous c-fms gene. The values represent the means and standard deviations of 5 independent experiments.
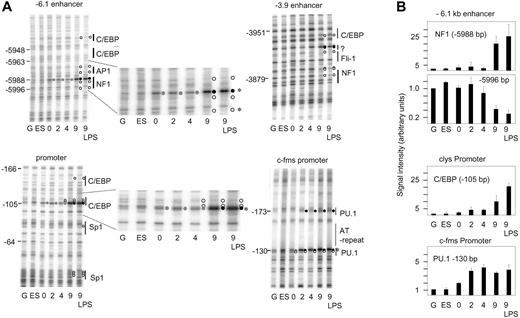
In order to determine at which stage of in vitro differentiation stable transcription factor complexes were formed at lysozyme cis-elements, we measured transcription factor occupancy at the -6.1 kb enhancer, the -3.9 kb enhancer, and the promoter by in vivo DMS footprinting (Figure 3A) and quantified alterations in DMS reactivity at G(N7) residues (Figure 3B). The identity of transcription factors binding to these elements had been previously confirmed by chromatin immunoprecipitation assays12 and we have shown that the 3 cis-elements are necessary and sufficient to activate clys expression at the correct developmental stage in transgenic mice.7 For comparison, we also measured transcription factor occupancy at the c-fms promoter. DMS-treated naked DNA and mouse ES cells carrying the clys knock-in construct served as controls.
Stable transcription factor complex formation and high-level clys gene expression are late events in macrophage differentiation. (A) In vivo DMS footprinting experiment analyzing transcription factor occupancy during in vitro differentiation (day 0 to day 9 and after LPS stimulation of day-9 cells) at clyscis-regulatory elements and the c-fms promoter as indicated. G indicates DMS-treated naked genomic DNA; ES, DNA prepared from lysozyme nonexpressing transgenic mouse ES cells. The nature and the position of transcription factor binding sites are indicated. Protection from methylation at G(N7) is indicated as a white circle, enhancement of DMS reactivity is indicated as a black circle, and weak enhancement is indicated as a gray circle. (B) Quantification of signals from selected bands (indicated by asterisks) of the gels depicted in panel A. The numbers represent the mean values and standard deviations of quantifications from 2 independent experiments and 2 separate gels, respectively.
Stable transcription factor complex formation and high-level clys gene expression are late events in macrophage differentiation. (A) In vivo DMS footprinting experiment analyzing transcription factor occupancy during in vitro differentiation (day 0 to day 9 and after LPS stimulation of day-9 cells) at clyscis-regulatory elements and the c-fms promoter as indicated. G indicates DMS-treated naked genomic DNA; ES, DNA prepared from lysozyme nonexpressing transgenic mouse ES cells. The nature and the position of transcription factor binding sites are indicated. Protection from methylation at G(N7) is indicated as a white circle, enhancement of DMS reactivity is indicated as a black circle, and weak enhancement is indicated as a gray circle. (B) Quantification of signals from selected bands (indicated by asterisks) of the gels depicted in panel A. The numbers represent the mean values and standard deviations of quantifications from 2 independent experiments and 2 separate gels, respectively.
No alterations of DMS reactivity as compared with naked DNA were observed with ES cells (Figure 3A) and transgenic embryonic fibroblasts (data not shown). At the c-fms promoter (Figure 3A, right panel) the central PU.1 site was fully occupied even when c-fms expression levels were low (Figure 3A-B) as measured by a DMS hyperreactivity of G -130 bp and a protection of the downstream guanine residue from DMS modification. Again, clys behaved differently (Figure 3A-B). Quantification of relevant bands showed that complete transcription factor complex assembly as indicated by full protection of relevant G(N7) contacts from methylation was only observed at day 9 of in vitro differentiation (see, for example, the G residues at -5996 bp [the quantification of this band is depicted in Figure 3B]). For the examination of transcription factor occupancy at early time-points of in vitro differentiation, the quantification of signals from strongly hyperreactive G(N7) residues at the central nuclear factor 1 (NF1) site at the -6.1 kb enhancer (-5988 bp) and the -105 bp CAAT-enhancer binding protein beta (1C/EBPβ) site at the promoter proved to be more conclusive (Figure 3B). In both cases, we saw a slight but reproducible increase in DMS hyperreactivity as early as day 0 (Figure 3A, enlarged picture), which further increased parallel to the onset of gene expression at day 2. However, signals seen between day 2 and day 4 differentiation stayed low. Very little difference in transcription factor occupancy was seen between nonstimulated and LPS-stimulated cells, although mRNA expression levels varied dramatically. In the mouse, the only exception was the C/EBPβ site at -105 bp, where DMS reactivity was somewhat increased after LPS treatment and a downstream Sp1 site, which was only occupied in LPS-treated cells.
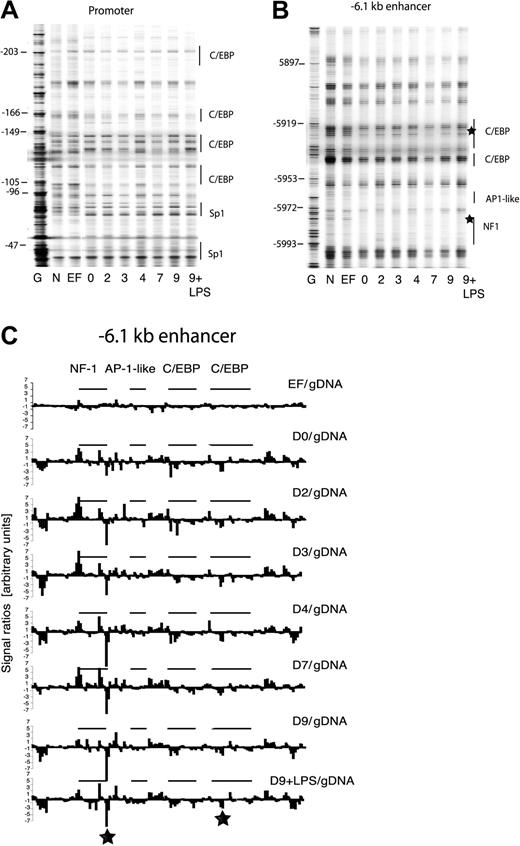
To further examine this developmental model, we examined chromatin structure at clys cis-regulatory elements at different differentiation stages by UV photofootprinting and TD-PCR.10 UV footprinting predominately detects UV dimers at pyrimidine sites and UV-dimer formation is modulated by chromatin-mediated alterations of DNA topology.. Here we used UV-treated naked DNA and freshly isolated embryonic fibroblasts (EFs) from the transgenic mice as a control. Figure 4A-B depicts 2 experiments examining the frequency of UV-dimer formation at the clys promoter and the -6.1 kb enhancer, respectively. It is apparent just by visual inspection that there is little change between day-0 and day-9 samples, indicating little change in chromatin fine structure as in vitro differentiation proceeds. The only clear difference is between naked DNA and control cells (compare lanes N and EF with lane 0, respectively) whereby all control cells (including ES cells, data not shown) generated patterns very similar to naked DNA. This was substantiated by quantification of individual bands from the gel depicted in Figure 4B and plotting for each nucleotide position the ratio between band intensity observed with the different cell types and naked DNA (Figure 4C). The main difference clearly is between embryonic fibroblasts (lane M) and the D0 to D9 stages. In summary, a specific DNA reactivity pattern, which is indicative of a distinct chromatin structure, is already established in precursor cells.
Chromatin fine structure at the chicken lysozyme locus is reorganized prior to the onset of gene expression and the formation of stable transcription factor complexes. (A) UV photofootprinting experiment examining alterations in UV-dimer formation frequency with the clys promoter. The gels shown are representative of 2 independent experiments and 2 separate gels, respectively. G indicates DMS-treated naked genomic DNA; N, UV-treated naked genomic DNA; and EF, freshly prepared embryonic fibroblasts from transgenic mice. (B) UV photofootprinting of the -6.1 kb enhancer. The gels shown are representative of 2 independent experiments and 2 separate amplifications, respectively. (C) Quantification of bands from the gel depicted in panel B. The band intensity at each nucleotide position was divided by the band intensity of naked DNA and the ratio plotted as described previously.11 The nature and the position of transcription factor binding sites are indicated. The asterisk marks the position of extensive alterations in UV-dimer formation in differentiating cells as compared to naked DNA and EFs.
Chromatin fine structure at the chicken lysozyme locus is reorganized prior to the onset of gene expression and the formation of stable transcription factor complexes. (A) UV photofootprinting experiment examining alterations in UV-dimer formation frequency with the clys promoter. The gels shown are representative of 2 independent experiments and 2 separate gels, respectively. G indicates DMS-treated naked genomic DNA; N, UV-treated naked genomic DNA; and EF, freshly prepared embryonic fibroblasts from transgenic mice. (B) UV photofootprinting of the -6.1 kb enhancer. The gels shown are representative of 2 independent experiments and 2 separate amplifications, respectively. (C) Quantification of bands from the gel depicted in panel B. The band intensity at each nucleotide position was divided by the band intensity of naked DNA and the ratio plotted as described previously.11 The nature and the position of transcription factor binding sites are indicated. The asterisk marks the position of extensive alterations in UV-dimer formation in differentiating cells as compared to naked DNA and EFs.
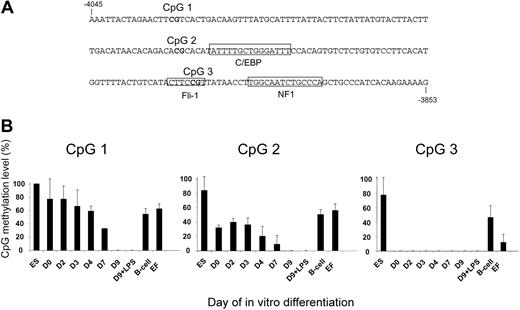
Methylation of CpGs is vital for the maintenance of silent chromatin states via the recruitment of repressive chromatin modification complexes to methylated DNA.22 Although demethylation alone is not sufficient to activate gene expression,23 many transcription factors are unable to bind to their recognition sequences if these contain methylated CpGs. Consequently, the activation of a gene in development requires the removal of such methyl groups. In order to obtain information about the time-course of this process we measured the extent of CpG methylation by quantitative bisulphite sequencing of DNA isolated from in vitro–differentiated cells within the 3 different CpGs present at the -3.9 kb enhancer (Figure 5). CpG1 is located upstream of any known transcription factor binding site in the -3.9 kb enhancer, CpG2 is directly upstream of a functional in vivo C/EBPβ site, and CpG3 is part of a functional in vivo binding site for the ets-transcription factor Fli-1 (Figure 5A).12 Transgenic ES cells served as control. However, as these ES cells had been in culture for some time and could have accumulated aberrant methylation patterns, we also assayed purified B cells and freshly isolated embryonic fibroblasts from transgenic mice.
CpGs at the -3.9 kb enhancer are demethylated with different kinetics during in vitro differentiation. Genomic DNA prepared from ES cells, freshly prepared mouse embryonic fibroblasts (EFs), and purified B cells from transgenic mice as well as from cells undergoing differentiation, was subjected to quantitative bisulfite sequencing as outlined in “Materials and methods.” (A) Sequence of the -3.9 kb enhancer and position of CpGs. (B) CpG methylation level in the different cells as indicated.
CpGs at the -3.9 kb enhancer are demethylated with different kinetics during in vitro differentiation. Genomic DNA prepared from ES cells, freshly prepared mouse embryonic fibroblasts (EFs), and purified B cells from transgenic mice as well as from cells undergoing differentiation, was subjected to quantitative bisulfite sequencing as outlined in “Materials and methods.” (A) Sequence of the -3.9 kb enhancer and position of CpGs. (B) CpG methylation level in the different cells as indicated.
Figure 5B shows that the 3 CpG sites were demethylated with significantly different kinetics. CpG1 was as highly methylated as in control cells up to day 4, and was only fully demethylated at day 9 of in vitro differentiation. CpG2 was already partially demethylated at day 0 and became demethylated from day 4 onward. In contrast to the control cells, the CpG at the Fli-1 binding site (CpG3) was not methylated at all in any of the myeloid cell types tested. A similar result was observed with a CpG located within the distal Sp1 binding site in the promoter (data not shown). Control experiments examining CpG methylation at the alpha-fetoprotein gene, which is only active in fetal liver cells, showed that this gene was fully methylated in these cells at day 9 (data not shown). Taken together, our experiments show that although there is no stable enhancer and promoter complex formation in CMPs and no or little mRNA is expressed, chromatin is already fully reorganized and specific CpGs are already completely demethylated.
Discussion
Although c-fms and clys are both expressed in macrophages, they belong to 2 different categories of hematopoietic genes. A low level of c-fms mRNA expression is detected already in HSCs,24 which is selectively up-regulated in macrophage cells14 and expression is switched off in nonmacrophage cells. In contrast, clys mRNA expression was not detected before the CFU-GM stage. In addition, although already detectable in CFU-GMs, clys mRNA expression remained low and was only maximal in LPS-stimulated macrophage cells. The same was observed at the level of transcription factor occupancy. Few or no transcription factor complexes were formed at clys between day 2 and day 4 of in vitro differentiation. These results could be interpreted in 2 ways. It could be possible that only a few mature cells within the differentiating population have stable transcription factors assembled on cis-regulatory elements or, alternatively, that transcription factor complex formation and the assembly of the transcription machinery are dynamic and are only stabilized in all cells in mature, adherent macrophages. We favor the latter explanation, as cells synchronously differentiate and proliferate as a homogenous population displaying coordinated changes in surface marker expression and significant numbers of adherent cells are only seen after day 4 of differentiation.14 This notion is also supported by our observation that full demethylation of CpGs was only observed at late differentiation stages. In addition, the c-fms intronic enhancer, in contrast to the clys cis-elements, displays a dynamic assembly and disassembly of transcription factor complexes during in vivo differentiation, with assembly being maximal around day 4 of macrophage maturation14 (and data not shown).
Based on the finding that the central CpG within the core of important transcription factor binding sites (Fli-1 and Sp1) were demethylated very early in development while methyl groups at surrounding CpGs disappeared with much slower kinetics, we infer that the transcription factors binding to these sites could be involved in this process. At first sight this was puzzling, as we did not see stable binding of transcription factors in our in vivo footprinting experiments. However, chromatin immunoprecipitation experiments with precursor cell lines showed transient binding of transcription factors to clys chromatin.12 Experiments performed by others have observed that the interaction of high-affinity DNA binding proteins with DNA can lead to the progressive demethylation of CpG sequences,25 possibly by interfering with de novo methylation during replication. Although binding of Sp1 is not inhibited by cytosine methylation,26 it has been noted that the presence of functional binding sites for this transcription factor is required for the prevention of CpG island methylation.27 A possible important role of DNA demethylation for clys activation is suggested by our previous experiments. These demonstrated that the Fli-1 binding site is essential for the activity of the -3.9 kb enhancer,28 that it interacts with the -3.9 kb enhancer element in vivo,12 and most important, that binding of Fli-1 is completely inhibited when the central CpG is methylated12 (and data not shown).
The studies described here put a mechanistic foundation under a number of observations demonstrating that pluripotent tissue-specific precursor cells show lineage-promiscuous low-level gene expression24,29-31 and add to this notion that epigenetic programs are engraved into the chromatin of lineage-specific genes before cell lineage specification and the onset of detectable gene expression. Our results presented here and published previously11,12 point to a potential mechanism for how this could occur and point to clear experimental avenues to follow. We hypothesize that gradual changes in the expression of sequence-specific transcription factors lead to a transient association of such transcription factors with their recognition sequence, possibly after DNA synthesis. The fact that the balance and the level of transcription factors can influence cell fate decisions in precursor cells prior to the onset of expression of many lineage-specific genes agrees with this idea (for a comprehensive review of such experiments see Zhu and Emerson32 and references therein). These factors could recruit chromatin modification complexes and prevent maintenance CpG methylation or induce active demethylation, and generate a chromatin structure, which sets the stage for the formation of stable enhancer complexes that drive transcription. The nature of the differentiation-specific events that trigger the formation of such complexes in the lysozyme locus is not yet clear. With transformed cell lines we observed distinct locus-wide histone modification events and recruitment of chromatin modification activities, but only after stable transcription factor complex formation in mature macrophages.12 However, stable recruitment of transcription factors to most clys cis-regulatory elements is not by itself sufficient to support high-level transcription; this is only seen in LPS-treated cells.
In summary, gene locus activation in development is a process that begins at the level of chromatin many cell generations before lineage specification. The developmental stage at which mRNA synthesis occurs may be regulated by external signals and can be different for every gene.
Supported by grants from the Wellcome Trust, the Biochemical Biotechnological Sciences Research Council (BBSRC), the Leukaemia Research Fund, and the City of Hope Medical Center.
H.T. and S.M. contributed equally to this study.
The publication costs of this article were defrayed in part by page charge payment. Therefore, and solely to indicate this fact, this article is hereby marked “advertisement” in accordance with 18 U.S.C. section 1734.
Prepublished online as Blood First Edition Paper, December 18, 2003; DOI 10.1182/blood-2003-09-3323.
The authors thank E. Straszinsky for help with cell sorting and Peter Cockerill for critical comments on the manuscript.

This feature is available to Subscribers Only
Sign In or Create an Account Close Modal