Abstract
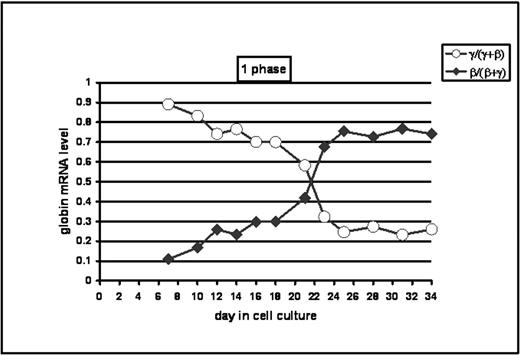
The design and evaluation of therapies for sickle cell disease (SCD) rely on our understanding of hemoglobin accumulation during erythropoiesis and sequential globin gene expression (ε → Gγ → Aγ → δ → β) during development. To gain insights into globin gene switching, we completed time course micorarray analyses of erythroid progenitors to identify trans-factors involved in γ gene activation. Studies were completed to map the pattern of γ and β globin gene expression in progenitors grown from normal peripheral blood mononuclear cells. We compared cells grown in a 2-phase (phase 1, d0-6: SCF, IL-3, IL-6, and GM-CSF and phase 2, d7-25: SCF and EPO) vs. 1-phase (d0-34: SCF, IL-3, and EPO) liquid culture system. From day 0 to 34 in either system cell viability remained >99%. Total RNA was isolated using Trizol and column cleanup (Qiagen). Globin mRNA levels were measured at 2–3 day intervals by quantitative PCR (qPCR). In the 2-phase system γ-globin mRNA>β-globin mRNA up to d14, 4 days of approximately equal expression then β mRNA > γ mRNA by d20. By contrast, in 1-phase studies there was a rapid switch around d20(see graph). We speculate that this difference may be due to the early addition of EPO on d0 therefore we continued our detailed analysis in this system. To confirm that our in vitro system recapitulates in vivo gene expression patterns, we completed studies to ascertain Gγ - vs. Aγ globin mRNA levels. The normalized Gγ:Aγ ratio decreased from ~3:1 on d7 to ~1:1 by d34; These findings were confirmed using two sets of Gγ and Aγ globin primers. We concluded that the 1-phase system recapitulated normal γ/β globin switching and that gene profiling studies to identify the trans-factor involved in switching mechanisms were feasible. We used Discover oligo chips (ArrayIt, Sunnyvale, CA) containing 380 human genes selected from 30 major functional groups including hematopoiesis. To aide interpretation of chip data, cell populations were rated morphologically using Giemsa stained cytospin preps. From d16 on we observed an increase in late erythroid progenitors (normoblasts) from 1% to 71% by d31. After verifying RNA quality by gel inspection of ribosomal molecules, we prepared Cy3 and Cy5 probes for early and late time-point RNA samples respectively. Chip analysis was performed at several time points but d0/21, d7/21, and d21/28 were most informative. Based on Axon GenePixPro 6.0 and Acuity 4.0 software analysis we found the following genes with >1.5-fold change in expression profile (shown as down-regulated/up-regulated genes): d0/21: 33/73, d7/21: 13/25, and d21/28:35/26. Principal component analysis (PCA), hierarchical clusters and self organizing maps were constructed. Gene profiles were correlated with the γ/β switching curve using d7 (γ >β), d21 (γ ~ β), and d28 (γ <β) data. Hematopoietic dataset analysis at d21 revealed 4 candidate γ-globin gene activators including v-myb, upsteam binding transfactor -RNApol1 and 2 zinc finger proteins. Analysis of a d28 dataset revealed 12 proteins involved in γ-globin gene silencing including IL-3, SCF, MAPKKK3, v-raf-1, ATF-2, and glucocorticoid receptor DNA binding factor 1 among others. Gene expression profiles will be validated using qPCR and promising candidates will be tested by forced expression in transient and stable reporter systems.
Author notes
Corresponding author


This feature is available to Subscribers Only
Sign In or Create an Account Close Modal