Abstract
We evaluated the ability of 2 human mAbs directed against TRAILR1 (HGS-ETR1) and TRAILR2 (HGS-ETR2) to kill human myeloma cells. HGS-ETR1 and HGS-ETR2 mAbs killed 15 and 9 human myeloma cell lines (HMCLs; n = 22), respectively. IL-6, the major survival and growth factor for these HMCLs, did not prevent their killing. Killing induced by either HGS-ETR1 or HGS-ETR2 was correlated with the cleavage of Mcl-1L, a major molecule for myeloma survival. Mcl-1L cleavage and anti-TRAILR HMCL killing were dependent on caspase activation. Kinetic studies showed that Mcl-1L cleavage occurred very early (less than 1 hour) and became drastic once caspase 3 was activated. Our data showed that both the extrinsic (caspase 8, Bid) and the intrinsic (caspase 9) pathways are activated by anti–TRAIL mAb. Finally, we showed that the HGS-ETR1 and, to a lesser extent, the HGS-ETR2 mAbs were able to induce the killing of primary myeloma cells. Of note, HGS-ETR1 mAb was able to induce the death of medullary and extramedullary myeloma cells collected from patients at relapse. Taken together, our data clearly encourage clinical trials of anti–TRAILR1 mAb in multiple myeloma, especially for patients whose disease is in relapse, at the time of drug resistance.
Introduction
Tumor necrosis factor–related apoptosis-inducing ligand (TRAIL), a member of the TNF ligand superfamily, induces apoptosis through the activation of TRAIL-R1 (DR4) and TRAIL-R2 (DR5) death signaling receptors.1,2 TRAIL is a very attractive death ligand in targeted cancer therapy. Indeed, TRAIL induces the death of cancer cells but spares normal cells.2-4 TRAIL binding to its receptors induces the formation of a death-inducing signaling complex (DISC) that includes death receptors, adaptor proteins, and procaspase 8.5,6 Activation of procaspase 8 is mediated through an autocatalytic mechanism. Activated caspase 8 cleaves procaspase 3 and thereby activates the extrinsic pathway. On the other hand, caspase 8 cleaves Bid. Truncated Bid (t-Bid) activates bax and bak and, in turn, the intrinsic mitochondrial pathway. By inducing cell death through the extrinsic and intrinsic intracellular death signaling pathways, TRAIL could overcome drug resistance in tumor cells. Recently, Mcl-1L has been shown to be a key molecule of the TRAIL response in Jurkat leukemia T cells.7 Indeed, Weng et al7 reported that besides Bid activation by caspase 8, TRAIL-induced cell death required Mcl-1L cleavage at Asp-127 by caspase 3. Mcl-1L (350 aa) is a prosurvival protein of the Bcl-2 family.8,9 However, on the induction of apoptosis, Mcl-1L is cleaved by caspase 3 after Asp127 and Asp157.7,10 Both cleaved products, C1 128-350 aa and C2 158-350 aa, are proapoptotic when transfected into NIH3T3 or HeLa cells.7,10 Moreover, Weng et al7 showed that the Mcl-1 C2 158-350aa cleaved product directly interacts with t-Bid to promote mitochondrial dysfunction.
Multiple myeloma (MM) is a fatal plasma cell (PC) malignancy characterized by an accumulation of malignant PCs within the bone marrow.11,12 We extensively demonstrated that Mcl-1 is a key molecule controlling myeloma survival.13-17 Although myeloma cells are fas resistant, it was shown that they are TRAIL sensitive.18,19 The sensitivity to TRAIL was reported to be dependent on the ratio of c-FLIP and caspase 8, but this remains controversial.19,20 Moreover, these studies were performed with a small panel of representative human myeloma cell lines (HMCLs), and it remains unclear whether myeloma cells are widely sensitive to TRAILR triggering and whether TRAILR triggering induces Mcl-1L cleavage within myeloma cells.
Here, we investigated the sensitivity of 22 HMCLs to 2 fully human antibodies directed against TRAIL-R1 (HGS-ETR1) or TRAIL-R2 (HGS-ETR2) by monitoring apoptosis induction through caspase cascade and Mcl-1L cleavage.
Materials and methods
Human myeloma cell lines
HMCLs BCN, MDN, NAN-1, NAN-3, NAN-4, NAN-5, SBN, XG1, XG2, XG5, XG6, and XG7 were generated in our laboratory from myeloma samples14,21 (R.B., Gaetan Jego, Nelly Robillard, Sophie Basille-Nion, J.-L.H., P.M., M.A., and C.P.-D., manuscript submitted). NCI-H929, L363, LP1, and U266 were purchased from DSMZ (Braunschweig, Germany). JJN3 and ANBL-6 were kindly provided by Prof B. Van Camp (Brussels, Belgium) and Dr D. Jelinek (Rochester, MN), respectively, and KMS12BM, KMS12PE, and KMS18 were kindly provided by Dr T. Ohtsuki (Kawasaki Medical School, Kurashiki, Japan). HMCLs were cultured in RPMI 1640 containing 5% FCS. ANBL-6, BCN, MDN, NAN-1, NAN-3, NAN-4, NAN-5, SBN, XG1, XG2, XG5, XG6, and XG7 were cultured in 3 ng/mL IL-6 (Novartis Pharmaceuticals, Basel, Switzerland).
Reagents and antibodies
Fully human HGS-ETR1 and HGS-ETR2 mAbs were provided by Human Genome Sciences (HGS; Rockville, MD). PE-Apo2.7 and PE-IgG1 mAbs were from BD Biosciences (Le Pont de Claix, France), and PE-DR4 and PE-DR5 were from eBioscience (Clinisciences, Montrouge, France). Antibodies against caspase 3 (mouse monoclonal E-8), caspase 9 (F7 mouse monoclonal), and Mcl-1 (S19; rabbit polyclonal) were from Santa Cruz Biotechnology (Tebu-Bio, Le Perray en Yvelines, France), and anti–Bid (goat polyclonal) antibody was from R&D (Lille, France). mAbs against caspase 81C12 and actin (C4) were from Cell Signaling Technology (Beverly, MA) and Chemicon International (Hampshire, United Kingdom), respectively. Caspase inhibitors z-VAD-fmk and z-IETD-fmk were respectively from Santa Cruz Biotechnology and Calbiochem.
Cell death assays
HGS-ETR1– and HGS-ETR2–induced cell death in myeloma cells was evaluated with a FACSCalibur (BD Biosciences) by both APO2.7 staining22 and combined analysis of altered cellular morphology (lower FSC and higher SSC).
Western blotting
Myeloma cells (5 million/10 mL) were treated with or without 6 μg/mL HGS-ETR1 or HGS-ETR2 in the presence or absence of IL-6, as indicated in the figure legends. Cells were pelleted and resuspended in lysis buffer (10 mM Tris-HCl [pH 7.6], 150 mM NaCl, 5 mM EDTA, 1 mM PMSF, 2 μg/mL aprotinin,1% Triton X-100). After 40 minutes on ice, lysates were cleared by centrifugation at 10 000g for 30 minutes at 4°C. Protein concentration was measured using bicinchoninic acid (BCA Protein assay; Pierce, Rockford, IL). Cleared lysates (70 μg) were separated by SDS-PAGE (12.5% or 15% acrylamide) and electrotransferred to polyvinylidene difluoride membranes. Western blot analysis was performed by standard techniques with ECL detection (Pierce Perbio Science France, Brebières, France).
Statistical analyses
Statistical analyses were performed using the Wilcoxon rank sum test.
Results
HGS-ETR1 and HGS-ETR2 mAbs induced HMCL cell death
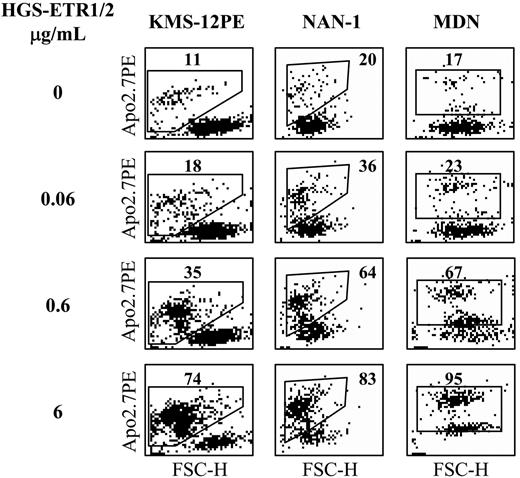
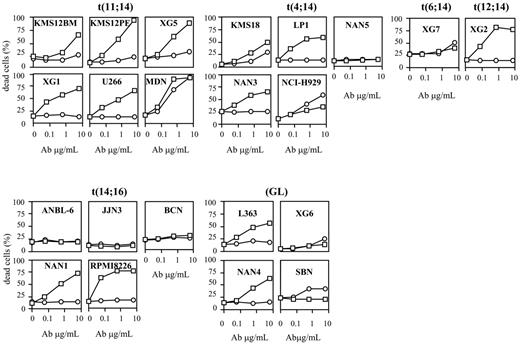
We evaluated the sensitivity of 22 HMCLs to TRAILR triggering by using 2 human mAbs, HGS-ETR1 and HGS-ETR2, directed against TRAIL-R1 (DR4) and TRAILR2 (DR5), respectively. Fourteen HMCLs were dependent on exogenous IL-6 for their growth and survival, and 8 were IL-6 independent. Myeloma cells were cultured for 48 hours with increasing concentrations (0.06, 0.6, 6 μg/mL) of HGS-ETR1 or HGS-ETR2 mAb, and cell death was evaluated by APO2.7 staining as illustrated in Figure 1 for 3 HMCLs. As shown in Figure 2 and Table 1, HGS-ETR1 mAb was much more potent than HGS-ETR2 mAb. Indeed, most (15 of 22; 68%) HMCLs were killed by HGS-ETR1 mAb, and, except for NCI-H929, all HMCLs sensitive to HGS-ETR1 showed a high rate of apoptosis (median, 44 ± 5; n = 15). On the other hand, only 10 of 22 (45%) HMCLs were sensitive to HGS-ETR2 (median, 16 ± 3; n = 10). Among the sensitive HMCLs, only 2 of 10 (NCI-H929 and MDN) were strongly killed. The other 8 were weakly sensitive to HGS-ETR2 (range, 10%-18%). Four HMCLs (18%; n = 22) were resistant to both mAbs. TRAIL-R1 and TRAIL-R2 expression by HMCL was measured by flow cytometry and expressed as the mean of fluorescence intensity ratio (MFIR; specific fluorescence/control fluorescence). MFIR mean values were 2.8 ± 1.1 for TRAIL-R1 and 2.1 ± 1.0 for TRAIL-R2, respectively (n = 22). Mean values of TRAIL-R1 MFIR of HGS-ETR1–resistant (n = 7) and –sensitive (n = 15) HMCLs were 2.3 ± 1.2 and 3.1 ± 1.0, respectively. Mean values of TRAIL-R2 MFIR of HGS-ETR2–resistant (n = 12) and –sensitive (n = 10) HMCLs were 1.6 ± 0.6 and 2.7 ± 1.1, respectively. Although responsive HMCLs have slightly stronger receptor expression (1.3-fold), statistical analyses showed no correlation between level of fluorescence and sensitivity to mAbs.
Characteristics of HMCLs classified according to HGS-ETR1 sensitivity
. | . | . | . | Death induced by HGS-ETR1 (μg/mL), % . | . | . | Death induced by HGS-ETR2 (μg/mL), % . | . | ||
|---|---|---|---|---|---|---|---|---|---|---|
. | 14q32 locus . | IL-6 . | DR4, ratio . | 0.6 . | 6 . | DR5, ratio . | 0.6 . | 6 . | ||
| HGS-ETR1 resistant | ||||||||||
| ANBL-6 | t(14,16) | + | 1.4 | 1 ± 1 | 1 ± 1 | 1 | 1 ± 1 | 1 ± 1 | ||
| BCN | t(14,16) | + | 2.7 | 1 ± 1 | 1 ± 1 | 2.8 | 1 ± 1 | 1 ± 1 | ||
| JJN3 | t(14,16) | - | 1.3 | 1 ± 1 | 1 ± 1 | 1.2 | 1 ± 1 | 1 ± 1 | ||
| NAN5 | t(4,14) | + | 1.2 | 0 ± 1 | 2 ± 1 | 1 | 1 ± 1 | 2 ± 1 | ||
| SBN | GL | + | 4.3 | 0 ± 0 | 0 ± 0 | 1.8 | 12 ± 9 | 18 ± 1 | ||
| XG6 | GL | + | 3.2 | 4 ± 1 | 5 ± 4 | 1.9 | 3 ± 3 | 10 ± 13 | ||
| XG7 | t(6,14) | + | 1.8 | 3 ± 2 | 7 ± 7 | 1.9 | 0 ± 0 | 11 ± 15 | ||
| HGS-ETR1 sensitive | ||||||||||
| NCI-H929 | t(4,14) | - | 2.8 | 11 ± 7 | 17 ± 8 | 2.4 | 26 ± 4 | 53 ± 8 | ||
| KMS12BM | t(11,14) | - | 1.5 | 5 ± 4 | 32 ± 10 | 2.1 | 1 ± 1 | 5 ± 1 | ||
| L363 | GL | - | 4.4 | 23 ± 11 | 31 ± 10 | 1.9 | 7 ± 3 | 11 ± 5 | ||
| KMS18 | t(4,14) | - | 1.4 | 19 ± 3 | 39 ± 6 | 2.9 | 8 ± 4 | 16 ± 3 | ||
| U266 | t(11,14) | + | 3.2 | 28 ± 5 | 35 ± 15 | 1.1 | 1 ± 1 | 1 ± 1 | ||
| LP1 | t(4,14) | - | 5.4 | 31 ± 18 | 41 ± 4 | 2.3 | 1 ± 1 | 1 ± 1 | ||
| NAN1 | t(14,16) | + | 2.2 | 29 ± 16 | 41 ± 20 | 2.2 | 1 ± 1 | 1 ± 1 | ||
| NAN3 | t(4,14) | + | 3.5 | 32 ± 0 | 44 ± 5 | 1.5 | 1 ± 1 | 1 ± 1 | ||
| XG1 | t(11,14) | + | 2.7 | 47 ± 14 | 51 ± 15 | 1.9 | 9 ± 6 | 3 ± 6 | ||
| NAN4 | GL | + | 3.6 | 41 ± 13 | 58 ± 14 | 1.1 | 1 ± 2 | 1 ± 1 | ||
| RPMI8226 | t(14,16) | - | 3.1 | 51 ± 18 | 61 ± 3 | 3.8 | 4 ± 1 | 10 ± 12 | ||
| XG2 | t(12,14) | + | 3.2 | 38 ± 20 | 62 ± 3 | 1.3 | 1 ± 1 | 1 ± 1 | ||
| XG5 | t(11,14) | + | 3.5 | 43 ± 1 | 68 ± 1 | 4.9 | 9 ± 4 | 18 ± 8 | ||
| KMS12PE | t(11,14) | - | 2.5 | 42 ± 7 | 77 ± 11 | 3.8 | 3 ± 1 | 14 ± 6 | ||
| MDN | t(11,14) | + | 3.7 | 79 ± 12 | 79 ± 7 | 1.8 | 50 ± 1 | 61 ± 21 | ||
TRAIL-R1 (DR4) or TRAIL-R2 (DR5) expression was measured by FACS and expressed as the ratio of fluorescence (specific fluorescence divided by isotype control fluorescence). The percentage of specific cell death was measured after 48-hour incubation with 0.6 or 6 μg/mL HGS-ETR1 or HGS-ETR2 mAb. HMCLs cultured with IL-6 are indicated. Values of death are mean ± SD of at least 3 independent experiments.
Flow cytometric analysis of HMCL cell death induced by HGS-ETR1 or HGS-ETR2 mAbs. HMCLs (125 000 cells/0.25 mL in 96-well plates) were treated for 48 hours with 0.06, 0.6, and 6 μg/mL HGS-ETR1 (NAN-1, KMS12PE) or HGS-ETR2 (MDN) mAbs. NAN-1 and MDN were cultured with 3 ng/mL IL-6. Cells were stained with APO2.7-PE mAb and were analyzed with a FACSCalibur flow cytometer. FSC indicates forward scatter; SSC, side scatter.
Flow cytometric analysis of HMCL cell death induced by HGS-ETR1 or HGS-ETR2 mAbs. HMCLs (125 000 cells/0.25 mL in 96-well plates) were treated for 48 hours with 0.06, 0.6, and 6 μg/mL HGS-ETR1 (NAN-1, KMS12PE) or HGS-ETR2 (MDN) mAbs. NAN-1 and MDN were cultured with 3 ng/mL IL-6. Cells were stained with APO2.7-PE mAb and were analyzed with a FACSCalibur flow cytometer. FSC indicates forward scatter; SSC, side scatter.
Based on the HGS-ETR1 response, we separated HMCLs into 2 groups, as shown in Table 1. Like primary myeloma cells, HMCLs are heterogeneous in terms of phenotype, genotype, and response to growth and survival factors. Therefore, we looked for a possible correlation of cellular response with 14q32 translocation or with IL-6 dependence.
Myeloma cells are characterized by aberrant genomic alterations, including recurrent translocations of the IgH gene (switch regions) located on chromosome 14 (14q32 locus).23 Recurrent partner chromosomes are chromosome 4 (FGFR3, MMSET), chromosome 11 (cyclin D1), and chromosome 16 (c-maf). As shown in Table 1, all HMCLs with t(11;14) and most with t(4;14) are HGS-ETR1 sensitive (6 of 6 and 4 of 5, respectively). On the other hand, HMCLs with t(14;16) or without 14q32 translocation (GL) are either sensitive or resistant (3 of 5 HMCLs with t(14;16) and 2 of 4 GLs are resistant, respectively). Statistical analysis showed that HMCLs with t(11;14) are significantly more sensitive to HGS-ETR1 than all other HMCLs: median values of killed cells were 51% (range, 32%-79%) for t(11;14) and 31% (range, 0%-64%) for all the other HMCLs (P < .01).
Considering IL-6 dependence, Table 1 shows that 6 of 7 (86%) HGS-ETR1–resistant and 8 of 15 (53%) HGS-ETR1–sensitive HMCLs were IL-6 dependent. Although IL-6 dependent HMCLs seem to have been more resistant to HGS-ETR1 than the others, the difference did not reach statistical significance (P = .15).
HGS-ETR1 and HGS-ETR2 mAbs kill HMCLs. HMCLs (125 000 cells/0.25 mL in a 96-well plate) were treated for 48 hours with 0.06, 0.6, and 6 μg/mL HGS-ETR1 (□) or HGS-ETR2 (○) mAbs. HMCLs were cultured with or without 3 ng/mL IL-6 (see “Materials and methods”). Percentages of dead cells were determined as described in “Materials and methods.” Results are representative of at least 1 of 3 experiments (Table 1).
HGS-ETR1 and HGS-ETR2 mAbs kill HMCLs. HMCLs (125 000 cells/0.25 mL in a 96-well plate) were treated for 48 hours with 0.06, 0.6, and 6 μg/mL HGS-ETR1 (□) or HGS-ETR2 (○) mAbs. HMCLs were cultured with or without 3 ng/mL IL-6 (see “Materials and methods”). Percentages of dead cells were determined as described in “Materials and methods.” Results are representative of at least 1 of 3 experiments (Table 1).
IL-6 does not inhibit cell death induced by TRAILR triggering
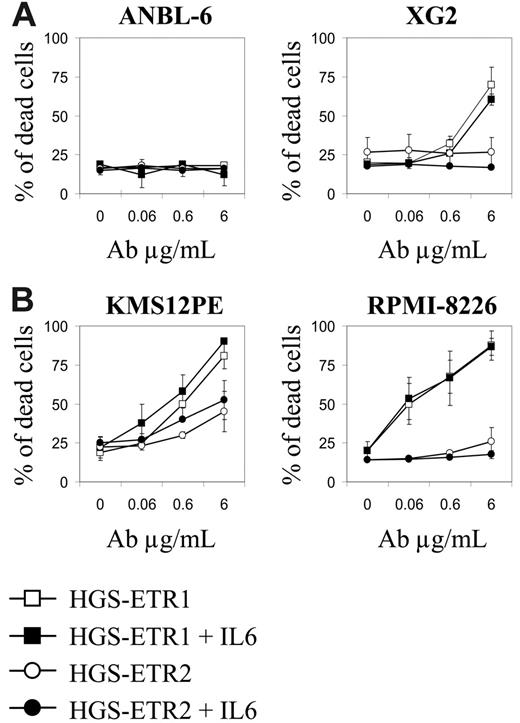
Given that many HMCLs resistant to HGS-ETR1 were IL-6 dependent, we sought to determine whether IL-6 could inhibit HGS-ETR1 or HGS-ETR2. Therefore, we treated IL-6–dependent HMCLs with each mAb in the presence (basal condition) or absence of 3 ng/mL IL-6. As illustrated in Figure 3A, the deprivation from IL-6 did not overcome HGS-ETR1/ETR2 resistance (ANBL-6) or enhance sensitivity to HGS-ETR1 (XG2) or HGS-ETR2 (XG6-7; data not shown). Furthermore, adding IL-6 to the IL-6–independent HMCL KMS12PE or RPMI8226 did not prevent HGS-ETR1 killing (Figure 3B).
Early Mcl-1L cleavage is associated with HGS-ETR1/R2–induced cell death
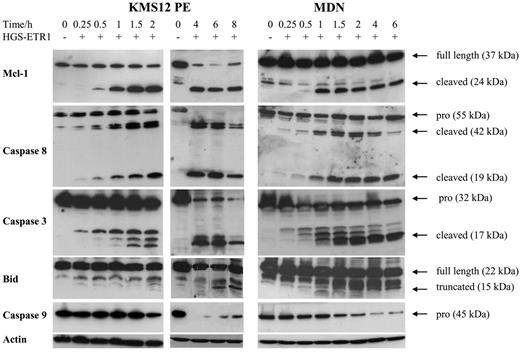
Mcl-1 is an antiapoptotic member of the Bcl-2 family that plays a crucial role in myeloma survival.15 Recently, Mcl-1L cleavage by caspase 3 has been shown to be required for TRAIL-induced cell death in Jurkat leukemia T cells.7 Moreover, we recently demonstrated that Mcl-1L is cleaved in myeloma cells treated with melphalan, the major active drug in MM treatment.24 Therefore, we were interested in investigating whether Mcl-1 cleavage is associated with cell death induced by HGS-ETR1 or HGS-ETR2. As illustrated in Figure 4 for MDN and KMS12PE cell lines, HGS-ETR1 mAb induced a very early and drastic cleavage of Mcl-1L. Indeed, as early as 1 hour after the addition of mAb, an important amount of the 24-kDa product (corresponding to C1 cleaved product) of Mcl-1L (37 kDa) was present. The appearance of Mcl-1 cleaved product was fully correlated with the detection of active forms of caspase 8 (detectable as early as 30 minutes after treatment). Detection of most Mcl1 cleaved form correlated with the detection of activated caspase 3 (cleaved form p17).
IL-6 does not modulate HGS-ETR1 killing of HMCLs. (A) IL-6 starvation of IL-6–dependent HMCLs does not enhance HGS-ETR1 killing. IL-6–dependent HMCLs ANBL-6 and XG2 (125 000 cells/0.25 mL in a 96-well plate) were treated for 48 hours with increasing concentrations of HGS-ETR1 or HGS-ETR2 mAbs in the presence or absence of 3 ng/mL IL-6. The proportion of dead cells was determined as described in “Materials and methods.” (B) Adding IL-6 to IL-6–independent HMCLs did not prevent HGS-ETR1 killing. IL-6–independent HMCL KMS12PE and RPMI-8226 (125 000 cells/0.25 mL in a 96-well plate) were treated for 48 hours with increasing concentrations of HGS-ETR1 or HGS-ETR2 mAb in the presence or absence of 3 ng/mL IL-6.
IL-6 does not modulate HGS-ETR1 killing of HMCLs. (A) IL-6 starvation of IL-6–dependent HMCLs does not enhance HGS-ETR1 killing. IL-6–dependent HMCLs ANBL-6 and XG2 (125 000 cells/0.25 mL in a 96-well plate) were treated for 48 hours with increasing concentrations of HGS-ETR1 or HGS-ETR2 mAbs in the presence or absence of 3 ng/mL IL-6. The proportion of dead cells was determined as described in “Materials and methods.” (B) Adding IL-6 to IL-6–independent HMCLs did not prevent HGS-ETR1 killing. IL-6–independent HMCL KMS12PE and RPMI-8226 (125 000 cells/0.25 mL in a 96-well plate) were treated for 48 hours with increasing concentrations of HGS-ETR1 or HGS-ETR2 mAb in the presence or absence of 3 ng/mL IL-6.
Kinetics of Mcl-1, caspases 3, 8, and 9, and Bid cleavage in MDN and KMS12PE. Myeloma cells (3 million/6 mL) cultured with (MDN) or without (KMS12PE) 3 ng/mL IL-6 were treated with 0.6 μg/mL HGS-ETR1 mAb during various times. Western blot analysis was performed as described in “Materials and methods.”
Kinetics of Mcl-1, caspases 3, 8, and 9, and Bid cleavage in MDN and KMS12PE. Myeloma cells (3 million/6 mL) cultured with (MDN) or without (KMS12PE) 3 ng/mL IL-6 were treated with 0.6 μg/mL HGS-ETR1 mAb during various times. Western blot analysis was performed as described in “Materials and methods.”
The involvement of caspase 8 in TRAIL response has been extensively described. Activated (cleaved) caspase 8 cleaves Bid, and t-Bid triggers the mitochondrial-dependent apoptosis pathway, which leads to the activation of caspase 9 and the cleavage of caspase 3.25 As illustrated in Figure 4, the detection of truncated Bid did not occur as early. Indeed, t-Bid was not detectable until 6 to 8 hours and then continued to accumulate up to 18 hours (data not shown). However, the decrease of native Bid was detectable as early as 2 hours. Moreover, kinetic analysis of procaspase 9 activation clearly shows that most caspase 9 was cleaved as early as 2 hours (Figure 4). Indeed, the disappearance of procaspase 9 was associated with the detection of the 15-kDa cleaved caspase 9 (data not shown).
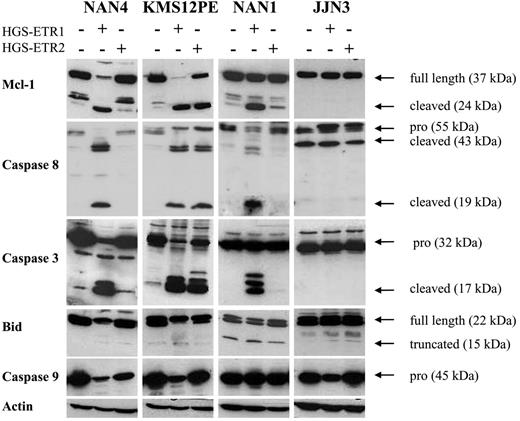
As illustrated in Figure 5, the Mcl-1–cleaved fragment was detected in all HMCLs killed by HGS-ETR1 or HGS-ETR2 (NAN-4 + HGS-ETR1, KMS12PE + HGS-ETR1 or -ETR2, NAN-1 + HGS-ETR1). The appearance of a cleaved product was associated with a decrease in, even the disappearance of (observed in 6 of 8 HMCLs), Mcl-1L (37 kDa). In the HMCLs resistant to mAbs (illustrated by JJN3), neither reduction nor cleavage of Mcl-1L was detected (also true for the other resistant HMCLs, such as ANBL-6, XG6, and XG7; data not shown). Cleavage of caspases 3, 8, and 9 and of Bid was fully correlated with the induction of cell death in all HMCLs thus far tested (n = 9; Figure 5).
Caspase inhibitors prevent HGS-ETR1/R2 killing and Mcl-1L cleavage
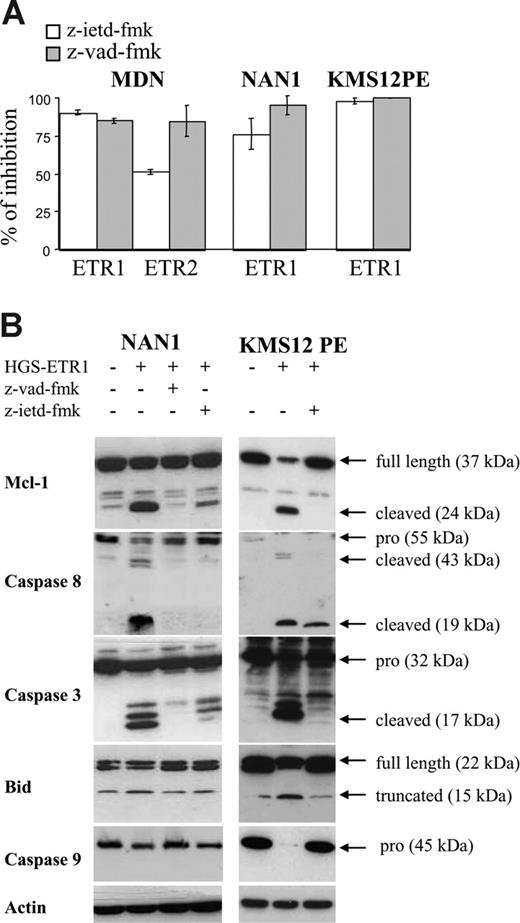
To confirm the involvement of caspases, particularly caspase 8, we evaluated HMCL sensitivity to TRAILR mAbs in the presence of z-VAD-fmk (irreversible pan caspase inhibitor) or z-IETD-fmk (irreversible caspase 8 inhibitor). As illustrated in Figure 6A, z-VAD-fmk blocked HGS-ETR1– and HGS-ETR2–induced killing (mean inhibition, 90%; range, 80%-99%). Caspase 8 inhibitor (z-IETD-fmk) was as potent as z-VAD-fmk (mean inhibition, 83%; range, 68%-92%). As shown in Figure 6B, the prevention of cell death by z-VAD-fmk was associated with the inhibition of cleavage of Mcl-1L, caspase 3 (p17), caspase 8, Bid, and caspase 9. Similarly, z-IETD-fmk, which blocks caspase 8 activity, prevented the cleavage of Mcl-1L, caspases 3 and 9, and Bid.
HGS-ETR1 mAb– and HGS-ETR2 mAb–induced cell death are always associated with Mcl-1 cleavage. Myeloma cells (3 million/6 mL) were cultured for 7 hours with (NAN-1, NAN-4) or without (KMS12PE, JJN3) 3 ng/mL IL-6 in the presence or absence of 0.6 μg/mL HGS-ETR1 or HGS-ETR2 mAb, as indicated.
HGS-ETR1 mAb– and HGS-ETR2 mAb–induced cell death are always associated with Mcl-1 cleavage. Myeloma cells (3 million/6 mL) were cultured for 7 hours with (NAN-1, NAN-4) or without (KMS12PE, JJN3) 3 ng/mL IL-6 in the presence or absence of 0.6 μg/mL HGS-ETR1 or HGS-ETR2 mAb, as indicated.
Caspase inhibitors z-VAD-fmk and z-IETD-fmk prevent HGS-ETR1– and HGS-ETR2–induced myeloma killing and Mcl-1L cleavage. (A) NAN-1 and MDN (125 000 cells/0.25 mL in 96-well plates) were cultured for 48 hours with or without (control) 0.6 mg/mL HGS-ETR1 or HGS-ETR2 mAb in the presence or absence of 50 mM caspase inhibitors. (B) Myeloma cells (4 million/8 mL) cultured with (NAN-1) or without (KMS12PE) 3 ng/mL IL-6 were treated for 7 hours with 0.6 μg/mL HGS-ETR1 mAb in the presence or absence of 50 μM caspase inhibitors.
Caspase inhibitors z-VAD-fmk and z-IETD-fmk prevent HGS-ETR1– and HGS-ETR2–induced myeloma killing and Mcl-1L cleavage. (A) NAN-1 and MDN (125 000 cells/0.25 mL in 96-well plates) were cultured for 48 hours with or without (control) 0.6 mg/mL HGS-ETR1 or HGS-ETR2 mAb in the presence or absence of 50 mM caspase inhibitors. (B) Myeloma cells (4 million/8 mL) cultured with (NAN-1) or without (KMS12PE) 3 ng/mL IL-6 were treated for 7 hours with 0.6 μg/mL HGS-ETR1 mAb in the presence or absence of 50 μM caspase inhibitors.
Primary myeloma cells are killed by HGS-ETR1 mAb
Finally, we evaluated the ability of HGS-ETR1 and HGS-ETR2 mAbs to kill primary myeloma cells (Table 2). Total bone marrow aspirates (n = 4), peripheral blood (n = 2), or pleural effusion (n = 2) of MM patients mainly during disease relapse were cultured 48 hours with or without 6 μg/mL HGS-ETR1 or HGS-ETR2 mAbs, and the proportion of viable myeloma cells was measured by specific coexpression of CD38 and CD138.26 Loss of viable myeloma cells was measured by loss of CD138 expression, modification of SSC/FSC characteristics, and expression of APO2.7. In 5 of 8 patients (P3, P4, P6, P7, P8), the proportion of viable myeloma cells was notably reduced by HGS-ETR1 (75%, 30%, 46%, 51%, 24%, respectively). HGS-ETR2 mAb was less potent because the proportion of viable myeloma cells was reduced in only 2 of 6 patients (P4 and P8; 15% and 51% reduction, respectively). In summary, HGS-ETR1 mAb was able to induce significant cell death of medullary and extramedullary myeloma cells of patients with MM at relapse.
HGS-ETR1 and HGS-ETR2 mAbs kill primary myeloma cells
. | . | . | . | Myeloma cell death, % . | . | |
|---|---|---|---|---|---|---|
| Patient . | Sample . | Status . | MM . | HGS-ETR1 . | HGS-ETR2 . | |
| 1 | BM | R | 5 | 0 | 0 | |
| 2 | BM | D | 4 | 0 | 0 | |
| 3 | BM | R | 20 | 75 | ND | |
| 4 | BM | R | 20 | 30 | 15 | |
| 5 | PB | R | 25 | 0 | 0 | |
| 6 | PB | R | 28 | 46 | ND | |
| 7 | PE | R | 61 | 51 | 0 | |
| 8 | PE | D | 49 | 24 | 51 | |
Total cells (500 000 cells/mL) from either bone marrow (BM) or peripheral blood (PB) or from pleural effusion (PE) samples from patients at diagnosis (D) or relapse (R) were cultured in RPMI 1640 containing 5% FCS medium during 48 hours with or without 6 μg/mL HGS-ETR1 or HGS-ETR2. Proportion of viable myeloma cells was evaluated by FACS analysis (CD38+138+ expression).
Discussion
In this report, we evaluated the ability of human mAbs directed against TRAILR1 (HGS-ETR1) and TRAILR2 (HGS-ETR2) to kill myeloma cells. This study was performed with a large panel of HMCLs (n = 22) to enable a clear overview of myeloma sensitivity to TRAIL-R1 or TRAIL-R2 triggering. Our first observation is that a wide majority (68%) of HMCLs was killed by HGS-ETR1 (TRAIL1), a minority (45%) of HMCLs was killed by HGS-ETR2 (TRAIL2), and only a few (18%) HMCLs were resistant to both. Interestingly, though IL-6 did not prevent HGS-ETR1 or HGS-ETR2 killing, resistant or weakly sensitive HMCLs were mainly IL-6 dependent. We measured TRAILR expression by flow cytometry and, as previously reported, did not find any correlation between TRAILR expression level and sensitivity to TRAIL-R1 or TRAIL-R2 triggering. However, we did not explore the basis of drug resistance. MM is a heterogeneous disease in its manifestation and outcome and in its biologic parameters such as phenotype and genetic and chromosome alterations. Considering the translocations of chromosome 14, we have shown that all HMCLs with t(11;14) and most with t(4;14) are sensitive to TRAIL-R1 mAb–induced killing. The molecular bases of this correlation are under investigation.
Interestingly, we demonstrated that TRAILR mAbs triggered apoptosis through the intrinsic (caspase 8/Bid) and the extrinsic (caspase 8/caspase 3) pathways in myeloma cells, as had been reported in Jurkat T cells.7,25 Indeed, caspase 3 is activated directly by caspase 8 or by the mitochondrial activation of caspase 9 initiated by Bid truncation. Kinetic studies suggest that activation of the extrinsic pathway (caspase 8/caspase 3) occurs before that of the intrinsic pathway (Bid/caspase 9/caspase 3). Weng et al7 reported that caspase 8 was unable to cleave Mcl-1L, whereas Han et al27 recently demonstrated that recombinant caspase 8 was able to do this. Our data are in agreement with this latter report. However, cleavage of Mcl-1L became drastic once caspase 3 was activated. Although initiation seemed to be mediated mostly by caspase 8, dramatic cleavage of Mcl-1L and apoptosis are correlated with activation of the extrinsic (initiation) and intrinsic (amplification) pathways. Cleavage of Mcl-1L was usually associated with a reduction of Mcl-1L (75%). Mcl-1L is a prosurvival protein, though Mcl-1–cleaved products are regarded as proapoptotic molecules.7-10,15 The association of Mcl-1L reduction with the accumulation of cleaved products could induce a major and irreversible apoptosis signal. In Jurkat cells, activation of caspase 3 by either the extrinsic or the intrinsic pathway is essential to death induction.7,25,28,29 Based on our data obtained with caspase inhibitors, it seems that only the caspase 8 inhibitor was able to fully prevent cell death and caspase 3 and Mcl-1L cleavage. Caspase 9 inhibitor (z-LEHD-fmk) partially prevented cell death but was less potent than z-IETD-fmk (data not shown). In myeloma cells, Mcl-1L is a key molecule controlling the balance between survival and death.15,16,24 Recently, its essential role in lymphocyte development was elegantly demonstrated.30 Altogether, our data underscore the essential role of Mcl-1L cleavage by caspases 3 and 8 in the control of TRAIL response.
Conversely, Weng et al7 reported that the C2 Mcl-1–cleaved product (19 kDa) was physically associated with t-Bid and was localized at the mitochondria. Furthermore, Mcl-1 C2, but not Mcl-1L, interacted with VDAC1. Similar to the findings of Weng et al7 in Jurkat leukemic T cells, we observed the cleavage of Mcl-1 and Bid, though Mcl-1 cleavage was detectable before that of Bid. Therefore, our data fully support the hypothesis that removing N-terminal domains of Mcl-1L by caspase 3 and of Bid by caspase 8 would allow the formation of an Mcl-1–cleaved form/t-Bid heterodimer that in turn induces mitochondrial perturbation and apoptosis in response to TRAIL.
It has been largely demonstrated that IL-6 is the essential survival and growth factor for myeloma cells. Specifically, IL-6 induces Mcl-1L expression.14 However, IL-6 was unable to prevent TRAILR mAb–induced cell death.
B-cell lymphopoiesis and immunopoiesis involve cell death through either Fas or TRAIL. Myeloma cells behave like bone marrow plasma cells. Indeed, myeloma and normal bone marrow plasma cells are Fas resistant but TRAIL sensitive.18,19,31,32 TRAIL/TRAILR belongs to the family of death ligands and receptors. Growing interest points to the use of death ligands in cancer treatment. Agonistic anti–TRAILR mAbs could be more potent in vivo than TRAIL itself. Indeed, as opposed to TRAIL, anti–TRAILR mAbs would not be inhibited by osteoprotegerin (OPG), a TRAIL decoy receptor that is a survival factor for myeloma cells.33,34 Moreover, MM patients with adverse outcomes have increased OPG serum levels.35 We have shown that primary myeloma cells are killed by HGS-ETR1 (62%; n = 8) or HGS-ETR2 (25%) in vitro. Primary myeloma cells were essentially obtained from patients at relapse, and 4 of them, all heavily treated, were shown to have extramedullary involvement. Myeloma cells remained TRAILR sensitive despite recurrent disease relapse. Furthermore, HGS-ETR1 and HGS-ETR2 mAbs could be of particular interest for patients with progressive disease resistant to most current drugs. TRAILR mAbs belong to the growing arsenal of apoptosis-based drugs for hematologic malignancies.36 In conclusion, our data clearly encourage clinical trials of agonistic human anti–TRAILR HGS-ETR1 and HGS-ETR2 mAbs in MM.
Prepublished online as Blood First Edition Paper, April 25, 2006; DOI 10.1182/blood-2005-12-007971.
Supported by grants from La Ligne Contre le Cancer (équipe labélisée 2005).
The publication costs of this article were defrayed in part by page charge payment. Therefore, and solely to indicate this fact, this article is hereby marked “advertisement” in accordance with 18 U.S.C. section 1734.
We thank Human Genome Sciences for providing HGS-ETR1 and HGS-ETR2 mAbs. E.M. and S.D. are candidates for a master's degree from Nantes and Rennes I University (France), respectively.

This feature is available to Subscribers Only
Sign In or Create an Account Close Modal