Abstract
Iron and copper are essential for all organisms, assuming critical roles as cofactors in many enzymes. In eukaryotes, the transmembrane transport of these elements is a highly regulated process facilitated by the single electron reduction of each metal. Previously, we identified a mammalian ferrireductase, Steap3, critical for erythroid iron homeostasis. Now, through homology, expression, and functional studies, we characterize all 4 members of this protein family and demonstrate that 3 of them, Steap2, Steap3, and Steap4, are not only ferrireductases but also cupric reductases that stimulate cellular uptake of both iron and copper in vitro. Finally, the pattern of tissue expression and subcellular localization of these proteins suggest they are physiologically relevant cupric reductases and ferrireductases in vivo.
Introduction
In eukaryotes, iron and copper metabolism are intricately interrelated. For example, copper-dependent oxidases are components of cellular iron uptake and egress pathways in yeast1,2 and mammals.3 Furthermore, these metals are essential for several components of the mitochondrial respiratory chain, and although the specific role of copper in iron metabolism in erythroid cells is uncertain, both copper and iron deficiency lead to hypochromic, microcytic anemia in mammals. Conversely, excess iron or copper can result in organ toxicity, particularly in the liver and brain. Consequently, eukaryotes have evolved complex mechanisms to regulate organismal and cellular concentrations of each metal.
In yeast, the FRE family of metalloreductases facilitates iron and copper acquisition by reducing iron from the ferric (Fe3+) to ferrous (Fe2+) state and copper from the cupric (Cu2+) to cuprous (Cu1+) state.4,5 Reduction of both metals, which exist primarily in the oxidized form in the environment, is an obligate step for efficient transport across the plasma membrane by high-affinity transporters. Similarly, in mammals, elemental iron and copper are transported across the apical plasma membrane of epithelial cells of the intestine by reduction state–specific metal transporters, DMT16-8 and CTR1,9 respectively. Based on the selectivity of these transporters for reduced forms of these metals, it is therefore likely that they act in concert with reductases to increase uptake at these tissues.
The reduction of iron also is a critical step within the transferrin (Tf) endosome. Tf serves as the major iron chelator and carrier in the serum and delivers the great majority of its iron to developing erythroid cells, which take up iron via the Tf cycle. In the Tf cycle, iron bound to Tf complexes with the transferrin receptor (TfR1) and is endocytosed. The endosome containing the Tf-TfR1 complex is acidified, promoting release of iron from Tf. Finally, the ferric iron must be reduced before it is transported out of the endosome by DMT1.
Recently, we identified an endosomal ferrireductase that facilitates Tf cycle–dependent iron uptake in erythroid precursors.10,11 This protein, 6-transmembrane epithelial antigen of the prostate 3, Steap3, bears homology to oxidoreductases found in bacteria and archaea as well as the FRE metalloreductases in yeast. Erythroid cells from mice deficient in Steap3 are defective in Tf-dependent iron uptake, resulting in a hypochromic, microcytic anemia typical of iron deficiency. Here, we characterize the remaining members of this family and demonstrate that Steap2, Steap3, and Steap4 not only reduce iron but also copper. In total, the functional activity, the patterns of expression in tissues important in iron and copper homeostasis, and the subcellular localization of these proteins suggest that they may be important metalloreductases in vivo.
Materials and methods
Plasmids
Murine Steap1, Steap2, Steap3, and Steap4 cDNAs were polymerase chain reaction (PCR)–amplified from a mouse brain cDNA library (Stratagene, La Jolla, CA) and cloned into pCMV-Flag– or pCMV-Myc–tagged vectors (Stratagene) to generate pCMV-Steap1-Flag, pCMV-Steap2-Flag, pCMV-Steap2-Myc, pCMV-Steap3-Flag, and pCMV-Steap4-Flag.
RNA expression analysis
In situ hybridization was performed on frozen sections of murine tissues using 35S-labeled RNA probes as previously described.11 Images were obtained using a 10×/0.45 numeric aperture (NA) Plan Apo lens and a Nikon Eclipse E800 microscope (Nikon Instruments, Melville, NY) using a mechanized stage and the SimplePCI image analysis software (Compix, Pittsburgh, PA). Quantitative real-time PCR was performed using Human MTC cDNA Panel I and Human Immune System MTC Panel cDNA sets (BD Biosciences, San Jose, CA) employing the SYBR Green PCR Master Mix (Stratagene) and the Mx3000P Real-Time PCR System (Stratagene) according to the manufacturers' instructions. GeneScript (Piscataway, NJ) was used to design primers. Dissociation curve analysis, gel electrophoresis, and sequencing of PCR products were performed to validate and determine the specificity of the assays. Each experiment was repeated 3 times and demonstrated similar results. Primers used in the assays are described in Table S1 (available at the Blood website; see the Supplemental Table link at the top of the online article).
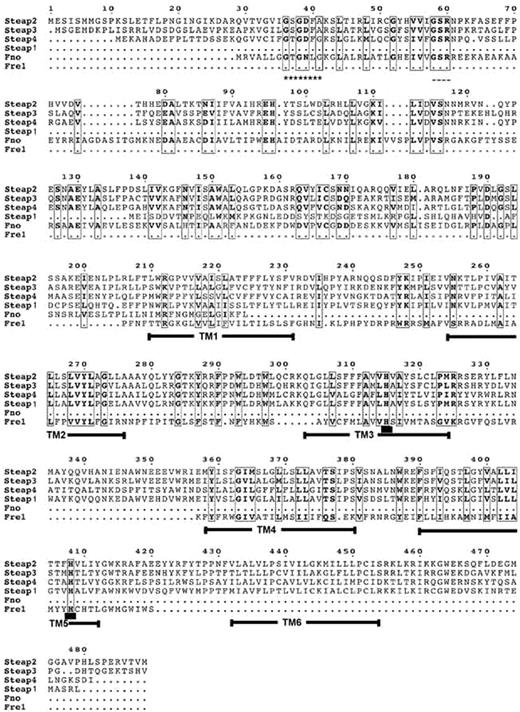
Multiple sequence alignment. Alignment of full-length Steap1, Steap2, Steap3, Steap4, Archaeoglobus fulgidus FNO, and the transmembrane region corresponding to amino acids 207 to 390 of S cerevisiae FRE1. Regions of high homology are boxed, and similar amino acids are depicted in bold. Predicted transmembrane domains of Steap family members are highlighted with solid bars. The Rossman fold motif, GXGXXA/G, is indicated by a series of asterisks. The predicted NAD(P)H binding motif is indicated by dashes. Conserved histidine residues predicted to be involved in heme binding are underlined in transmembrane domains 3 and 5.
Multiple sequence alignment. Alignment of full-length Steap1, Steap2, Steap3, Steap4, Archaeoglobus fulgidus FNO, and the transmembrane region corresponding to amino acids 207 to 390 of S cerevisiae FRE1. Regions of high homology are boxed, and similar amino acids are depicted in bold. Predicted transmembrane domains of Steap family members are highlighted with solid bars. The Rossman fold motif, GXGXXA/G, is indicated by a series of asterisks. The predicted NAD(P)H binding motif is indicated by dashes. Conserved histidine residues predicted to be involved in heme binding are underlined in transmembrane domains 3 and 5.
Cupric reductase and ferrireductase assays
Epitope-tagged Steap protein expression constructs were transfected into HEK-293T cells grown in DMEM supplemented with 10% FBS (Invitrogen, Carlsbad, CA) and penicillin/streptomycin. Forty-eight hours after transfection, cells were washed 3 times with phosphate-buffered saline (PBS), pH 7.2, and incubated in iron uptake buffer (IUB: 25 mM MES, 25 mM MOPS, 140 mM NaCl, 5 mM glucose, 5.4 mM KCl, 1.8 mM CaCl2, 800 μM MgCl2) with 50 μM Fe3+-NTA or IUB with 50 μM Cu2+-NTA. The production of ferrous iron was measured using 200 μM ferrozine as an indicator and monitoring the increase in absorbance at λ = 562 nm using an extinction coefficient of 27.9 mM–1cm–1 for the Fe2+-ferrozine complex. The reduction of Cu2+ to Cu1+ was measured using 200 μM bathocuprionedisulfonate (BCS) as an indicator and monitoring the increase in absorbance at λ= 482 nm using an extinction coefficient of 12.25 mM–1cm–1 for the Cu1+-BCS complex.
Fluorescence microscopy
HEK-293T cells were plated on poly-l-lysine–coated coverslips (BD, Franklin Lakes, NJ) and transfected with Steap expression plasmids using Geneporter 2 (Gene Therapy Systems, San Diego, CA) according to the manufacturer's instructions. Immunofluorescence staining was performed 48 hours after transfection as previously described.11 For Tf labeling, cells were incubated with 30 μg/mL Alexafluor 488–labeled human holo-Tf (Molecular Probes/Invitrogen, Carlsbad, CA) for 30 minutes before washing 3 times with PBS. Cells were fixed and treated with Cy3-labeled mouse anti-Myc 9E10 monoclonal antibody or Cy3-labeled mouse anti-Flag M2 (Sigma-Aldrich, St Louis, MO) before viewing by confocal microscopy. For TfR1 colocalization, cells were stained with FITC-conjugated anti-TfR1 (clone M-A712; BD Biosystems/PharMingen, San Jose, CA). Images were obtained using a Zeiss Axioplan 2 upright microscope and a 63×/1.4 NA oil-immersion objective and Zeiss Meta confocal imaging software (Zeiss, Thornwood, NY).
Non–transferrin-bound iron (NTBI) and copper uptake assays
Nitrilotriacetic acid (NTA)–bound 55Fe (55Fe-NTA) or 64Cu-NTA was prepared as previously described.11 64Cu was kindly provided by Dr Alan Packard (Children's Hospital Boston). HEK-293T cells were transfected and 48 hours after transfection washed 3 times in PBS and incubated in IUB containing 0.1 μM 55Fe-NTA or 0.1 μM 64Cu-NTA. Following incubation, cells were washed 3 times with PBS and then lysed in dH2O before scintillation counting for 55Fe and gamma counting for 64Cu.
Sequence alignment and homology modeling
Alignments were performed using the predicted murine protein sequences for Steap1, Steap2, Steap3, and Steap4, corresponding to the National Center for Biotechnology Information (NCBI) accession numbers NP_081675, XP_284053, AAH37435, and NP_473439, respectively. The F420H2:NADP+ oxidoreductase (FNO) sequence and amino acids 207 to 390 of Saccharomyces cerevisiae Fre1p correspond to accession numbers 1JAY_A and P32791. MultAlin12 was used to perform the multiple sequence alignment, which was rendered with ESPript.13 Transmembrane domains were predicted using Sosui.14
Results
Homology modeling and alignment of Steap family members with FNO and FRE1
In earlier studies, we identified an endosomal ferrireductase, Steap3, highly expressed in erythroid cells.11 Based on amino acid sequences, Steap3 is a member of a family of proteins at least 60% similar to one another, which includes Steap1, Steap2, and Steap4 (Figure 1). These proteins all share distant but significant similarity at the C terminus to the transmembrane domains of the yeast FRE metalloreductases. An N-terminal domain with homology to the archaeal and bacterial F420H2: NADP+ oxidoreductase (FNO) binding proteins is conserved in Steap2, Steap3, and Steap4 but is absent in Steap1. Based on the high global sequence similarity of all these proteins to Steap3, we postulated that other family members might also be involved in mammalian metal metabolism.
Tissue expression of Steap mRNAs
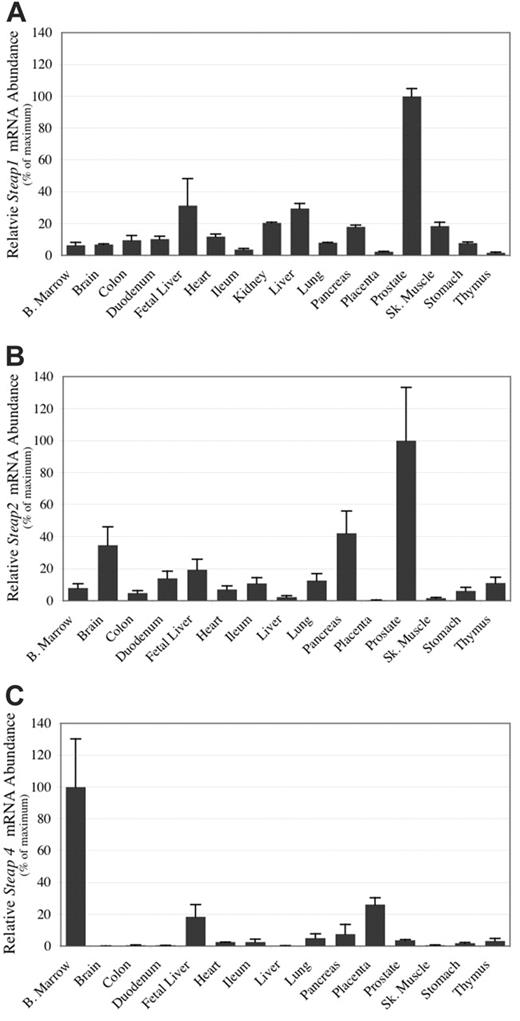
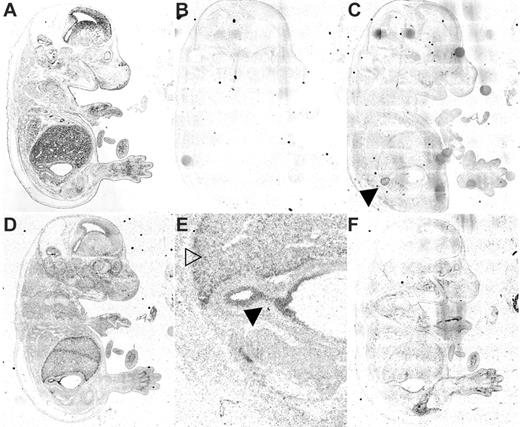
Expression analyses by real-time PCR of human tissues and in situ hybridization of mouse embryos and adult tissues were conducted to determine if the Steap family members were expressed in tissues relevant to metal homeostasis (Figures 2, 3). Real-time PCR studies and in situ hybridization in murine embryos demonstrate that Steap1 is ubiquitously expressed, though substantially higher levels were observed in the human prostate than in any other tissue (Figures 2A and 3C). Steap2 expression is similarly ubiquitous but highest by real-time PCR in prostate, pancreas, brain, and fetal liver (Figure 2B). By in situ hybridization, expression of Steap2 is seen throughout the mouse embryo but particularly strongly in the epithelium of the gastroduodenal junction, fetal liver, and in the choroid plexus of the brain (Figure 3D-E). Expression of Steap4 in human tissue is highest in bone marrow, followed by placenta and fetal liver (Figure 2C). In situ expression analysis demonstrates that murine Steap4 is ubiquitously expressed at low levels, though it is highest in adipose tissue (Figure 3F).
Steap mRNA expression in human tissues by quantitative real-time PCR. Quantitative real-time PCR was carried out using human cDNA samples. Products are normalized to β-actin for each tissue and adjusted to a percent of the maximum value obtained for that tissue. (A) Steap1 mRNA expression; (B) Steap2 mRNA expression; (C) Steap4 mRNA expression. Each cDNA sample was amplified 3 times. Error bars represent ± 1 standard deviation (SD).
Steap mRNA expression in human tissues by quantitative real-time PCR. Quantitative real-time PCR was carried out using human cDNA samples. Products are normalized to β-actin for each tissue and adjusted to a percent of the maximum value obtained for that tissue. (A) Steap1 mRNA expression; (B) Steap2 mRNA expression; (C) Steap4 mRNA expression. Each cDNA sample was amplified 3 times. Error bars represent ± 1 standard deviation (SD).
Subcellular localization of Steap family members
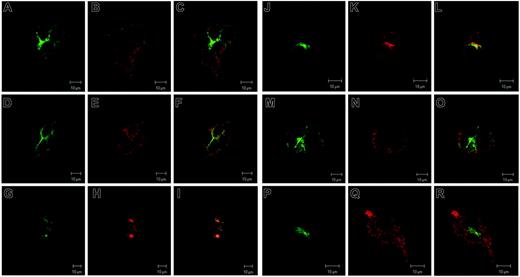
To determine the subcellular localization of the Steap proteins, we transiently transfected epitope-tagged versions of the murine homologs into HEK-293T cells (Figure 4). Immunofluorescence demonstrated that Steap1 partially colocalizes with Tf and TfR1 but also is contained within vesicles distinct from those with Tf and TfR1 (Figure 4A-F). However, Steap2 colocalizes nearly completely with Tf and TfR1 (Figure 4G-L). Some expression of Steap1 and Steap2 could also be detected on the cell surface by immunofluorescence and in crude plasma membrane preparations (Figure 4A-L and data not shown). Although subject to the limitations of localization studies of overexpressed, epitope-tagged proteins, expression of Steap1 and Steap2 in an endosomal compartment specialized for iron uptake is consistent with a role in cellular iron metabolism. Similarly, epitope-tagged Steap4 partially colocalizes with Tf and TfR1, and expression is also seen strongly at the plasma membrane (Figure 4M-R).
Steap mRNA expression by in situ hybridization. E15.5 mouse embryo sections were analyzed for Steap mRNA expression by 35S-radioactive in situ hybridization. (A) Bright field image; (B) inverted dark field negative control probe (Steap1 sense RNA); (C) Steap1 (antisense RNA), note adrenal staining (▸); (D) Steap2 (antisense RNA); (E) Steap2 higher magnification of the liver (▾) and gastroduodenal junction (▸); (F) Steap4. Checkerboard background is the result of assembling the low-power image from multiple high-power images using Compix software (see “Materials and methods”).
Steap mRNA expression by in situ hybridization. E15.5 mouse embryo sections were analyzed for Steap mRNA expression by 35S-radioactive in situ hybridization. (A) Bright field image; (B) inverted dark field negative control probe (Steap1 sense RNA); (C) Steap1 (antisense RNA), note adrenal staining (▸); (D) Steap2 (antisense RNA); (E) Steap2 higher magnification of the liver (▾) and gastroduodenal junction (▸); (F) Steap4. Checkerboard background is the result of assembling the low-power image from multiple high-power images using Compix software (see “Materials and methods”).
Steap subcellular localization. Colocalization of epitope-tagged Steap family members with Tf and endogenous TfR1. (A) Steap1, (B) Tf, (C) Tf-Steap1 merged; (D) Steap1, (E) TfR1, (F) TfR1-Steap1 merged; (G) Steap2, (H) Tf, (I) Tf-Steap2 merged; (J) Steap2, (K) TfR1, (L) TfR1-Steap2 merged; (M) Steap4, (N) Tf, (O) Tf-Steap4 merged; (P) Steap4, (Q) TfR1, (R) TfR1-Steap4 merged.
Steap subcellular localization. Colocalization of epitope-tagged Steap family members with Tf and endogenous TfR1. (A) Steap1, (B) Tf, (C) Tf-Steap1 merged; (D) Steap1, (E) TfR1, (F) TfR1-Steap1 merged; (G) Steap2, (H) Tf, (I) Tf-Steap2 merged; (J) Steap2, (K) TfR1, (L) TfR1-Steap2 merged; (M) Steap4, (N) Tf, (O) Tf-Steap4 merged; (P) Steap4, (Q) TfR1, (R) TfR1-Steap4 merged.
Steap2 and Steap4 are ferrireductases
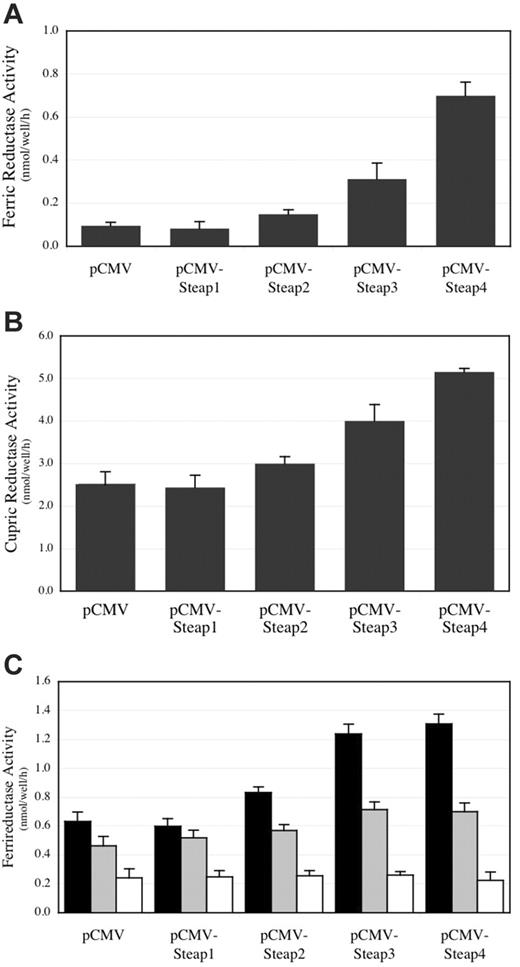
The high homology of the other Steap family members to Steap3, as well as expression in tissues and subcellular locations relevant to iron metabolism, suggested that they might also be ferrireductases. To evaluate this possibility, we transiently transfected HEK-293T cells with Steap expression plasmids and measured reductase activity using ferrozine chelation to detect reduced iron. Figure 5A demonstrates that Steap2, Steap3, and Steap4 all promote the reduction of iron in vitro. It is unclear if the relative activities are related to the level of specific expression on the cell surface and/or a reflection of the true enzymatic activity of each protein, because the expression of each reductase on the cell surface was not quantified, and it is uncertain whether the assay only measures cell surface activity. These caveats notwithstanding, Steap1, which lacks the FNO-like domain, has no measurable activity, even though it is expressed and detected at the cell surface (Figure 4A-F and data not shown).
Iron and copper reductase activity in HEK-293T cells expressing Steap family members. (A) Ferrireductase activity measured in cells overexpressing Steap family members. (B) Cupric reductase activity in cells overexpressing Steap family members. (C) Ferrireductase activity measured in cells overexpressing Steap family members with only ferric iron added (▪) or ferric iron plus a 5-fold (▦) or 10-fold (□) molar excess of cupric copper. n = 4 for each result in each panel. Error bars represent ± 1 SD.
Iron and copper reductase activity in HEK-293T cells expressing Steap family members. (A) Ferrireductase activity measured in cells overexpressing Steap family members. (B) Cupric reductase activity in cells overexpressing Steap family members. (C) Ferrireductase activity measured in cells overexpressing Steap family members with only ferric iron added (▪) or ferric iron plus a 5-fold (▦) or 10-fold (□) molar excess of cupric copper. n = 4 for each result in each panel. Error bars represent ± 1 SD.
Steap2, Steap3, and Steap4 function as cupric reductases in vitro
The significant but distant sequence similarity of the Steap family of proteins to the yeast FRE iron and copper reductases indicated that the Steap proteins might not only reduce iron but also copper. To assess this activity, we transiently transfected HEK-293T cells with Steap expression plasmids and monitored reduced copper formation by using the Cu1+-sensitive chelating dye BCS. Similar to the yeast FRE proteins, Steap2, Steap3, and Steap4 are all capable of reducing copper in vitro (Figure 5B). Steap1 does not accelerate copper reduction, in agreement with the results obtained using iron as a substrate. Furthermore, the addition of increasing concentrations of copper was able to compete for the reduction of iron (Figure 5C).
Expression of Steap2, Steap3, or Steap4 increases cellular iron and copper uptake
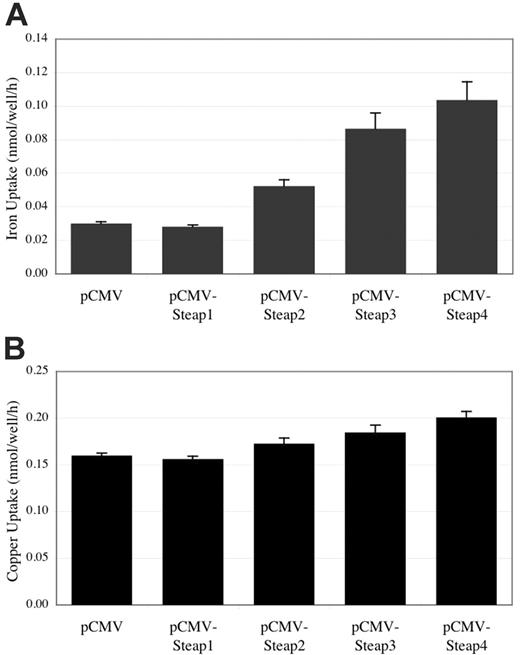
Reduction of iron and copper is believed to facilitate cell surface uptake by reduction state–specific metal transporters in vivo. Given this, the enzymatic activity of Steap2, Steap3, and Steap4 suggested that these proteins might also accelerate the uptake of iron and copper into cells. To determine if Steap proteins were capable of increasing iron and copper uptake, we transiently expressed these proteins in HEK-293T cells and followed total radioactive iron or copper uptake. Figure 6 reveals that uptake of iron and copper is roughly proportional to the ferric or cupric reductase activities of Steap family members. These results demonstrate that these proteins not only specifically reduce these metals but also stimulate their uptake into cells.
Discussion
While our previous work characterized the role of Steap3 in mammalian iron metabolism,10,11 the functions of the homologous proteins Steap1, Steap2, and Steap4 and their relevance to normal physiology have not been reported. Because of their high similarity to Steap3, we postulated that they too might be involved in cellular metal homeostasis. To assess potential roles for these genes in vivo, we studied their expression patterns by in situ hybridization and real-time PCR. We confirmed previous reports of high-level expression of Steap1 and Steap2 mRNAs in human prostate.15-17 In addition, we found substantial Steap2 expression in the fetal liver, stomach, duodenum, and in the choroid plexus of mice. We found Steap4 mRNA, previously identified as highly expressed in adipocytes and placenta,18 to be present at high levels in bone marrow and fetal liver as well.
Iron and copper uptake in HEK-293T cells expressing Steap family members. (A) Total iron uptake measured in cells overexpressing Steap family members. (B) Total 64Cu-copper uptake measured in cells overexpressing Steap family members. n = 4 for each result in both panels. Error bars represent ± 1 SD.
Iron and copper uptake in HEK-293T cells expressing Steap family members. (A) Total iron uptake measured in cells overexpressing Steap family members. (B) Total 64Cu-copper uptake measured in cells overexpressing Steap family members. n = 4 for each result in both panels. Error bars represent ± 1 SD.
Our earlier work showed that loss of Steap3 function in hematopoietic cells was responsible for the iron deficiency anemia of nm1054 mice.11 However, nm1054 and Steap3–/– erythroid precursors retain some residual ferrireductase as well as iron uptake activity, indicating that there are other ways of reducing iron in the Tf-cycle endosome and/or that there are other endosomal iron transporters that are not restricted to reduced Fe2+. Therefore, the expression of Steap2 and Steap4 in erythropoietic tissues, the partial colocalization of epitope-tagged forms with Tf and TfR1, and the demonstration that they have ferrireductase activity in vitro indicate that Steap2 and Steap4 are reasonable candidates for redundant ferrireductases in the erythroid Tf-cycle endosome. Furthermore, robust expression of Steap4 in the placenta (Figure 2C and Moldes et al18 ) could potentially compensate for the lack of placental Steap3 in nm1054 mice, thus averting neonatal systemic iron deficiency.
Although the role of Steap3 as a ferrireductase of the erythroid Tf cycle has been demonstrated previously, here we expand on those initial findings to show that Steap3 can also augment the reduction of copper. Consequently, it might be presumed that Steap3-deficient red blood cells (RBCs) would be copper deficient as well. However, preliminarily we have not found a significant decrease in the copper concentration of Steap3–/– RBCs compared with wild-type mouse erythroid cells (data not shown). This result is not surprising for several reasons. First, several studies have clearly shown that iron deficiency in erythrocytes results in elevated RBC copper concentrations.19,20 In addition, Steap2 and Steap4 are expressed in erythroid cells and could easily compensate for the lack of one cupric reductase, because erythroid copper requirements are minute and at least 100-fold lower than iron requirements.21
Of particular note is the high-level Steap2 expression in the epithelial layers of the choroid plexus and the gastroduodenal junction of mice. Both iron and copper are absorbed by the cells of the choroid plexus and through enterocytes of the proximal portion of the duodenum, and copper has also been shown to be absorbed in the stomach.9,22-24 Therefore, the expression profile combined with the functional data of Steap2 raises the possibility that it is a metalloreductase in these tissues specifically promoting iron and copper uptake.
In serum, iron normally exists bound to Tf; however, in conditions of iron overload, as in hemochromatosis and chronic transfusion, a substantial non-Tf–bound iron (NTBI) pool develops.25,26 NTBI has been postulated to be responsible for pathologic deposition of iron in many tissues (eg, liver and heart) due to uptake through specific cell surface transporters.25,27 While the identities of these transporters are not fully known, there is evidence that reduction of iron may be an obligate step in this process.28,29 Consequently, the expression pattern and functional capabilities of Steap2, Steap3, and Steap4 to not only reduce iron but increase NTBI uptake suggest these proteins may play important roles in the pathogenesis of these disorders.
The role of Steap1 in metal metabolism is less certain. Although ubiquitously expressed and partially colocalizing with both Tf and TfR1, unlike its other homologs, Steap1 does not promote iron or copper reduction or uptake. Like other family members, it is a predicted 6-pass transmembrane protein with intramembrane heme binding sites. However, it lacks the FNO-like reductase domain believed to be critical for activity.11 Nonetheless, it remains possible that Steap1 has some role in metal homeostasis. For instance, if the Steap proteins function as heteromultimers with Steap1, Steap1 could modulate the activity or the subcellular localization of its partner.
In total, we have characterized several new members of a conserved family of mammalian metalloreductases and demonstrated that iron and copper are both substrates, further elaborating on the connection between iron and copper in eukaryotes. Not only do these proteins act as reductases, but their expression in cells also stimulates iron and copper uptake. These results coupled with the tissue pattern of expression and subcellular localization with components known to be important for iron and copper homeostasis help to define their potential roles in metal metabolism. In vivo studies using genetically manipulated mice will be useful to further evaluate the link between the Steap proteins and iron and copper transport in vivo.
Prepublished online as Blood First Edition Paper, April 11, 2006; DOI 10.1182/blood-2006-02-003681.
Supported by National Institutes of Health (NIH) grants R01 HL074247 and R01 DK062474 (M.D.F.); NIH MSTP T32 GM07753 (R.S.O.); and National Cancer Institute (NCI) grant R24 CA86307.
The online version of this article contains a data supplement.
The publication costs of this article were defrayed in part by page charge payment. Therefore, and solely to indicate this fact, this article is hereby marked “advertisement” in accordance with 18 U.S.C. section 1734.
The authors thank Nancy Andrews for her generous support and critique of experiments. We thank Stephen Blacklow, Gary Gilliland, and Thomas Bartnikas for their thoughtful suggestions and Glenn Yiu for his support. We also thank Alan Packard for providing 64Cu and for his expertise concerning copper experiments.

This feature is available to Subscribers Only
Sign In or Create an Account Close Modal