Abstract
CD34 cells from patients with trisomy 8 myelodysplastic syndrome (MDS) are distinguished from other MDS cells and from normal hematopoietic cells by their pronounced expression of apoptotic markers. Paradoxically, trisomy 8 clones can persist in patients with bone marrow failure and expand following immunosuppression. We previously demonstrated up-regulation of c-myc and CD1 by microarray analysis. Here, we confirmed these findings by real-time polymerase chain reaction (PCR), demonstrated up-regulation of survivin, c-myc, and CD1 protein expression, and documented comparable colony formation by annexin+ trisomy 8− CD34+ and annexin− CD34 cells. There were low levels of DNA degradation in annexin+ trisomy 8 CD34 cells, which were comparable with annexin− CD34 cells. Trisomy 8 cells were resistant to apoptosis induced by gamma irradiation. Knock-down of survivin by siRNA resulted in preferential loss of trisomy 8 cells. These results suggest that trisomy 8 cells undergo incomplete apoptosis and are nonetheless capable of colony formation and growth.
Introduction
Myelodysplastic syndromes (MDSs) are heterogeneous disorders showing varying degrees of bone marrow (BM) failure and a tendency to evolve to acute leukemia. To clarify the cellular and molecular mechanisms in MDS, we have focused on syndromes that are defined by cytogenetics. In trisomy 8 MDS, patients suffer predominantly from pancytopenia; indeed, the diagnosis can be confounded with aplastic anemia, and some patients with aplastic anemia can evolve to trisomy 8 MDS.1 We have observed that trisomy 8 MDS is associated with oligoclonal T-cell expansion, suggestive of an antigen-driven pathophysiology.2 We also observed that trisomy 8 cells, compared with normal cells from individual patients' BM, are Fas-receptor+ and annexin+,3 findings consistent with a cell population under immune attack and undergoing apoptosis.4
This model of pathophysiology is compatible with the larger role for apoptosis hypothesized for the MDS. However, that trisomy 8 cells are targeted and undergo apoptosis remains paradoxical because this mechanism would be expected to eradicate the abnormal clone. A possible explanation for the survival of trisomy 8 cells despite an apparently specific immune attack and the induction of apoptosis was suggested by experiments demonstrating that annexin+ BM cells from MDS showed good hematopoietic colony formation.5 Survival of abnormal CD34 cells in MDS might therefore be explicable based on apoptosis that is incomplete, as, for example, due to failure of signal transduction upstream of caspase 3 activation and the phosphatydyinositol membrane changes that result in annexin binding.6,7
Previously we demonstrated on microarray analysis that proteins affecting apoptosis and proliferation, c-myc and CD1, were up-regulated in CD34 cells of patients with trisomy 8.8 In this study we examined CD1 and c-myc expression by real-time polymerase chain reaction (PCR) and assessed the clonogenicity of annexin+ trisomy 8 cells in culture.
Materials and methods
Patient population
After informed consent, using protocols approved by the Institutional Review Board of the National Heart, Lung, and Blood Institute, BM was obtained from a cohort of patients with MDS described in a previous publication.9 All samples were obtained prior to immunosuppressive treatment.
Cell separation
Separated cell preparations were enriched for CD34 cells using the magnetic-activated cell-sorting (MACS) column or by flow cytometric sorting. The purity of CD34 cells was 88% to 94% as determined by flow cytometry (EPICS Altra; Beckman Coulter, Miami, FL).
Apoptosis assays
Peripheral blood mononuclear cells (PBMCs) were stained with annexin and propidium iodide (Tat assay) as previously described;10 cells which stained with propidium iodide were excluded from analysis. Cells for sorting were only stained with annexin-FITC. An in situ thymidine deoxyneuclease (TdT) assay (Apotag; Oncor, Gaithersburg, MD) also was used to quantitate the number of cells that underwent apoptosis as previously described;11 all assays were performed in duplicate.
Flow cytometry
Intracellular staining for CD1 expression was performed using the PharMingen Intracellular Staining Kit (San Diego, CA)12 staining with FITC-labeled anti-CD1 antibody. Samples were sorted by flow cytometry as previously described.13 A number (5000-10 000) of cells were examined for each sample, and in most experiments in duplicate.
FISH
Fluorescent in situ hybridization (FISH) was performed as previously described14 with probes for chromosomes 5q, 7, and 8 (Vysis Inc, Downers Grove, IL). Three different observers, blinded with respect to sample identity, examined 3 different sets of slides. A positive healthy control and a trisomy 8+ control were hybridized and scored with each separate run. Samples were run in triplicate and each read by 3 blinded observers. Standard error of the mean is calculated for each individual sample.
Cell-cycle analysis
DNA analysis of cell-cycle status was performed using flow cytometry. CD34 cells were purified using a MACS column as previously described.15 In some instances CD34 cells which were sorted into annexin+ and annexin− fractions using flow cytometry. Cell-cycle analysis of propidium iodide was performed using MCycle software version 2.5 (Phoenix Flow Systems, Phoenix, AZ). This method allows determination of cell-cycle status and also quantitation of apoptotic cells by measurement of the hypodiploid peak. The positive apoptotic control was prepared by coculturing normal CD34 cells with IFN-γ (1000 U/mL) and Fas agonist, CH11 (Immunotech, Marseilles, France), for 1 day at 37°C.
Real-time PCR
Real-time PCR was performed as previously described16 on column-purified CD34 cells using primer pairs for c-myc,17 CD1,18 and survivin.19 Relative expression levels and differences in CD34 cells of individual patients compared with controls were validated using the TaqMan 5′ nuclease real-time reverse transcriptase–PCR (RT-PCR) assay. Samples from 8 patients (4 with monosomy 7, and 4 with trisomy 8) were subjected to real-time RT-PCR using appropriate primers for 10 genes of interest and β-actin as an internal control. Primers were designed using Clonal Manager Suite software except for TRAIL (R&D Systems, Minneapolis, MN). Using RT, cDNA was synthesized from 500 ng total RNA extracted from CD34 cells; aliquots of cDNA were used as templates for real-time PCR reactions containing primers of either target genes or β-actin. Each amplification was performed in duplicate for each sample in a 25-μL reaction mixture using the components of the TaqMan PCR Core Reagent Kit (Perkin Elmer, Les Ulis, France) and 300 nM of forward and reverse primers. The PCR reactions, TaqMan analyses, and subsequent calculations were performed with the ABI Prism 7700 sequence detection system (Perkin Elmer Biosystems, Foster City, CA) and SYBR Green reagents. The threshold cycle (CT) value was defined as the fraction cycle number and set at 10 times the standard deviation above the mean baseline fluorescence calculated from cycles 3 to 15. The fold changes in the target genes normalized to β-actin and relative expression of healthy controls were calculated for each sample using the 2−CT method, where −CT = (CT, Target − CT, Actin) Patient's sample −(CT, Target − CT, Actin) Normal control.
Immunoblotting
BM mononuclear cells (BMMNCs) were used for the preparation of the extracts as previously described.20 The protein content of the extracts was determined using the Micro BCA Protein Assay kit (Pierce, Rockford, IL).
Proteins (10 μg/lane) were resolved in 12% Tris-glycine SDS gels (Invitrogen, Carlsbad, CA) electrophoresis at 125 V. Resolved proteins from the gel were transferred to polyvinylidene difluoride (PVDF) membranes (Invitrogen). The membrane was blocked for 2 hours with 5% BSA in PBS and 0.05% Tween-20 followed by incubation in primary antibody (Ab). Subsequently, membranes were incubated in horseradish peroxidase (HRP)–conjucated secondary Ab, and detection of the bands of interest was performed using the electrochemiluminescence (ECL) plus system (Amersham Pharmacia Biotech, Buckinghamshire, United Kingdom). Membranes were stripped after the first blotting in ImmunoPure IgG elution buffer (Pierce), reblocked, and reblotted with another Ab. To evaluate equal loading of the lanes, membranes were reblotted with antiactin polyclonal Ab. Densitometry analysis of the bands of interest was performed using the ImageQuant analysis software from Amersham (Amersham Biosciences, Piscataway, NJ). Anti–c-myc Ab was purchased from Calbiochem (San Diego, CA) and antisurvivin Ab was from Zymed Laboratories (San Francisco, CA). The antiactin Ab and the HRP-conjugated Abs were purchased from Santa Cruz Biotechnology (Santa Cruz, CA).
c-myc inhibition
Aliquots of cells were cultured in 6-well plates in MethoCult GF H4535 (Stem Cell Technologies, Vancouver, BC, Canada). A c-myc inhibitor, Int-H1-S6A, F8A (Marligen Biosciences, Ijamsville, MD), was added to final concentrations of 15 μM and 20 μM. Int-H1-S6A, F8A interferes with specific c-Myc DNA binding through the cooperative binding of H1 peptides with tetrameric c-Myc-92.21 Cultures were incubated at 37°C, 5% CO2 for 14 days; cells were then harvested for FISH and Western analysis.
Survivin siRNA transfection
BMMNCs (7 × 10⁵cells/well) were plated into a 12-well plate and cultured for 24 hours at 37°C with 5%CO2. The transfections was performed following the Cell Signaling protocol (Dancers, MA) and were incubated for 36 hours at 37°C with 5%CO2. SignalSilence survivin siRNA and goat anti–rabbit IgG-HRP were purchased from Cell Signaling Technology (Danvers, MA). The transfection reagent, TransIT-TKO, supplied with the SignalSilence Survivin siRNA Kit, was produced by Mirus Bio (Madison, WI). Transfected and control BMMNCs were cultured for 36 hours in hematopoietic growth factors before cell count, viability, and FISH were performed.
Statistical methods
We performed real-time PCR on flow-cytometrically sorted CD34 cells from 8 patients with trisomy 8 MDS, 10 healthy controls, and 6 patients with monosomy 7 MDS. For each subject, the procedure was performed by 3 blinded observers each with 3 repeats, so that a total of 9 readings per subject were obtained. Within each reading, c-myc and cyclin D1 (CD1) expressions were evaluated based on a sample of 10 000 cells. Through a series of analysis of variance (ANOVA) tests, no significant interobserver and intraobserver differences for c-myc and CD1 expressions were detected. Consequently, the means and the corresponding standard errors of the c-myc and CD1 expressions were computed for each subject by pooling his/her data from all 9 readings, and mean and standard error for the mean c-myc and cyclin D1 expressions were computed for the 10 healthy controls. For each of the patients with trisomy 8 and monosomy 7 MDS, fold increases for c-myc and CD1 were computed by the ratios of the corresponding mean c-myc and CD1 expressions of the patient over the means of the 10 healthy controls. Sample means and their standard errors of the fold increases were computed for the 8 patients with trisomy 8 MDS and the 6 patients with monosomy 7 MDS, respectively. Linear regression models were used to analyze the relationships between the fold increases (c-myc and CD1) and the percent of trisomy 8 cells for the patients with trisomy 8 MDS.
Results
CD34 and BMMNC CD1 and c-myc mRNAs are increased in patients with trisomy 8 in proportion to the number of BM trisomy 8 cells
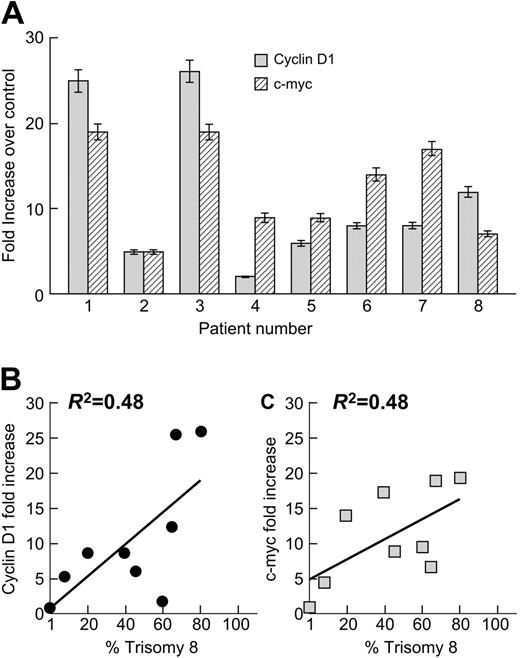
We first sought to confirm our previous observation by microarray analysis that CD1 and c-myc mRNA were up-regulated in trisomy 8 MDS. We performed real-time PCR and FISH on flow-cytometrically sorted CD34 cells from 8 patients with trisomy 8 MDS and 10 healthy controls using probes described in “Materials and methods.” Both c-myc and CD1 expression were substantially increased in CD34 cells from patients with trisomy 8 compared with healthy individuals (fold increase is seen in Figure 1A). Expression of c-myc and CD1 was proportional to the number of trisomy 8 cells in the sample (Figure 1B-C).
Up-regulation of CD1 and c-myc in CD34+ cells of patients with trisomy 8. CD34+ cells from the BM of patients with trisomy 8 were separated by flow cytometry, and mRNA was extracted and subjected to real-time PCR as described in “Materials and methods”; FISH was also performed to determine the percentage of trisomy 8 cells in the same sample. Both c-myc and CD1 m-RNAs were up-regulated in trisomy 8 compared with a control group of 10 healthy donors (A). The magnitude of increase in c-myc and CD1 expression was proportional to the number of trisomy 8 CD34 cells in the sample (B-C). Error bars represent standard error of the mean (SEM).
Up-regulation of CD1 and c-myc in CD34+ cells of patients with trisomy 8. CD34+ cells from the BM of patients with trisomy 8 were separated by flow cytometry, and mRNA was extracted and subjected to real-time PCR as described in “Materials and methods”; FISH was also performed to determine the percentage of trisomy 8 cells in the same sample. Both c-myc and CD1 m-RNAs were up-regulated in trisomy 8 compared with a control group of 10 healthy donors (A). The magnitude of increase in c-myc and CD1 expression was proportional to the number of trisomy 8 CD34 cells in the sample (B-C). Error bars represent standard error of the mean (SEM).
CD1 and c-myc proteins are up-regulated in trisomy 8
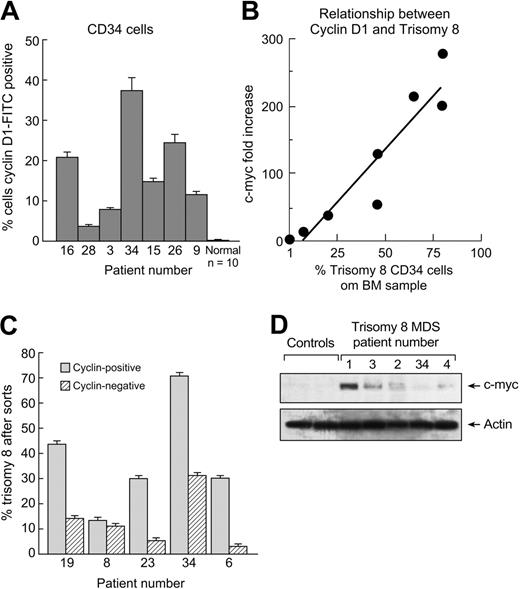
We examined CD1 and c-myc protein expression using flow cytometry and immunoblot. Unseparated BM was stained with CD34-PE and CD1-FITC, and CD34+ cells were gated and examined by flow cytometry (Figure 2A) and compared with a group of 10 healthy controls. The amount of protein was significantly increased compared with controls (P < .01) and correlated positively with the number of trisomy 8 CD34+ cells in the sample (Figure 2B). When BMMNCs were sorted into CD34+, CD1+, and CD1− fractions and FISH performed, there was a predominance of trisomy 8 cells in the CD1+ fraction on FISH analysis (Figure 2C). c-myc was not reliably detectable with flow cytometric staining but could be detected in excess amounts when nuclear protein was extracted from lymphocyte-depleted BMMNCs and analyzed by Western blot (immunoblots are seen in Figure 2D).
CD1 protein is overexpressed in trisomy 8. BMMNCs were stained with CD1-FITC and CD34-PE mAb and subjected to flow cytometry; CD34+ cells were gated, and the number of these cells staining with anti-CD1–FITC was quantitated. CD1 protein was increased in CD34 cells from patients with trisomy 8 compared with a group of healthy controls (A). CD1 expression was proportional to the number of trisomy 8 CD34 cells in the sample as determined by FISH using a specific chromosome 8 probe. (B) BMMNCs from patients with trisomy 8 were stained with CD34-PE and CD1-FITC. Cells were sorted into CD34+, CD1+, and CD1− aliquots by flow cytometry; FISH for chromosome 8 was performed on the sorted samples. There were increased trisomy 8 cells in the CD1+ fraction. (C) Immunoblots were performed on nuclear extracts of BMMNCs for c-myc. Increases in patients with trisomy 8 compared with healthy controls (n = 2) or other patients with MDS (n = 6) were seen. Error bars represent SEM.
CD1 protein is overexpressed in trisomy 8. BMMNCs were stained with CD1-FITC and CD34-PE mAb and subjected to flow cytometry; CD34+ cells were gated, and the number of these cells staining with anti-CD1–FITC was quantitated. CD1 protein was increased in CD34 cells from patients with trisomy 8 compared with a group of healthy controls (A). CD1 expression was proportional to the number of trisomy 8 CD34 cells in the sample as determined by FISH using a specific chromosome 8 probe. (B) BMMNCs from patients with trisomy 8 were stained with CD34-PE and CD1-FITC. Cells were sorted into CD34+, CD1+, and CD1− aliquots by flow cytometry; FISH for chromosome 8 was performed on the sorted samples. There were increased trisomy 8 cells in the CD1+ fraction. (C) Immunoblots were performed on nuclear extracts of BMMNCs for c-myc. Increases in patients with trisomy 8 compared with healthy controls (n = 2) or other patients with MDS (n = 6) were seen. Error bars represent SEM.
Antiapoptotic protein survivin is increased in trisomy 8 BMMNCs compared with control
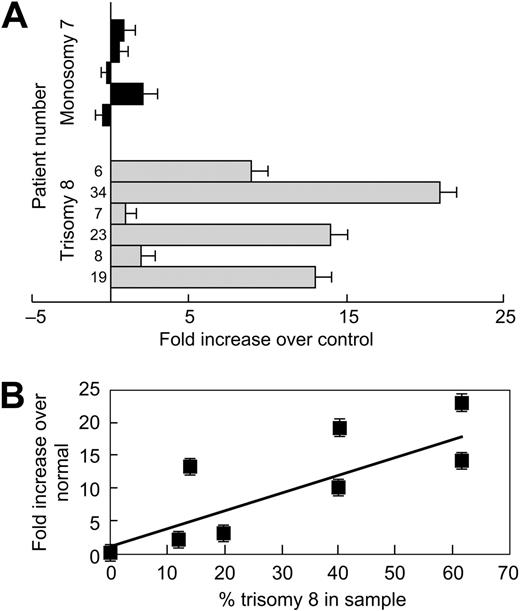
Up-regulation of cyclin D in mantle cell lymphomas is associated with increases in survivin.22 In addition, survivin is one of the few inhibitors of apoptosis that will block apoptosis upstream of caspase 8 activation (already previously shown to be present in trisomy 8 cells23 ). We examined survivin mRNA and protein expression. We performed real-time PCR on column-purified CD34 cells from 6 patients with trisomy 8 MDS. Survivin mRNA expression was compared with a group of 10 healthy individuals and to a group of patients with MDS monosomy 7 who were equally cytopenic. Survivin mRNA was significantly increased in patients with trisomy 8 (P < .05; fold difference is seen in Figure 3A); the relationship between survivin expression and numbers of trisomy 8 cells are seen in Figure 3B. Increases in survivin protein in purified CD34 cells were demonstrated by flow cytometry (Figure 4A-B) and by immunoblot (Figure 4C).
Survivin, an IAP, is up-regulated in trisomy 8. RNA was extracted from purified CD34 cells with trisomy 8 and analyzed for survivin by real-time PCR; FISH was performed on sorted samples. Expression was compared with the mean of a panel of 10 healthy donors, as described in “Materials and methods.” Survivin mRNA was up-regulated in patients with trisomy 8 compared with controls and with a small group of equally cytopenic patients whose cytogenetics showed monosomy 7 (A). Expression was increased to a greater extent in samples with increased trisomy 8 cells (B). Error bars represent SEM.
Survivin, an IAP, is up-regulated in trisomy 8. RNA was extracted from purified CD34 cells with trisomy 8 and analyzed for survivin by real-time PCR; FISH was performed on sorted samples. Expression was compared with the mean of a panel of 10 healthy donors, as described in “Materials and methods.” Survivin mRNA was up-regulated in patients with trisomy 8 compared with controls and with a small group of equally cytopenic patients whose cytogenetics showed monosomy 7 (A). Expression was increased to a greater extent in samples with increased trisomy 8 cells (B). Error bars represent SEM.
Survivin protein is increased in trisomy 8 CD34 cells. Flow cytometry was performed on column-purified CD34 cells stained by intracellular staining as described in “Materials and methods” using survivin-FITC mAb. Survivin protein was increased in samples obtained from trisomy 8 BM (example seen in panel A). Entire sampling of patients examined is seen in panel B. Immunoblots were performed on total-cell lysates of BMMNCs for survivin. Increases in patients with trisomy 8 compared with healthy controls (n = 2) or other patients with MDS (n = 6) could be seen. Error bars represent SEM.
Survivin protein is increased in trisomy 8 CD34 cells. Flow cytometry was performed on column-purified CD34 cells stained by intracellular staining as described in “Materials and methods” using survivin-FITC mAb. Survivin protein was increased in samples obtained from trisomy 8 BM (example seen in panel A). Entire sampling of patients examined is seen in panel B. Immunoblots were performed on total-cell lysates of BMMNCs for survivin. Increases in patients with trisomy 8 compared with healthy controls (n = 2) or other patients with MDS (n = 6) could be seen. Error bars represent SEM.
Cell-cycle analysis and TUNEL assays demonstrate no DNA degradation in annexin+ cells from patients with trisomy 8
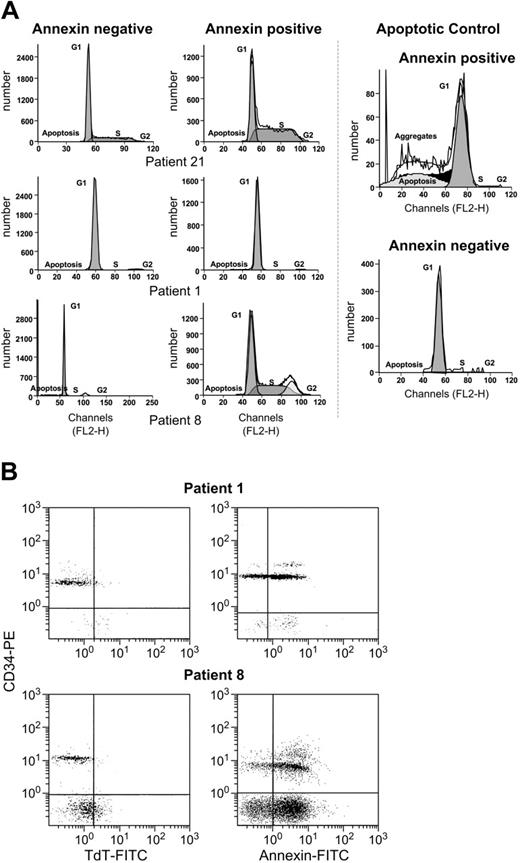
We previously demonstrated that trisomy 8 cells express annexin and activated caspase 8.24 Here, we determined whether these signs of early apoptosis were associated with DNA fragmentation. For this purpose, we performed both cell-cycle analysis and the TdT-mediated dUTP nick-end labeling (TUNEL) assay. Cell-cycle analysis on purified CD34 cells from 5 patients with trisomy 8 showed no significant DNA degradation in the annexin+ fraction enriched with trisomy 8 cells (Table 1; Figure 5A). Annexin+ and annexin− CD34+ cells from healthy donors served as controls. As expected, significant DNA degradation was seen in a positive control. When the TUNEL assay was performed on CD34 cells from an additional 4 patients with trisomy 8, there were many fewer TUNEL+ cells compared with annexin+ cells (Table 1; P = .04, paired t test; example seen in Figure 5B).
Trisomy 8 CD34 cells are primarily annexin+, and cell-cycle analysis of these demonstrated no DNA degradation
| . | Annexin−, % . | Annexin+, % . | |||||||||
|---|---|---|---|---|---|---|---|---|---|---|---|
| Patient no. . | Trisomy 8 . | Subgenomic DNA . | G1 . | S . | G2 . | Trisomy 8 . | Subgenomic DNA . | G1 . | S . | G2 . | Positive TUNEL assay . |
| 1 | 15 | 1 | 80 | 15 | 4 | 85 | 1 | 97 | 2 | 0 | 5 |
| 8 | 17 | 0 | 88 | 2 | 10 | 83 | 1 | 97 | 1 | 1 | 10 |
| 21 | 10 | 1 | 83 | 15 | 2 | 58 | 1 | 68 | 1 | 0 | ND |
| 7 | 4 | 1 | 98 | 1 | 0 | 98 | 2 | 98 | 0 | 0 | 3 |
| 13 | 3 | 0 | 90 | 10 | 0 | 70 | 3 | 97 | 0 | 0 | 7 |
| 3 | 2 | ND | ND | ND | ND | 43 | ND | ND | ND | ND | 20 |
| 23 | 13 | ND | ND | ND | ND | 87 | ND | ND | ND | ND | ND |
| 10 | 3 | ND | ND | ND | ND | 85 | ND | ND | ND | ND | ND |
| 34 | 2 | ND | ND | ND | ND | 97 | ND | ND | ND | ND | 4 |
| Mean healthy control* | 0 | 0 | 98 | 1 | 1 | 0 | 56 | 40 | 0 | 0 | 68 |
CD34+, annexin+ BMMNCs obtained from patients with trisomy 8 and purified by flow cytometry were analyzed by FISH. Samples from these patients, which were subjected to cell-cycle analysis or TUNEL assay as described in “Patients, methods, and materials,” showed little DNA degradation. Results were compared with an apoptotic control (normal BMMNCs prompted to undergo apoptosis by coculture with IFNγ [1000 U/mL] and Fas agonist).
ND indicates not done.
* N = 5.
Absence of significant DNA degradation in annexin+ cells from patients with trisomy 8. (A) Cell-cycle analysis of sorted CD34 annexin+ and annexin− cells showed that trisomy 8 cells were more heavily represented in the annexin+ fraction, but no significant numbers of cells with subgenomic DNA could be seen in this fraction (full dataset in Table 1). (B) When purified CD34 cells were stained with annexin-PE and CD34-FITC, or the TUNEL assay performed, there was significant annexin staining, but few cells were TUNEL+ (full dataset in Table 1).
Absence of significant DNA degradation in annexin+ cells from patients with trisomy 8. (A) Cell-cycle analysis of sorted CD34 annexin+ and annexin− cells showed that trisomy 8 cells were more heavily represented in the annexin+ fraction, but no significant numbers of cells with subgenomic DNA could be seen in this fraction (full dataset in Table 1). (B) When purified CD34 cells were stained with annexin-PE and CD34-FITC, or the TUNEL assay performed, there was significant annexin staining, but few cells were TUNEL+ (full dataset in Table 1).
Annexin+ CD34 cells are more likely to be trisomy 8 and grow as well in colony culture as do annexin− CD34 cells
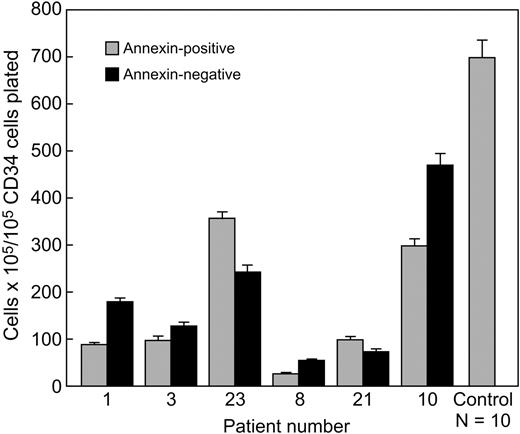
In order to assess the function of primarily annexin+ CD34 cells from patients with trisomy 8, colony culture assays for hematopoietic progenitors were performed using sorted annexin+ and annexin− cells. Unseparated BM from 6 patients with trisomy 8, 12 healthy controls, and 4 patients with monosomy 7 was stained with annexin-FITC and CD34-PE and sorted into annexin+ and annexin− CD34 cell fractions. The annexin+ CD34 cells were primarily trisomy 8 (Table 1). The annexin+ BM from patients with trisomy 8 showed comparable colony growth in methylcellulose culture to the annexin− marrow (Figure 6). Control annexin+ BM from healthy donors and patients with monosomy 7 (data not shown) did not give rise to any colonies.
Comparable hematopoietic colony formation by annexin+ and annexin− CD34 cells from patients with trisomy 8. BMMNCs obtained from patients with significant trisomy 8 populations were stained with annexin-FITC and CD34-PE mAb and sorted into annexin+ and annexin− aliquots of CD34 cells. These CD34 cells were plated in methycellulose for short-term culture as described in “Materials and methods.” Annexin+ CD34 cells were primarily trisomy 8 and gave rise to more hematopoietic colonies than did annexin− cells in 3 of 4 patients. In all 5 samples obtained from healthy volunteers, the annexin+ CD34 cells failed to give rise to any colonies. FISH results on annexin+ and annexin− fractions are listed in Table 1. Error bars represent SEM.
Comparable hematopoietic colony formation by annexin+ and annexin− CD34 cells from patients with trisomy 8. BMMNCs obtained from patients with significant trisomy 8 populations were stained with annexin-FITC and CD34-PE mAb and sorted into annexin+ and annexin− aliquots of CD34 cells. These CD34 cells were plated in methycellulose for short-term culture as described in “Materials and methods.” Annexin+ CD34 cells were primarily trisomy 8 and gave rise to more hematopoietic colonies than did annexin− cells in 3 of 4 patients. In all 5 samples obtained from healthy volunteers, the annexin+ CD34 cells failed to give rise to any colonies. FISH results on annexin+ and annexin− fractions are listed in Table 1. Error bars represent SEM.
Trisomy 8 cells are resistant to apoptosis induced by gamma radiation
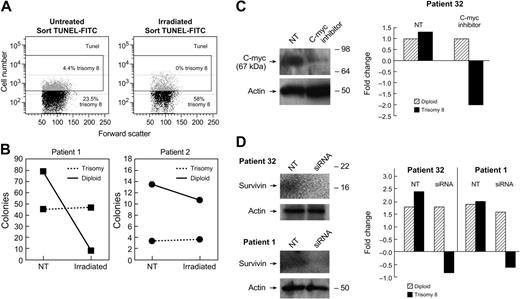
The relative resistance of trisomy 8 cells and normal diploid cells to apoptosis under stress conditions was examined using gamma radiation. Lymphocyte-depleted BMMNCs from 2 patients with trisomy 8 were split into 2 aliquots. The cells were either nonirradiated (0 Gy) or irradiated with γ rays from a 137Cs source at a dose of 25 Gy. Cells were subsequently placed in short-term methylcellulose culture for 2 weeks as previously described,25 or in liquid culture for 1 hour. The TUNEL assay was performed on samples in liquid culture, which were subsequently sorted based on TUNEL staining and then subjected to FISH. FISH was also performed on the colonies obtained from the irradiated and nonirradiated cells in methylcellulose culture. Samples from the TUNEL− fractions consistently demonstrated more trisomy 8 cells than the positive fractions indicating resistance to apoptosis in the trisomy 8 population (Figure 7A). In short-term methylcellulose culture, the proportion of trisomy 8 cells in the irradiated aliquot was substantially increased compared with the nonirradiated aliquot (4% and 10% vs 29% and 40%, respectively; Figure 7B).
Resistance of trisomy 8 cells to apoptosis is abrogated by knock-down of c-myc and survivin.Trisomy 8 BM was subjected to 25 Gy of gamma radiation and cultured for 1 hour in media as described in “Materials and methods.” The TUNEL assay was performed to identify DNA nicks and TUNEL+ and TUNEL− fractions sorted for both irradiated and nonirradiated fractions. The numbers of viable cells were decreased in the irradiated fraction, and the TUNEL+ cells increased from 18% to 30%. When FISH was performed on these fractions, trisomy 8 cells were consistently present in the TUNEL+ fraction (A). When control (nonirradiated) and irradiated lymphocyte-depleted BMMNCs were placed in short-term methylcellulose culture for 2 weeks the numbers of diploid colonies decreased to a greater extent than the numbers of trisomy 8 colonies (B). When an inhibitor of c-myc was cocultured with BMMNCs from a patient with trisomy 8, and immunoblotted, and FISH performed after 2 weeks of growth, there was a substantial decrease in the number of trisomy 8 cells coincident with a decrease in c-myc protein (C). BMMNCs transfected with siRNA specific for survivin were placed in hematopoietic growth factors for 36 hours at 37°C as described in “Materials and methods.” FISH and cell enumeration were performed before, and following culture using a labeled probe for chromosome 8. Immunoblotting was performed on total-cell lysates using antibody to survivin. (D) A substantial loss of trisomy 8 cells is seen compared with the baseline.
Resistance of trisomy 8 cells to apoptosis is abrogated by knock-down of c-myc and survivin.Trisomy 8 BM was subjected to 25 Gy of gamma radiation and cultured for 1 hour in media as described in “Materials and methods.” The TUNEL assay was performed to identify DNA nicks and TUNEL+ and TUNEL− fractions sorted for both irradiated and nonirradiated fractions. The numbers of viable cells were decreased in the irradiated fraction, and the TUNEL+ cells increased from 18% to 30%. When FISH was performed on these fractions, trisomy 8 cells were consistently present in the TUNEL+ fraction (A). When control (nonirradiated) and irradiated lymphocyte-depleted BMMNCs were placed in short-term methylcellulose culture for 2 weeks the numbers of diploid colonies decreased to a greater extent than the numbers of trisomy 8 colonies (B). When an inhibitor of c-myc was cocultured with BMMNCs from a patient with trisomy 8, and immunoblotted, and FISH performed after 2 weeks of growth, there was a substantial decrease in the number of trisomy 8 cells coincident with a decrease in c-myc protein (C). BMMNCs transfected with siRNA specific for survivin were placed in hematopoietic growth factors for 36 hours at 37°C as described in “Materials and methods.” FISH and cell enumeration were performed before, and following culture using a labeled probe for chromosome 8. Immunoblotting was performed on total-cell lysates using antibody to survivin. (D) A substantial loss of trisomy 8 cells is seen compared with the baseline.
Knockdown of survivin with siRNA and c-myc inhibition both result in loss of viability of trisomy 8 cells
In order to confirm the importance of survivin in blockade of apoptosis in trisomy 8 cells, siRNA for survivin was used to “knock down” survivin expression, and immunoblot was performed to confirm decreased survivin expression. Control and siRNA-transfected BMMNCs from 2 patients with trisomy 8 were cultured for 36 hours in hematopoietic growth factors. Cell viability and count were obtained, and FISH for chromosome 8 was performed. Culture of BMMNCs with c-myc inhibitor Int-H1-S6A, F8A resulted in specific loss of trisomy 8 cell viability (Figure 7C). Similarly, knockdown of survivin resulted in decreased trisomy 8 viability without affecting diploid cells (Figure 7D).
Discussion
In previous studies, we demonstrated that trisomy 8 cells showed a proliferative advantage over cells of normal karyotype from the same patient when cultures were depleted of lymphocytes or when Fas antagonist was added.2 We also found that caspase 8 was activated preferentially in trisomy 8 cells,2 and demonstrated that patients had cytotoxic T cells that appeared to be specific for the trisomy 8 clone. In the current work, we show that trisomy 8 cells have up-regulation of c-myc and CD1 by real-time PCR and further demonstrate that survivin, an inhibitor of apoptosis (IAP), is up-regulated. Knockdown of survivin and inhibition of c-myc resulted in selective loss of viability of the trisomy 8 cells. We go on to show that these cells fail to undergo DNA degradation and cell death, despite evidence of apoptosis. Paradoxically, the annexin+ cells had a comparable capacity for colony formation to annexin− cells. Trisomy 8 cells appeared to be less susceptible to the apoptosis resulting from ionizing radiation than diploid cells and were also less susceptible to the effects of growth factor withdrawal (data not shown). Knockdown of survivin, an IAP, eliminated the survival advantage of trisomy 8 cells in culture.
Under normal conditions, apoptosis has been considered inevitable once the process is initiated and annexin is bound; however, some leukemia cells and cardiomyopathic cardiac myocytes show evidence of uncoupling of caspase 3 activation from the late stages of apoptosis of DNA disintegration and cell death.23,24 Uncoupling of caspase 8 activation and changes in mitochondrial membrane potential and cell death has also been ascribed to activation of IAPs such as survivin in some leukemia cells.25 In trisomy 8 cells, increases in c-myc might be expected to result in up-regulation of survivin26 as well as cyclin D protein synthesis rates.27 C-myc is located on chromosome 8, and its overexpression in trisomy 8 is likely a consequence of a “dosage effect” also described previously in studies of trisomy 8 leukemias.28 Overexpression of c-myc, and subsequently survivin29,30 and CD1,31,32 would be expected to act to increase the proliferation and survival of trisomy 8 cells and could explain the apparent survival advantage of trisomy 8 cells in a bone marrow under immune attack. Levels are all increased in our trisomy 8 patients while they were not increased in patients with MDS who had other cytogenetic abnormalities. There are a number of reasons why survivin expression may not have completely correlated with the up-regulation of c-myc and CD1. Other factors controlling surviving, including the cell's commitment to erythroid versus myeloid development,33 and the exposure of cells to cytokines (survivin expression is up-regulated by hematopoietic cytokines thrombopoietin, Flt3 ligand, and stem cell factor).34 Expression of survivin is also cell-cycle related, the highest being during G2/M.
That trisomy 8 is one of the most common cytogenetic abnormalities evolving in aplastic anemia may be due to the relative proliferative advantage and resistance to apoptosis of trisomy 8 cells in BM under immune attack.
Authorship
Conflict-of-interest statement: The authors declare no competing financial interests.
Correspondence: Elaine Sloand, National Heart, Lung and Blood Institute, National Institutes of Health, 9000 Rockville Pike, Bldg 10, Rm 7C108, Bethesda, MD 20892; e-mail: sloande@nhlbi.nih.gov.
The publication costs of this article were defrayed in part by page charge payment. Therefore, and solely to indicate this fact, this article is hereby marked “advertisement” in accordance with 18 USC section 1734.


This feature is available to Subscribers Only
Sign In or Create an Account Close Modal