Abstract
The transcription factor Gata1 is required for the development of erythrocytes and megakaryocytes. Previous studies with a complementation rescue approach showed that the zinc finger domains are required for both primitive and definitive hematopoiesis. Here we report a novel zebrafish gata1 mutant with an N-ethyl-N-nitrosourea–induced point mutation in the C-finger (gata1T301K). The Gata1 protein with this mutation bound to its DNA target sequence with reduced affinity and transactivated inefficiently in a reporter assay. gata1T301K/T301K fish had a decreased number of erythrocytes during primitive hematopoiesis but normal adult hematopoiesis. We crossed the gata1T301K/T301K fish with those carrying the R339X mutation, also known as vlad tepes (vlt), which abolishes DNA binding and transactivation activities. As we reported previously, gata1vlt/vlt embryos were “bloodless” and died approximately 11 to 15 days after fertilization. Interestingly, the gata1T301K/vlt fish had nearly a complete block of primitive hematopoiesis, but they resumed hematopoiesis between 7 and 14 days after fertilization and grew to phenotypically normal fish with normal adult hematopoiesis. Our findings suggest that the impact of Gata1 on hematopoiesis correlates with its DNA-binding ability and that primitive hematopoiesis is more sensitive to reduction in Gata1 function than definitive hematopoiesis.
Introduction
GATA1 is a transcription factor that plays a key role in hematopoiesis. GATA1 binds to the consensus (T/A)GATA(A/G) DNA sequence, found in the regulatory regions of almost all erythroid-specific genes, to either activate or repress transcription.1 Mammalian GATA1 is essential for erythropoiesis. In vitro and in vivo studies in mice2,3 have demonstrated that GATA1 is required for the maturation of proerythroblasts. Gata1-null embryos die by embryonic day 10.5 (E10.5) as the result of severe defects in erythropoiesis during primitive hematopoiesis. In addition, GATA1 plays a critical role during differentiation of megakaryocytes, eosinophils, and mast cells.4
Studies in which the authors used a knockdown mouse model, which was generated by deleting a cis-regulatory element of the Gata1 gene, have suggested a correlation between the levels of Gata1 expression and the severity of the phenotype. Mouse embryos in whom Gata1 expression is reduced to 5% of its normal levels by an erythroid promoter-specific knockdown, which is referred to as GATA-1.05, die around E11.5 as the result of an arrest in both primitive and definitive erythropoiesis.5 Mice carrying “knockdown” Gata1 mutations that resulted in a 4- to 5-fold reduction of Gata1 in erythrocytes were defective in both primitive and definitive hematopoiesis. Although most of the male mice carrying the “knockdown” mutation died around E13.5 to E14.5, a small percentage of them were born and survived to adulthood.6 These studies suggest the importance of Gata1 dosage in hematopoiesis.
The GATA1 protein contains 2 zinc fingers. The N-finger is involved in binding to FOG-1 in addition to contributing to DNA binding.7 Studies of Fog-1−/− mice as well as knockin mice expressing a GATA1 protein with reduced FOG-1 binding demonstrated that the FOG-1 interaction is critical for GATA1 function in erythrocyte and megakaryocyte developments.8,9 By using a complementation rescue approach, Shimizu et al10 demonstrated that GATA1 proteins with deletion of either finger were unable to rescue hematopoietic defects in the GATA-1.05 mice, suggesting that both zinc fingers are required for the hematopoietic functions of GATA1.
Zebrafish provide an alternate model system to study hematopoiesis because of their optical clarity and because of researchers' ability to perform genetic screens in them.11,12 One notable characteristic of zebrafish is the ability of embryos to survive for many days without circulating erythrocytes, probably because they can obtain oxygen through diffusion.13 Thus, it is possible to study the initiation of hematopoiesis at later stages despite defects in early stages in the zebrafish model. Similar to mammals, zebrafish hematopoiesis takes place at different locations. Primitive hematopoiesis occurs in the intermediate cell mass (ICM).14 Definitive hematopoiesis occurs in the kidney and thymus after transient development in the aorta-gonad-mesonephros (AGM) and caudal hematopoietic tissue (CHT) regions of the developing embryo.15-18 Orthologs of all major transcription factors that are important for mammalian hematopoiesis have been identified in the zebrafish, and many of them seem to function in a similar way.19
We have identified a truncation mutation R339X in gata1 in the bloodless mutant, vlad tepes (vlt).20 vlt embryos are devoid of erythrocytes from the beginning of circulation at 26 hours postfertilization (hpf), suggesting that gata1 is required for primitive hematopoiesis, which is consistent with findings in Gata1 knockout mice. The fact that vlt embryos survive and grow for at least 14 days (see below) even without circulating erythrocytes prompted us to generate additional gata1 mutants to determine whether different levels of Gata1 activity have any effect on specific stages of hematopoiesis. We were particularly interested in determining whether the DNA binding domain (the C-finger) is equally required during primitive and definitive hematopoiesis.
We screened F1 zebrafish males generated from N-ethyl-N-nitrosourea–mutagenized founders for mutations in the C-finger of gata1 by genomic resequencing.21 We identified 2 additional mutant gata1 alleles in zebrafish (gata1T301K and gata1K333R), and we characterized fish carrying these mutations. The phenotype of the gata1 mutant fish suggests that primitive hematopoiesis is more sensitive to decreased Gata1 function than definitive hematopoiesis.
Methods
Zebrafish
Zebrafish were maintained under an approved National Institutes of Health Animal Care and Use Committee protocol for animal use. All zebrafish handling, breeding, and staging were performed as described.22 The mutations were studied and maintained in the EK genetic background.
Resequencing and mutation identification
Genomic organization of zebrafish gata1 gene was determined by the use of National Center for Biotechnology Information and Sanger Center databases. Sequencing of exons 4 to 6 coding for C-terminal region of Gata1, data analysis, and in vitro fertilization to recover the mutations were performed as described.21
DNA extraction and genotyping
DNA from embryos and fin clips of adult fish was extracted by the use of the DNeasy kit (Qiagen). Genotyping was performed by polymerase chain reaction (PCR) and sequencing for gata1 T301K and K333R mutations and Taq1 digestion of PCR products for vlad tepes.
Computer modeling
Protein structure modeling was based on the NMR solution structure of a 60 amino acid fragment of the chicken GATA1 DNA binding domain (pdb 1GAT).23 The chicken and zebrafish sequences share 82% residue identity over the region modeled. Modeling was performed by the use of the MODELLER package24 with high optimization, as implemented within Discovery Studio (Accelrys).
Whole-mount RNA in situ hybridization and o-dianisidine staining
Embryos at various stages of development were fixed in 4% paraformaldehyde. Antisense mRNA probes for gata1, band3, draculin, gata2, αe1, and αe212 were generated by the use of UTP-digoxigenin (Roche), and in situ hybridization was performed by the use of standard methods.20 Antisense mRNA probes for l-plastin and mpo were generated by the use of either UTP-digoxigenin (Roche) or UTP-fluorescein (Roche). Double in situ hybridization was performed as described.25 Embryos were stained with o-dianisidine to detect hemoglobin as described.26
Electrophoretic mobility shift assay
Zebrafish gata1 cDNA with either T301K or K333R mutations were cloned into pCDNA3.1 (Invitrogen) by reverse-transcription (RT)–PCR from RNA extracted from embryos. cDNA clones of zebrafish gata1 wild-type and vlad tepes used in this study have been previously described.20 Electrophoretic mobility shift assay was performed by the use of in vitro–translated proteins from these constructs and 32P-labeled probes as described.20
Transactivation assay
293T cells were transfected with 200 ng of the firefly luciferase reporter plasmid,27 1 μg of either the gata1 expression plasmids or empty vector (pcDNA3.1), and 10 ng of the plasmid expressing Renilla luciferase (Promega) to normalize for transfection efficiency. Transfections were performed by the use of Lipofectamine 2000 Reagent (Invitrogen), and cells were assayed for luciferase activity 48 hours after transfection by the use of the Dual Luciferase Assay (Promega). The relative luciferase activity was calculated as described.27
Quantitative RT-PCR
Total RNA was isolated from a pool of 20 embryos at approximately 48 hours after fertilization by the use of RNA STAT60-TM (Tel-Test Inc). A total of 1 μg of total RNA was reverse transcribed into cDNA by the use of the SuperScriptTM (Invitrogen). Quantitative (q)RT-PCR for hemoglobin βe1 and band3 was performed by the use of SYBR GreenER (Invitrogen), following the manufacturer's recommendation. ef1α was used as endogenous control. Primers used in the qRT-PCR were as follows: βe1 (5′-TGGCAAGGTGTCTTATCGTG-3′; 5′-TCAGCCAAAAGCCTGAAGTT-3′); band3 (5′-CCTTCCATTTGGTGGTATGG-3′; 5′-TCATCTCAGAGACCCCCATC-3′); ef1α (5′-CGGTGACAACATGCTGGAGG-3′; 5′-ACCAGTCTCCACACGACCCA-3′).
gata2 knockdown by morpholino
Approximately 200 fertilized 1- to 2-cell stage embryos from a gata1+/T301K × gata1T301K/T301K cross and a gata1+/+ incross were microinjected with gata2 morpholino as described.28 Injected and uninjected control embryos were screened for reduction in blood circulation at around 72 hours after injection. Embryos with normal or reduced blood circulation were separated in groups and genotyped.
Microscopy and imaging
Embryos were observed with a Leica MZ16f dissecting scope equipped with UV light and fluorescent filters. The pictures were taken with a Leica DC500 camera with Leica FireCam (Version 1.7.1). The real-time videos were taken with a Qimaging Rolera-XR cooled mono-12 bit CCD camera with iVision-Mac (Version 4.0.1) from BioVision Technologies. Cytospin preparations were photographed by use of a Zeiss upright Axioskop2 floor microscope with a Hamamatsu CCD camera. Images were acquired with a 100× Plan Apochromat 1.4NA DIC objective lens and collected with an iVision-Mac (version 4.0.1) from BioVision Technologies.
Fluorescence-activated cell-sorting analysis
Embryos were dissociated in a trypsin/EDTA (ethylenediaminetetraacetic acid) solution (0.2% trypsin/1mM EDTA), washed, and resuspended in ice-cold 0.9× phosphate-buffered saline plus 5% fetal bovine serum. Green fluorescent protein (GFP)–expressing cells were analyzed by the use of the BD LSRII and sorted with a FACSVantage flow cytometer (Becton Dickinson). Single-cell suspensions from adult whole kidney marrow were prepared and analyzed by the use of the BD LSRII as described.29 Sorted cells were collected by cytocentrifuge and stained with May-Giemsa.
Results
Identification of novel gata1 mutations in zebrafish by sequence-based screening
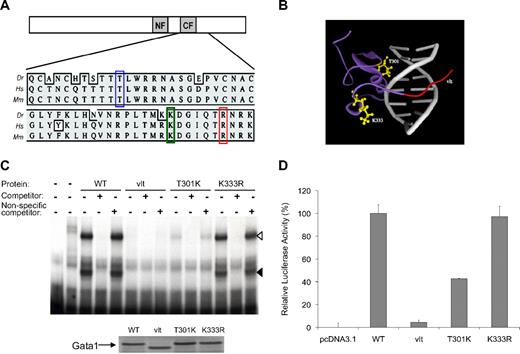
We have previously identified vlad tepes, a nonsense mutation (R339X) located C-terminal to the zinc fingers of gata1 that prevented Gata1 from binding to the DNA and mediating transactivation.20 To identify additional mutations that would impair the DNA binding ability of Gata1, we screened DNA samples of F1 male fish generated from N-ethyl-N-nitrosourea–mutagenized founder fish for the gata1 C-terminal region, including the 2 zinc finger domains (exons 4-6, encoding amino-acid residues 234-418), by genomic PCR and sequencing.21 After screening 1235 F1 male samples, we identified 2 missense mutations that resulted in the substitution of a threonine (T) residue by a lysine (K) at position 301 (T301K) and a lysine (K) by an arginine (R) at position 333 (K333R), respectively (Figure 1A). In vitro fertilization was then used to revive fish lines carrying these 2 mutations.
Characterization of gata1 mutations: T301K, K333R, and vlt. (A) Schematic representation of Gata1 protein with N- and C-zinc fingers marked as NF and CF, respectively. Multispecies alignment of the region containing the mutations: T301K (blue box), K333R (green box), and vlt (R339X, red box). Dr indicates zebrafish; Hs, human; Mm, mouse. (B) Shown is a 3-dimensional protein model of the zebrafish Gata1 C-terminal zinc finger domain. The ribbon structure depicts a 60 amino acid fragment of the zebrafish Gata1 protein (purple) bound to DNA (gray). The location of substituted residues (T301 and K333; yellow ball-and-stick) and the region truncated in vlad tepes (vlt; red) are indicated. Residue T301 is in close proximity to the DNA backbone of the major groove, suggesting its missense mutation may alter DNA binding. In contrast, the side chain of residue K333 points outward from an extended loop, an orientation that may be tolerant of conservative substitution. (C) DNA-binding activity of wild-type (WT) and mutant forms of Gata1 as determined by electrophoretic mobility shift assay with a 32P-labeled probe for a β/ϵ globin promoter sequence and in vitro–translated proteins. The DNA–protein complexes are seen as slower migrating bands marked by black and white arrowheads. The first lane on the left contains only the probe, and the next lane also contains lysate but no Gata1 protein. Similar amounts of the Gata1 proteins were used in the experiments, as demonstrated by the Western blot (bottom). (D) Transcriptional activity of mutant forms of Gata1 relative to the wild-type (WT) Gata1 protein as measured by a Dual Luciferase Assay. T301K substitution reduced the ability of Gata1 to activate transcription in vitro, whereas K333R substitution did not affect Gata1 activity in vitro.
Characterization of gata1 mutations: T301K, K333R, and vlt. (A) Schematic representation of Gata1 protein with N- and C-zinc fingers marked as NF and CF, respectively. Multispecies alignment of the region containing the mutations: T301K (blue box), K333R (green box), and vlt (R339X, red box). Dr indicates zebrafish; Hs, human; Mm, mouse. (B) Shown is a 3-dimensional protein model of the zebrafish Gata1 C-terminal zinc finger domain. The ribbon structure depicts a 60 amino acid fragment of the zebrafish Gata1 protein (purple) bound to DNA (gray). The location of substituted residues (T301 and K333; yellow ball-and-stick) and the region truncated in vlad tepes (vlt; red) are indicated. Residue T301 is in close proximity to the DNA backbone of the major groove, suggesting its missense mutation may alter DNA binding. In contrast, the side chain of residue K333 points outward from an extended loop, an orientation that may be tolerant of conservative substitution. (C) DNA-binding activity of wild-type (WT) and mutant forms of Gata1 as determined by electrophoretic mobility shift assay with a 32P-labeled probe for a β/ϵ globin promoter sequence and in vitro–translated proteins. The DNA–protein complexes are seen as slower migrating bands marked by black and white arrowheads. The first lane on the left contains only the probe, and the next lane also contains lysate but no Gata1 protein. Similar amounts of the Gata1 proteins were used in the experiments, as demonstrated by the Western blot (bottom). (D) Transcriptional activity of mutant forms of Gata1 relative to the wild-type (WT) Gata1 protein as measured by a Dual Luciferase Assay. T301K substitution reduced the ability of Gata1 to activate transcription in vitro, whereas K333R substitution did not affect Gata1 activity in vitro.
The T301K substitution results in reduced DNA binding and transactivation by Gata1
Both substitutions are located in the C-finger required for Gata1 binding to the GATA consensus sequence, and the replaced residues are conserved between zebrafish and mammals (Figure 1A). Molecular modeling indicates that T301 is located on the surface of Gata1 that interacts with the major groove of DNA, whereas K333 resides in a loop that is away from DNA (Figure 1B). Thus, we hypothesized that the T301K mutation affects the DNA binding activity of Gata1. By electrophoretic mobility shift assay, we determined that, although the K333R substitution had no apparent effect on DNA binding, the DNA binding activity of Gata1 was indeed reduced by the T301K substitution (Figure 1C). Specifically, we observed that although the wild-type Gata1 protein showed 2 shifted DNA–protein complexes, the T301K protein showed only the slower migrating complex (white arrowhead, Figure 1C), which was less intense than the wild-type Gata1 protein. By densitometry we estimated the intensity of the Gata1–DNA complex for T301K to be approximately 17% of the wild-type Gata1 protein. Consistent with their DNA binding activity levels, transcriptional activity of the T301K Gata1 protein was reduced whereas that of the K333R Gata1 protein was normal in reporter assays (Figure 1D).
Dose-dependent requirement of Gata1 DNA binding activity in primitive hematopoiesis
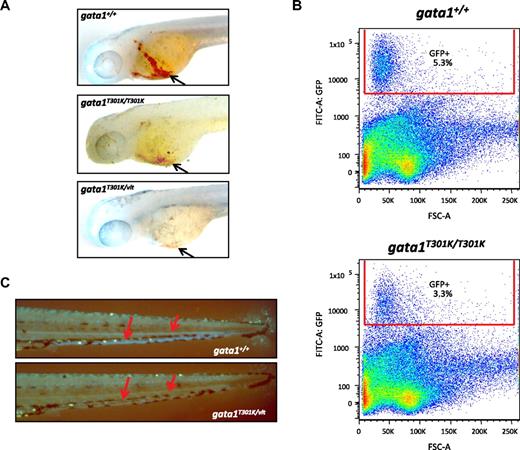
To investigate the in vivo effects of T301K substitution, we generated gata1T301K/T301K embryos and monitored their status of hematopoiesis by visually examining their circulating blood cells and by observing GFP+ cells after crossing to the Tg(gata1:GFP) transgenic fish.30 Daily microscopic observations of gata1T301K/T301K embryos from the onset of circulation at ∼ 26 hours postfertilization (hpf) revealed that they had circulating erythrocytes. However, gata1T301K/T301K embryos had reduced numbers of erythrocytes compared with the wild-type, as revealed by o-dianisidine staining and Fluorescence-activated cell-sorting (FACS) analysis of Tg(gata1:GFP); gata1T301K/T301K embryos (Figures 2A-B). We found that in Tg(gata1:GFP); gata1T301K/T301K embryos the number of GFP-expressing cells was reduced to approximately 62% of the wild-type (Figure 2B).
Effect of lower Gata1 DNA binding activity on erythropoiesis in gata1T301K/vlt and gata1T301K/T301K embryos. (A) o-dianisidine staining for hemoglobin (black arrows) to show the reduction or absence of erythrocytes in gata1T301K/T301K (n = 10/10) and gata1T301K/vlt (n = 10/10) embryos, respectively, compared with the wild-type (n = 0/20) embryos at 2 dpf. (B) Percentage of GFP+ cells in 3 dpf wild-type and gata1T301K/T301K embryos carrying Tg(gata1:GFP). Fifty to 60 embryos from each genotype were pooled, dissociated, and subjected to flow cytometric analysis. gata1T301K/T301K embryos showed a 38% reduction in the percentage of GFP+ cells compared with the wild-type. (C) Tg(gata1:GFP) as a marker for erythrocytes (red arrows point to the GFP+ cells seen in circulation) to show the absence of erythrocytes in the gata1T301K/vlt embryo (bottom, n = 25/25) compared with the wild-type embryo (top, n = 0/30) at 4 dpf. Original magnification ×50 (A,C).
Effect of lower Gata1 DNA binding activity on erythropoiesis in gata1T301K/vlt and gata1T301K/T301K embryos. (A) o-dianisidine staining for hemoglobin (black arrows) to show the reduction or absence of erythrocytes in gata1T301K/T301K (n = 10/10) and gata1T301K/vlt (n = 10/10) embryos, respectively, compared with the wild-type (n = 0/20) embryos at 2 dpf. (B) Percentage of GFP+ cells in 3 dpf wild-type and gata1T301K/T301K embryos carrying Tg(gata1:GFP). Fifty to 60 embryos from each genotype were pooled, dissociated, and subjected to flow cytometric analysis. gata1T301K/T301K embryos showed a 38% reduction in the percentage of GFP+ cells compared with the wild-type. (C) Tg(gata1:GFP) as a marker for erythrocytes (red arrows point to the GFP+ cells seen in circulation) to show the absence of erythrocytes in the gata1T301K/vlt embryo (bottom, n = 25/25) compared with the wild-type embryo (top, n = 0/30) at 4 dpf. Original magnification ×50 (A,C).
We then generated gata1T301K/vlt embryos to investigate whether a reduction in T301K gata1 dosage would affect hematopoiesis. Similar to the gata1vlt/vlt embryos, most gata1T301K/vlt embryos had no circulating blood cells at the onset of circulation (Figure 2A and C; supplemental Video 1, available on the Blood website; see the Supplemental Materials link at the top of the online article), whereas a few embryos had significantly reduced number of circulating blood cells, which appeared to be immature progenitor cells (data not shown). The more severe phenotype of gata1T301K/vlt embryos compared with gata1T301K/T301K indicates that gata1T301K is a hypomorphic allele. Because Gata1 is also implicated in megakaryocyte differentiation, we crossed the vlad tepes and T301K mutations into a Tg(cd41:GFP) transgenic line because cd41 is expressed by thrombocytes in circulation.31 Compared with the wild-type embryos, the number of circulating thrombocytes was reduced in both gata1vlt/vlt (data not shown) and bloodless gata1T301K/vlt embryos (supplemental Video 2). gata1K333R/K333R and gata1K333R/vlt embryos did not display any hematopoietic defects (data not shown), consistent with the findings that the K333R substitution did not affect DNA binding or transactivation. Thus, both gata1vlt/vlt and gata1T301K/vlt embryos lacked primitive hematopoiesis, whereas gata1T301K/T301K embryos had reduced primitive hematopoiesis. These results suggest that there is a dose-dependent requirement for Gata1 DNA binding activity to sustain primitive hematopoiesis.
Erythrocyte maturation is blocked in gata1T301K/vlt embryos during primitive hematopoiesis
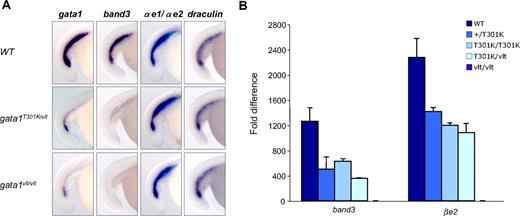
To determine how different levels of Gata1 DNA binding activity affect primitive erythropoiesis, we examined the expression of the erythroid markers band3, draculin, and 2 embryonic α-globin genes (αe1 and αe2) in the zebrafish mutants by RNA in situ hybridization. Consistent with their lack of blood, expression of band3 was reduced in gata1T301K/vlt and gata1vlt/vlt embryos at 15 to 18 somites (Figure 3A), with more severe reduction in the latter. However, the expression pattern of the αe globins and draculin, which are earlier markers of erythropoiesis, was not altered in gata1T301K/vlt and gata1vlt/vlt embryos at around 15 to 18 somites (Figure 3A). All of these erythroid markers maintained similar expression pattern at 21 to 25 somites (data not shown). These results suggest that during primitive hematopoiesis, erythrocyte maturation is similarly blocked in both gata1vlt/vlt and gata1T301K/vlt embryos. In addition, these results indicate that erythroid genes respond differently to reductions in Gata1 DNA binding activity. Interestingly the expression level of gata1 itself was also decreased in both gata1T301K/vlt embryos and gata1vlt/vlt embryos, with more severe reduction in the latter (Figure 3A).
Expression of hematopoietic genes in gata1 mutant embryos by whole-mount RNA in situ hybridization and qRT-PCR. Lateral views of embryos with the tails to the left and dorsal to the top. (A) In situ hybridization showing the differential expression pattern of the erythroid markers band3, α-globin embryonic forms 1 (αe1) and 2 (αe2), draculin, and gata1 in 15-18 somites gata1T301K/vlt (band3, n = 16/16; globins, n = 6/6; draculin, n = 5/5; gata1, n = 9/9), gata1vlt/vlt (band3, n = 8/8; globins, n = 6/6; draculin, n = 5/5; gata1, n = 8/8) and wild-type (band3, n = 6/6; globins, n = 10/10; draculin, n = 13/13; gata1, n = 10/10) embryos. Original magnification ×80. Individual embryos were imaged and genotyped by PCR followed by Taq1 digestion (vlt) or sequencing (T301K). (B) qRT-PCR of Gata1 target genes band3 and βe2 in 40 hpf wild-type, gata1+/T301K, gata1T301K/T301K, and gata1vlt/vlt embryos. Data represents fold change in expression relative to gata1vlt/vlt. Twenty embryos from each genotype were pooled for RNA extraction and qRT-PCR.
Expression of hematopoietic genes in gata1 mutant embryos by whole-mount RNA in situ hybridization and qRT-PCR. Lateral views of embryos with the tails to the left and dorsal to the top. (A) In situ hybridization showing the differential expression pattern of the erythroid markers band3, α-globin embryonic forms 1 (αe1) and 2 (αe2), draculin, and gata1 in 15-18 somites gata1T301K/vlt (band3, n = 16/16; globins, n = 6/6; draculin, n = 5/5; gata1, n = 9/9), gata1vlt/vlt (band3, n = 8/8; globins, n = 6/6; draculin, n = 5/5; gata1, n = 8/8) and wild-type (band3, n = 6/6; globins, n = 10/10; draculin, n = 13/13; gata1, n = 10/10) embryos. Original magnification ×80. Individual embryos were imaged and genotyped by PCR followed by Taq1 digestion (vlt) or sequencing (T301K). (B) qRT-PCR of Gata1 target genes band3 and βe2 in 40 hpf wild-type, gata1+/T301K, gata1T301K/T301K, and gata1vlt/vlt embryos. Data represents fold change in expression relative to gata1vlt/vlt. Twenty embryos from each genotype were pooled for RNA extraction and qRT-PCR.
To measure more accurately the response of erythroid genes to changes in Gata1 DNA binding activity, we performed qRT-PCR for band3 and βe1 expression in 40 hpf wild-type, gata1+/T301K, gata1T301K/T301K, gata1T301K/vlt, and gata1vlt/vlt embryos (Figure 3B). As expected, the highest expression level of band3 and βe1 was observed in wild-type embryos, whereas the lowest expression was observed in gata1vlt/vlt. The expression levels of these 2 genes in gata1+/T301K, gata1T301K/T301K, and gata1T301K/vlt embryos followed the trend of the DNA binding activities of the encoded Gata1 proteins; however, we did not observe a perfect correlation (Figure 3B).
Reduced Gata1 DNA binding activity does not affect definitive hematopoiesis
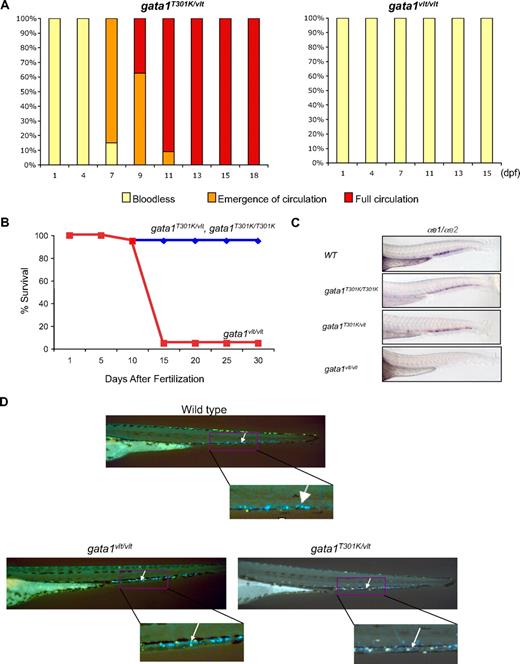
By daily microscopic examination we observed that, interestingly, the initially “bloodless” gata1T301K/vlt embryos gradually regained circulating erythrocytes starting at 6 days postfertilization (dpf) and survived normally to adulthood (Figure 4A-B). In contrast, gata1vlt/vlt embryos never recovered circulating erythrocytes and died between 8 and 15 dpf (Figures 4A-B).20 RNA in situ hybridization of αe1 and αe2 globins at 48 hpf showed that globin expression was absent in the CHT region in the gata1vlt/vlt embryos (Figure 4C). In contrast, the majority of the gata1T301K/vlt embryos maintained globin expression in CHT, which was comparable with wild-type and gata1T301K/T301K embryos (Figure 4C). Similarly, Tg(cd41:GFP); gata1T301K/vlt embryos regained circulating cd41-GFP+ thrombocytes along with the erythrocytes, and their number was similar to that in the wild-type embryos by approximately 10 dpf (supplemental Video 3), whereas gata1vlt/vlt embryos never regained circulating thrombocytes (data not shown). The data suggest that gata1T301K/vlt embryos regained definitive hematopoiesis but gata1vlt/vlt embryos could not.
Rescue of hematopoiesis in gata1T301K/vlt embryos. (A) Recovery of blood circulation in gata1T301K/vlt embryos between 7 and 13 dpf. gata1vlt/vlt embryos were bloodless and never recovered blood circulation. Twenty embryos of each genotype were monitored daily. (B) Survival curves of gata1T301K/vlt and gata1T301K/T301K (blue) and gata1vlt/vlt (red) embryos from fertilization to 30 dpf. Twenty embryos of each genotype were monitored daily. (C) Lateral views of the tails of 48 hpf embryos after RNA in situ hybridization with erythroid markers α-globin embryonic forms 1 (αe1) and 2 (αe2), showing the absence of globin expression in the CHT region of gata1vlt/vlt embryos (n = 14/14) and relatively normal globin expression in gata1T301K/vlt (n = 7/9), gata1T301K/T301K (n = 4/4), and wild-type (n = 8/8) embryos. (D) Noncirculating cd41-GFPlow cells in the CHT (white arrows, right inset) of 4 dpf embryos. No significant difference was detected in this cell population in gata1vlt/vlt (n = 15/15) and gata1T301K/vlt (n = 25/25) embryos compared with the wild-type embryos (n = 30/30). Original magnifications ×80 (C) and ×50 (D).
Rescue of hematopoiesis in gata1T301K/vlt embryos. (A) Recovery of blood circulation in gata1T301K/vlt embryos between 7 and 13 dpf. gata1vlt/vlt embryos were bloodless and never recovered blood circulation. Twenty embryos of each genotype were monitored daily. (B) Survival curves of gata1T301K/vlt and gata1T301K/T301K (blue) and gata1vlt/vlt (red) embryos from fertilization to 30 dpf. Twenty embryos of each genotype were monitored daily. (C) Lateral views of the tails of 48 hpf embryos after RNA in situ hybridization with erythroid markers α-globin embryonic forms 1 (αe1) and 2 (αe2), showing the absence of globin expression in the CHT region of gata1vlt/vlt embryos (n = 14/14) and relatively normal globin expression in gata1T301K/vlt (n = 7/9), gata1T301K/T301K (n = 4/4), and wild-type (n = 8/8) embryos. (D) Noncirculating cd41-GFPlow cells in the CHT (white arrows, right inset) of 4 dpf embryos. No significant difference was detected in this cell population in gata1vlt/vlt (n = 15/15) and gata1T301K/vlt (n = 25/25) embryos compared with the wild-type embryos (n = 30/30). Original magnifications ×80 (C) and ×50 (D).
cd41 is also a marker of hematopoietic stem cells32 and in the Tg(cd41:GFP) zebrafish embryos, hematopoietic stem cells are detected as GFPlow stationary cells in the CHT, AGM, kidney, and thymus.18,33 We did not observe any difference in the number of GFPlow stationary cells in these locations in gata1vlt/vlt and gata1T301K/vlt embryos compared with their wild-type clutchmates (Figure 4D). In addition, the expression of another marker for early progenitors of definitive hematopoiesis, c-myb, was not impaired in the gata1vlt/vlt and gata1T301K/vlt embryos (data not shown). These results suggest that early stages of definitive hematopoiesis were intact in both gata1 mutants. Together, these data indicate that the gata1T301K/vlt embryos were defective in primitive hematopoiesis resulting in lack of circulating blood cells but were able to initiate relatively normal definitive hematopoiesis. In addition, the phenotype of our gata1 mutants suggests a differential requirement for Gata1 DNA binding and transactivation between primitive and definitive stages of hematopoiesis in zebrafish, where primitive hematopoiesis is more sensitive to reduction in Gata1 function than definitive hematopoiesis.
Gata1 DNA binding level–dependent myeloid expansion
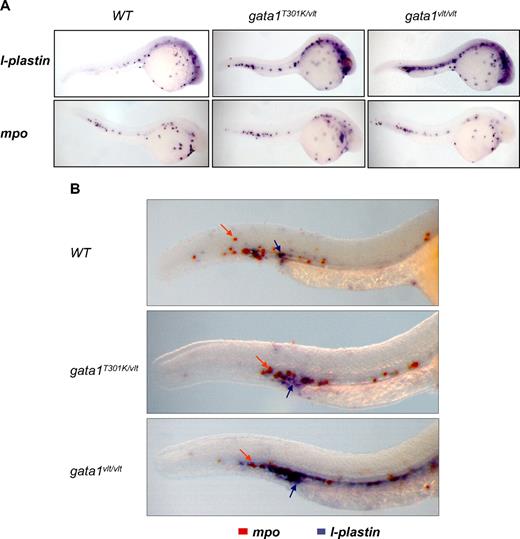
It has been demonstrated previously that blockage of erythropoiesis by loss of gata1 expression leads to an expansion of myelopoiesis.28 Here, we show that this expansion is Gata1 DNA binding level dependent. By using an l-plastin probe, we observed that the number of myeloid cells increased in 24 hpf embryos as Gata1 DNA binding activity level decreased, with greater increase in the gata1vlt/vlt embryos than in the gata1T301K/vlt embryos (Figure 5A). However, this Gata1 DNA binding level–dependent myeloid expansion was not observed when we tested the mpo probe (Figure 5A). This differential effect was confirmed by double in situ hybridization with the l-plastin and mpo probes in the same embryos (Figure 5B). Thus, it appears that during primitive hematopoiesis loss or decrease of Gata1 DNA binding activity affects specifically the monocytes/macrophages population but not the neutrophil lineage.
Gata1 DNA binding level–dependent myeloid expansion. Lateral views of whole embryos with the head to the right and dorsal to the top. (A) Expression pattern of the myeloid markers l-plastin and mpo in 24-26 hpf gata1T301K/vlt (l-plastin, n = 9/9; mpo, n = 5/5), gata1vlt/vlt (l-plastin, n = 2/2; mpo, n = 5/5), and wild-type embryos (l-plastin, n = 6/6; mpo, n = 7/7) showing an expansion of l-plastin expression in the gata1 mutant embryos. (B) Double in situ hybridization showing l-plastin (purple staining, indicated by purple arrows) and mpo (orange staining, indicated by orange arrows) in the ICM/AGM regions of 26-30 hpf gata1T301K/vlt (n = 4/4), gata1vlt/vlt (n = 12/12) and wild-type (n = 12/12) embryos. Original magnifications ×50 (A) and ×115 (B). Individual embryos were imaged and genotyped by PCR followed by Taq1 digestion (vlt) or sequencing (T301K).
Gata1 DNA binding level–dependent myeloid expansion. Lateral views of whole embryos with the head to the right and dorsal to the top. (A) Expression pattern of the myeloid markers l-plastin and mpo in 24-26 hpf gata1T301K/vlt (l-plastin, n = 9/9; mpo, n = 5/5), gata1vlt/vlt (l-plastin, n = 2/2; mpo, n = 5/5), and wild-type embryos (l-plastin, n = 6/6; mpo, n = 7/7) showing an expansion of l-plastin expression in the gata1 mutant embryos. (B) Double in situ hybridization showing l-plastin (purple staining, indicated by purple arrows) and mpo (orange staining, indicated by orange arrows) in the ICM/AGM regions of 26-30 hpf gata1T301K/vlt (n = 4/4), gata1vlt/vlt (n = 12/12) and wild-type (n = 12/12) embryos. Original magnifications ×50 (A) and ×115 (B). Individual embryos were imaged and genotyped by PCR followed by Taq1 digestion (vlt) or sequencing (T301K).
Normal adult hematopoiesis in gata1T301K/vlt fish
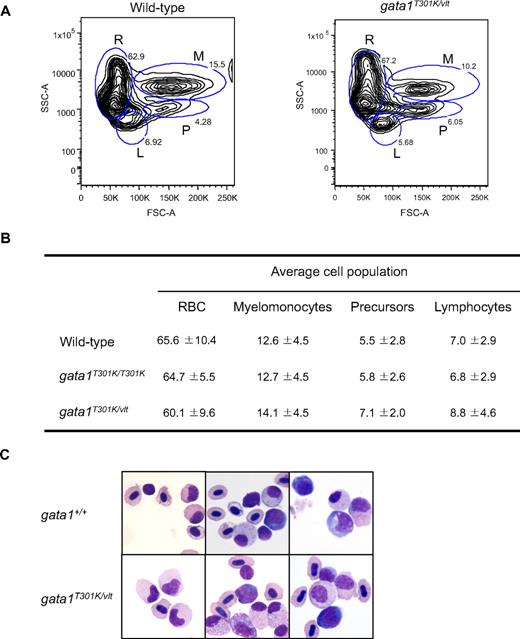
Previous work in zebrafish demonstrated that its major blood cell lineages (erythroid, lymphoid, myeloid, and stem cells/progenitors) could be analyzed and sorted by FACS on the basis of their size and granularity.29 By performing FACS analysis of whole kidney marrow of gata1T301K/T301K and gata1T301K/vlt fish together with age-matched wild-type control samples, we found that adult hematopoiesis was essentially normal in the gata1T301K/vlt (Figure 6A-B) and gata1T301K/T301K fish (data not shown). Morphologically, blood cells of all lineages from the kidneys of the gata1T301K/vlt fish appeared to be normal as well (Figure 6C).
Normal hematopoiesis in adult gata1T301K/vlt fish. (A-B) FACS analysis of adult kidney cells. (A) Representative blood cell profile of whole kidney marrow from wild-type and gata1T301K/vlt adult fish. Blood cell lineages are represented as: R, red blood cells; M, myelomonocytes; P, precursors; and L, lymphocytes. (B) Average cell numbers of each blood cell lineage calculated from 8 wild-type, 5 gata1T301K/T301K, and 5 gata1T301K/vlt fish. The differences in lineage cell numbers observed between wild-type and the mutant fish were not statistically significant. RBC indicates red blood cells. (C) Cytospin preparation from wild-type and gata1T301K/vlt adult fish whole kidney marrow, showing the presence of multilineage cells in the gata1T301K/vlt fish.
Normal hematopoiesis in adult gata1T301K/vlt fish. (A-B) FACS analysis of adult kidney cells. (A) Representative blood cell profile of whole kidney marrow from wild-type and gata1T301K/vlt adult fish. Blood cell lineages are represented as: R, red blood cells; M, myelomonocytes; P, precursors; and L, lymphocytes. (B) Average cell numbers of each blood cell lineage calculated from 8 wild-type, 5 gata1T301K/T301K, and 5 gata1T301K/vlt fish. The differences in lineage cell numbers observed between wild-type and the mutant fish were not statistically significant. RBC indicates red blood cells. (C) Cytospin preparation from wild-type and gata1T301K/vlt adult fish whole kidney marrow, showing the presence of multilineage cells in the gata1T301K/vlt fish.
Gata2 compensates for reduced Gata1 function in primitive hematopoiesis
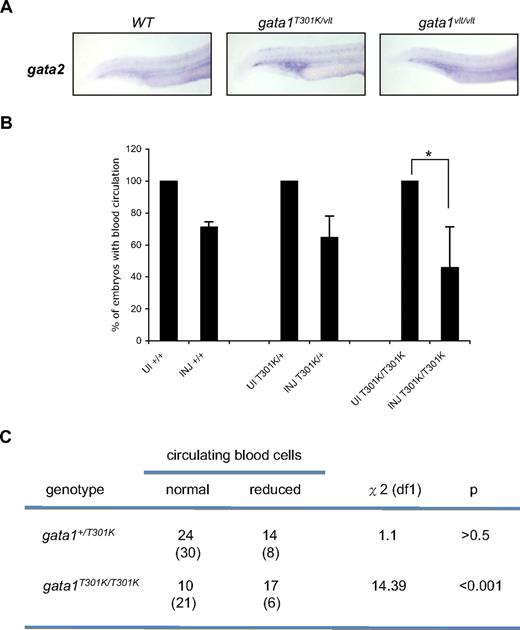
Normally Gata2 is expressed in hematopoietic stem cells and early progenitors, and its expression decreases in the erythroid lineage whereas Gata1 expression increases.34 We noticed that gata2 expression was up-regulated in the hematopoietic tissues in both gata1T301K/vlt and gata1vlt/vlt embryos (Figure 7A), raising the possibility that Gata2 compensated at least partially for the decreased Gata1 function, which could have reduced the severity of the phenotypes in the gata1 mutant embryos. To test this possibility we injected a gata2 morpholino (MO)28 into wild-type, gata1+/T301K, and gata1T301K/T301K embryos and examined blood circulation at 72 hpf. If Gata2 could partially compensate for reduced Gata1 function, knocking down gata2 would induce a more severe hematopoietic defect in the gata1T301K/T301K embryos. As shown in Figure 7B, gata2 MO injection led to reduced circulating blood cells in some embryos of all the genotypes tested, likely because Gata2 is required for the maintenance of early hematopoietic progenitors.34 However, a statistically greater number of gata1T301K/T301K embryos showed reduced blood cells after gata2 MO injection compared with injected wild-type and gata1+/T301K embryos (P < .001; Figure 7C). Together, our data suggest that the Gata2 protein can partially substitute for reduced Gata1 function.
Gata2 knockdown causes a decrease in blood circulation in gata1T301K/T301K embryos during primitive hematopoiesis. (A) gata2 expression in gata1 mutant embryos analyzed by whole-mount RNA in situ hybridization. Lateral views of the embryo tails show gata2 expression in the posterior ICM. Embryos were harvested at 24 hpf. Individual embryos were imaged and genotyped (wild-type, n = 4/4; gata1T301K/vlt, n = 5/7; gata1vlt/vlt, n = 3/3). Original magnification ×50. (B) Bar graphs showing the percentage of wild-type, gata1+/T301K, and gata1T301K/T301K embryos with reduced blood circulation 72 hours after gata2 morpholino injection. There was a significant reduction of gata1T301K/T301K embryos with normal circulation after injection (*). UI indicates uninjected embryos; INJ, gata2 MO injected embryos. (C) By χ2 analysis, the number of injected embryos maintaining normal blood circulation was significantly lower for the gata1T301K/T301K embryos but not for the gata1+/T301K embryos. The numbers shown in parentheses are the numbers of embryos expected for each phenotype based on wild-type data.
Gata2 knockdown causes a decrease in blood circulation in gata1T301K/T301K embryos during primitive hematopoiesis. (A) gata2 expression in gata1 mutant embryos analyzed by whole-mount RNA in situ hybridization. Lateral views of the embryo tails show gata2 expression in the posterior ICM. Embryos were harvested at 24 hpf. Individual embryos were imaged and genotyped (wild-type, n = 4/4; gata1T301K/vlt, n = 5/7; gata1vlt/vlt, n = 3/3). Original magnification ×50. (B) Bar graphs showing the percentage of wild-type, gata1+/T301K, and gata1T301K/T301K embryos with reduced blood circulation 72 hours after gata2 morpholino injection. There was a significant reduction of gata1T301K/T301K embryos with normal circulation after injection (*). UI indicates uninjected embryos; INJ, gata2 MO injected embryos. (C) By χ2 analysis, the number of injected embryos maintaining normal blood circulation was significantly lower for the gata1T301K/T301K embryos but not for the gata1+/T301K embryos. The numbers shown in parentheses are the numbers of embryos expected for each phenotype based on wild-type data.
Discussion
By using our novel zebrafish gata1 mutants, we have demonstrated the differential and activity level–dependent requirements of Gata1 during primitive and definitive hematopoiesis. Our results indicate that one T301K allele, which codes for a DNA binding–deficient Gata1 protein, was not sufficient to support erythrocyte maturation during primitive hematopoiesis but was sufficient for erythropoiesis and thrombopoiesis during definitive hematopoiesis.
This differential Gata1 requirement between primitive and definitive hematopoiesis was not observed in a mouse model, where a 20-fold knockdown of Gata1 expression showed partial or severe impairment of both primitive and definitive hematopoiesis.5 It is likely that the Gata1 DNA binding activity of our gata1T301K/vlt model is within a critical window to reveal such differential requirement. The observation that gata1+/vlt and gata1+/T301K embryos had relatively normal primitive hematopoiesis whereas the gata1T301K/T301K and gata1T301K/vlt embryos had increasingly more severe defects in primitive hematopoiesis favors this explanation, that there is a dose-dependent requirement for Gata1 DNA binding activity to sustain primitive hematopoiesis.
However, a 5-fold knockdown in another mouse model resulted in more severe defects in definitive hematopoiesis than in primitive hematopoiesis.6 The reason for the differential Gata1 requirement between this mouse knockdown model and our zebrafish model is not clear. It is possible that the C-finger mutations analyzed here behave differently from those mouse “knockdowns,” in which the overall expression level was reduced by the hematopoietic promoter or enhancer deletions.5,6 The C-finger mutations affect DNA binding and potentially the interaction with PU.1 as well.35,36 However, the rest of the protein is intact, including the N-finger that interacts with other proteins, including FOG-1.9 This difference between our C-finger mutations and other models with reduced overall Gata1 dosage may also explain why we observed selective expansion of monocytes/macrophages in our gata1 mutants, whereas the previously reported phenotype of gata1 morphants include expansion of both monocytes and granulocytes.28
The mechanism for the recovery of hematopoiesis in the gata1T301K/vlt embryos is not clear. First, it is possible that certain critical target genes respond to Gata1 DNA binding activity changes differently between primitive and definitive hematopoiesis, ie, a subset of genes expressed during primitive hematopoiesis are more sensitive to Gata1 activity reduction.37 A similar situation is the transient embryonic-specific myeloproliferative disorder observed in a mouse knockin model that express the GATA1s mutant, which is missing the N-terminal transactivation domain,38 suggesting that embryonic erythroid progenitors are more sensitive to the GATA1s mutation. Second, it has been suggested that Gata1 and Gata2 may have overlapping functions in hematopoiesis, as demonstrated previously for primitive hematopoiesis in the mouse39 and in our current study for the zebrafish (Figure 7). Our gata2 morpholino data suggest that Gata2 compensates, at least partially, Gata1 in primitive hematopoiesis. It is conceivable that Gata2 can also compensate Gata1 function in definitive hematopoiesis.
The observed lower gata1 expression in the gata1 mutant embryos by in situ hybridization (Figure 3A) may reflect reduced mRNA level or decreased number of erythrocytes expressing gata1. The latter explanation is less likely because the expression level of other erythroid markers such as globin and draculin was not decreased (Figure 3A). The gata1 message in the mutant embryos may be decreased as a result of nonsense mediated decay because the expression level seemed to inversely correlate with the copy number of the vlt allele. In addition, positive autoregulation of the gata1 expression could have been reduced in the mutant embryos because the authors of previous studies40,41 showed that Gata1 self-association, which requires both fingers, is essential for this autoregulation.
Overall, our unique zebrafish model demonstrated differential requirements of Gata1 DNA binding activity level during primitive and definitive hematopoiesis. The most significant findings are the dose-dependent requirement of Gata1 DNA binding activity in primitive hematopoiesis and the fact that reduced Gata1 DNA binding activity does not affect definitive hematopoiesis. The DNA binding activity level of Gata1 has an effect on the transcription levels of its target genes that lead to changes in the differentiation of progenitors into specific lineages. Our zebrafish model thus provides a very useful tool to study the interplay among several transcription factors during embryonic hematopoiesis. Because a mutation that leads to change in GATA1 function/activity, GATA1s, has been associated with greater susceptibility to leukemia in children with Down syndrome, our zebrafish model involving different levels of Gata1 activity could potentially be used to understand the process of leukemogenesis.
The online version of this article contains a data supplement.
Acknowledgments
We thank John Crispino for helpful discussions and suggestions in designing the experiments and critical reading of the manuscript. We thank Kevin Bishop for technical assistance.
This study was supported by the Intramural Research Program of the National Human Genome Research Institute, National Institutes of Health. M.A.E. was supported by a fellowship from United Negro College Fund/Merck.
National Institutes of Health
Authorship
Contribution: C.L.B., M.A.E., R.S., and P.P.L. designed the experiments; C.L.B., M.A.E., J.C., and A.B. performed experiments; S.M.F. performed microinjections; G.G. generated the molecular model of Gata1 mutant protein; M.K. performed the FACS analysis; C.L.B., M.A.E., R.S., and P.P.L. analyzed the data; and C.L.B., R.S., and P.P.L. wrote the manuscript.
Conflict-of-interest disclosure: The authors declare no competing financial interests.
Correspondence: P. Paul Liu or Raman Sood, 49 Convent Dr, 49/3A26, Bethesda, MD 20892; e-mail: pliu@nhgri.nih.gov or rsood@mail.nih.gov.

This feature is available to Subscribers Only
Sign In or Create an Account Close Modal