Abstract
Adult patients with acute lymphoblastic T cell leukemia (T-ALL) have a very poor prognosis and few effective therapeutic options. Therefore, novel therapies that increase the efficacy of the treatments and that prolong T-ALL patient survival are needed. Malignant T cells require high concentrations of nutrients to sustain their increased rate of proliferation. In this study, we determined whether L-Arginine depletion by the pegylated form of the L-Arginine-metabolizing enzyme arginase I (peg-Arg I) impairs the proliferation of malignant T cells. Our results show that peg-Arg I depleted L-Arginine levels in vitro and in vivo. In addition, treatment of malignant T-cell lines with peg-Arg I significantly impaired their proliferation, which correlated with a decreased progression into the cell cycle, followed by the induction of apoptosis. Furthermore, peg-Arg I impaired the expression of cyclin D3, a fundamental protein in T-ALL proliferation, through a global arrest in protein synthesis. Injection of peg-Arg I plus chemotherapy agent Cytarabine prolonged survival in mice bearing T-ALL tumors. This antitumoral effect correlated with an inhibition of T-ALL proliferation in vivo, a decreased expression of cyclin D3, and T-ALL apoptosis. The results suggest the potential benefit of L-Arginine depletion by peg-Arg I in the treatment of T-cell malignancies.
Introduction
Almost 5000 cases of acute lymphoblastic leukemia (ALL) are diagnosed annually in the United States. Approximately 15% and 25% of the newly diagnosed cases of ALL in children and adults, respectively, are T cell ALL (T-ALL).1,2 The optimal use of antileukemic agents, together with a stringent application of prognostic factors for risk-directed therapies in clinical trials, has resulted in an overall complete remission rate of approximately 85% for childhood T-ALL.1,2 However, although current treatments result in complete remission in 80% to 90% of adults with newly diagnosed T-ALL, approximately half of these patients relapse within the first 2 years.3 The poor outcome in adult T-ALL has been attributed to an increased frequency of high-risk leukemia with greater drug resistance, reluctance to accepting certain temporary toxic effects, and few effective treatment regimens.1,2 Therefore, it is imperative to generate new therapies that alone or in combination with traditional treatments could potentially extend the complete remission time or be used in the refractory T-ALL population.
L-Arginine is a nonessential amino acid that plays a central role in several biologic systems including the immune response.4 L-Arginine is the substrate for the enzymes nitric oxide synthases, arginases (Arginase I and II), Arginine: glycine amidinotransferase and L-Arginine decarboxylase.5 Arginase metabolizes the hydrolysis of L-Arginine into L-Ornithine and urea.6 L-Arginine depletion by tumor infiltrating myeloid-derived-suppressor cells (MDSC) expressing arginase I arrested T-cell proliferation and blocked interferon gamma production.7,8 Primary activated T cells cultured in medium without L-Arginine displayed similar alterations,9,10 suggesting that L-Arginine is essential for T-cell proliferation and function.
The use of L-asparaginase in the treatment of T-ALL patients for more than 4 decades has suggested that limitation of amino acids may be used as a therapeutic approach to treat T-ALL.11,12 However, it is unclear whether the depletion of other amino acids may alter T-ALL cell proliferation. Treatment of several tumors including melanomas and hepatocellular carcinomas (HCC) with either the L-Arginine-metabolizing enzymes arginine deiminase (ADI) or arginase has significantly impaired tumor cell proliferation.13-15 In HCC cultures, arginase induced cell-cycle arrest, possibly mediated by modulation of the expression of cyclins.16 However, the mechanisms leading to the down-regulation of these proteins by arginase I has not been reported.
In this study, we hypothesized that limiting L-Arginine availability by the use of pegylated arginase I (peg-Arg I) will block T-ALL tumor cell proliferation and therefore be a potential therapy to treat T-ALL. Our results suggest that peg-Arg I impaired malignant T-cell proliferation, which correlated with cell-cycle arrest, low expression of cyclin D3, and the induction of tumor cell apoptosis. Furthermore, peg-Arg I impaired gene expression by a global arrest in protein synthesis. Combination of peg-Arg I with the chemotherapy agent Cytarabine (Ara-C) prolonged survival in mice-bearing T-ALL tumors. This effect correlated with an inhibited T-ALL proliferation in vivo, a decreased expression of cyclin D3, and T-ALL apoptosis. The results suggest the potential use of peg-Arg I in the treatment of T-cell malignancies.
Methods
Animals and cell lines
Six-week-old female nonobese-diabetic/severe-combined-immuno-deficient NOD.CB17-Prkdcscid/J mice (NOD-Scid; The Jackson Laboratory) were injected intravenously with 1 × 10⁷ acute lymphoblastic T-cell leukemia (CCRF-CEM) cells. Treatment of tumor-bearing mice started on day 19 after tumor injection, a time when they had approximately 2 × 10⁴ cells/μl in blood and were still susceptible to treatments. Leukemic mice were treated with peg-Arg I alone or combined with the chemotherapy agent Ara-C (Calbiochem).17 CCRF-CEM tumor-bearing mice were injected intraperitoneally with 0.5 mg/mouse of peg-Arg I starting on day 19 after tumor cell injection and continued to be injected every 4 days. Ara-C was included in the protocol after the day 19 post-tumor injection and used in one cycle of 25 mg/kg once per day during 4 days.17 As controls, mice were injected with phosphate buffer saline (PBS), starting at day 19 after tumor injection. All experiments using mice were approved by the Louisiana State University Institutional Animal Care and Use Committee. Malignant T-cell lines CCRF-CEM, Molt-3, Molt-4, and Jurkat (ATCC) were maintained in RPMI-1640 (Invitrogen) supplemented with 10% fetal bovine serum (Hyclone).
Pegylation of human recombinant Arginase I
O-[2-(N-Succinimidyloxycarbonyl)-ethyl]-O'-methylpolyethylene-glycol (PEG) 5000 mw (Sigma-Aldrich) was covalently attached to the human recombinant arginase I (AbboMax) in a 50:1 molar ratio for 2.5 hours, as described by Cheng et al.15 To determine the efficiency of the procedure, peg-Arg I, recombinant arginase I, and PEG 5000 mw were electrophoresed in 10% Tris-Glycine gels (Invitrogen) and gels stained using GelCode Blue Stain Solution (Thermo Scientific). The molecular weight of the peg-Arg I ranged between 150 to 225 kD, while the native unpegylated human recombinant arginase I was 36 kD. Pegylation of arginase I was confirmed by staining of the gels in glutaraldehyde based stain solution, finding the presence of the peg-Arg I between 150 to 225 kD and the PEG 5000 mw around 5 kD. The specific activity of the native arginase and the peg-Arg I was approximately 400 IU/mg protein. One international unit of arginase I is defined as the amount of enzyme that can produce 1 μmol urea/minute at 30°C, pH 8.5.
Arginase activity
Western blot
Thirty micrograms of cell lysates collected as described,9 were electrophoresed in 4%–20% Tris-Glycine gels, transferred to PVDF membranes and immunobloted with specific antibodies against cyclin D3 (C-16; Santa Cruz Biotechnologies), phospho-eIF2α (Epitomics), eIF2α (Biosource), and GAPDH (RDI). Membrane-bound immune complexes were detected using ECL Western blotting detection system (Amersham-Biosciences).
Detection of L-Arginine levels
Silencing and ectopic expression of cyclin D3 in CCRF-CEM cells
The constitutive expression of cyclin D3 in CCRF-CEM cells was silenced using RNAi technology, as previously reported.9 In addition, ectopic expression of cyclin D3 in CCRF-CEM cells was carried out after transfection of cells with plasmids coding for cyclin D3-eGFP (Genecopoeia), which contain a CMV promoter and a neomycin selection cassette. Control transfections were performed with the same vector coding for eGFP. Transfections were established using FuGENE-XD transfection reagent (Roche), following the vendor recommendations. Transfected cells were selected in medium containing 500 μg/mL of Geneticin (Invitrogen). The transfection was confirmed in selected clones by testing the expression of eGFP and cyclin D3 by flow cytometry and Western blot, respectively.
Cell-cycle progression and proliferation
Analysis of nuclear DNA content of malignant T cells cultured with or without peg-Arg I was done using CycleTEST plus DNA reagent kit (BD Biosciences). Malignant T-cell proliferation was tested using the CellTiter nonradioactive cell proliferation yellow tetrazolium salt (MTT) kit (Promega). Data are expressed as absorbance at 570 nanometers (nm; mean ± SD) of triplicate experiments. Incorporation of 5-bromo-2′deoxyuridine (BrdU) into CCRF-CEM cells was used to determine T-ALL proliferation in vivo. Briefly, 200 mg/mouse of BrdU (BD Biosciences) were injected intraperitoneally into CCRF-CEM-bearing mice and 24 hours later BrdU incorporation was detected in human CD5+ cells using the FITC-BrdU Flow Kit (BD Biosciences). Results are expressed as the percentage of CD5+/BrdU+ cells. Fluorescence acquisition and analysis were done using a Coulter-Epics-XL flow cytometer (Beckman-Coulter) with a 488-nm argon laser.
Apoptosis assay
Expression of annexin V was tested using the annexin V–FITC Apoptosis Detection Kit (BD Biosciences).8 The results are expressed as the percentage of annexin V+ cells within the gated CD5+ population. To test the mitochondrial membrane potential, CCRF-CEM cells cultured with or without peg-Arg I for 72 hours were labeled with 3,3′-diethyloxacarbocyanine-iodide (DiOC2(3)), using the MitoProbe DiOC2(3) Assay Kit (Molecular Probes-Invitrogen), and analyzed by flow cytometry. The expression of active caspase 3 in cells cultured for 96 hours with or without peg-Arg I was detected by flow cytometry, as suggested by the antibody vendor (BD Biosciences).
Isolation of human CD5+ cells
Spleens from CCRF-CEM T-ALL tumor-bearing-mice treated with peg-Arg I plus Ara-C or PBS were isolated after 30 days of tumor injection. Splenocytes were labeled with anti–human CD5-PE antibodies (BD Biosciences), followed by the isolation of PE-labeled cells using anti-PE magnetic beads separation kit (Miltenyi Biotech). Human T-ALL CD5+ cells purity ranged between 95% and 99% as tested by flow cytometry.
RT-PCR
Two micrograms of total RNA isolated from CCRF-CEM cells cultured with or without peg-Arg I for 24 hours were treated with DNAse I (Invitrogen) and converted into cDNA using SuperScript Kit (Invitrogen). Polymerase chain reactions (PCRs) using recombinant Taq polymerase (Invitrogen) were done to determine the expression of cyclin D3 and Actin, as previously reported.9 In addition, 1 μL of the cDNA was used for the amplification of the human cyclin D3 mRNA using Taqman Gene Expression Assays (Applied Biosystems). Housekeeping controls included the human large ribosomal protein and the human cyclophylin A (Applied Biosystems). Real-time PCR was conducted in a 7900HT real-time PCR machine (Applied Biosystems) with an initial hold for 10 minutes at 95°C followed by 40 cycles of 95°C for 15 seconds and 60°C for 1 minute. The results of the PCR were analyzed with the Sequence Detection Software Version 2.2 (Applied Biosystems) and are expressed as the ratio of the cyclin D3 cycle threshold (Ct) over the Ct of the housekeeping controls.
[35S] Methionine pulse analysis
CCRF-CEM cells cultured in medium with or without peg-Arg I for 24 hours were washed 4 times in L-methionine-free RPMI-1640 and then seeded at a density of 2 × 10⁶ cells/mL in L-methionine-free RPMI-1640. Cells were starved of methionine for 20 minutes and then pulsed with 0.25 mCi of [35S] methionine for 2 hours. Protein extracts were collected and cyclin D3 immunoprecipitated, as described.9
Isolation of polysomes
Cytoplasmic extracts harvested from CCRF-CEM cells cultured with or without peg-Arg I for 24 hours were layered onto 10% to 50% sucrose gradients prepared in polysome lysis buffer (Tris-HCL 50 mM pH 7.2, KCL 150 mM, MgCl2 5 mM, DTT 1 mM) containing 100 μg/mL cycloheximide. Gradients were spun at 35 000 rpm (150 000g) for 160 minutes at 4°C using a SW-41Ti rotor (Beckmann Coulter), as previously described.20 Gradients of 1 mL were fractionated and the polysome profile monitored by absorbance at 260 nm.21 RNA from the different fractions was obtained using phenol/chloroform and tested for the presence of cyclin D3 mRNA by Northern blot, as previously reported.9
Statistical analysis
Results were analyzed in SAS v9.1 using a mixed models approach to repeated measures settings and inequality of variances. No data transformations were attempted. Comparisons of means were carried out by either the Dunnet or Tukey procedures to account for multiple testing. Survival functions were estimated by the Kaplan-Meier method and they were compared with the log-rank or Renyi tests.
Results
Peg-Arg I depletes L-Arginine in vitro and in vivo
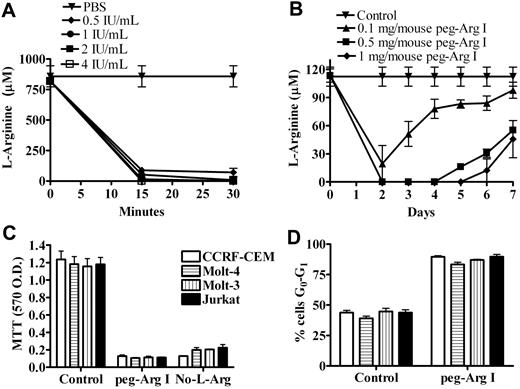
We initially tested whether peg-Arg I depletes the levels of the amino acid L-Arginine in vitro and in vivo. A dramatic decrease in the levels of L-Arginine in RPMI medium was noticed 15 minutes after the addition of increasing concentrations of peg-Arg I (0.5-4 IU/mL). In contrast, the addition of the same volume of PBS to the medium did not alter the L-Arginine levels (Figure 1A). Furthermore, the injection of mice with increasing doses of peg-Arg I (0.1-1 mg/mouse) induced a dose dependent depletion of L-Arginine levels in the serum (Figure 1B), which correlated with an increased arginase activity (supplemental Figure 1A, available on the Blood Web site; see the Supplemental Materials link at the top of the online article). In contrast, the injection of PBS into the mice neither altered serum L-Arginine levels nor increased arginase activity (Figure 1B and supplemental Figure 1A). The continuous injection of peg-Arg I maintained the depletion of L-Arginine in the serum during the treatment period, discarding the development of resistance to the treatment (supplemental Figure 1B). As a measurement of general toxicity of the peg-Arg I therapy, we monitored the weight in peg-Arg I treated mice. A modest loss in weight was found in mice treated with peg-Arg I after the first injection, but this was quickly recovered 1 day later (supplemental Figure 2), ruling out a general toxicity effect.
Peg-Arg I depletes L-Arginine in vitro and in vivo and impairs malignant T-cell proliferation. (A) RPMI medium was treated with peg-Arg I (0.5-4 IU/mL) or PBS and the levels of L-Arginine measured by HPLC after 15 and 30 minutes. (B) Mice were injected with PBS (Control) or peg-Arg I (0.1-1 mg/mouse) and the levels of L-Arginine in the serum were measured every day by HPLC. Five mice were used for each condition. (C) Malignant T-cell lines (1 × 10⁵) were cultured for 72 hours in the presence or the absence of peg-Arg I (2 IU/mL), or the absence of L-Arginine (No-L-Arg), and proliferation determined by MTT. (D) Malignant T-cell lines (1 × 10⁶) were cultured for 24 hours in medium with or without peg-Arg I, after which the cell-cycle progression was determined by propidium iodide. Results are expressed as the percentage of cells in the G0-G1 phase of the cell cycle. Experiments were repeated at least 3 times obtaining similar results.
Peg-Arg I depletes L-Arginine in vitro and in vivo and impairs malignant T-cell proliferation. (A) RPMI medium was treated with peg-Arg I (0.5-4 IU/mL) or PBS and the levels of L-Arginine measured by HPLC after 15 and 30 minutes. (B) Mice were injected with PBS (Control) or peg-Arg I (0.1-1 mg/mouse) and the levels of L-Arginine in the serum were measured every day by HPLC. Five mice were used for each condition. (C) Malignant T-cell lines (1 × 10⁵) were cultured for 72 hours in the presence or the absence of peg-Arg I (2 IU/mL), or the absence of L-Arginine (No-L-Arg), and proliferation determined by MTT. (D) Malignant T-cell lines (1 × 10⁶) were cultured for 24 hours in medium with or without peg-Arg I, after which the cell-cycle progression was determined by propidium iodide. Results are expressed as the percentage of cells in the G0-G1 phase of the cell cycle. Experiments were repeated at least 3 times obtaining similar results.
Because peg-Arg I injection in mice depleted L-Arginine levels in the serum, we tested the potential effect of human recombinant nonpegylated arginase I (non–peg-Arg I). L-Arginine levels in the serum of mice injected with non–peg-Arg I (0.5 mg/mouse) decreased during the first hour of injection, but rapidly recovered to normal levels after 24 hours (supplemental Figure 3A). This recovery in L-Arginine levels correlated with a decrease in arginase activity (supplemental Figure 3B). The injection of mice with even higher doses of non–peg-Arg I resulted in normal levels of L-Arginine and low arginase activity after 24 hours (supplemental Figure 3C-D). In contrast, mice injected with the same concentration of peg-Arg I had a complete depletion of L-Arginine in the serum, which also correlated with high arginase activity levels (supplemental Figure 3A-D). Therefore, pegylation of human recombinant arginase I significantly increase its availability in vivo. Although pegylation can decrease the activity of certain enzymes, results suggest no differences in the in vitro activity between pegylated and nonpegylated arginase I (supplemental Figure 3E).
Peg-Arg I blocks malignant T-cell proliferation, which correlates with an arrest in cell-cycle progression
We tested the effect of peg-Arg I on the proliferation of several malignant T cells, including CCRF-CEM, Molt-3, Molt-4, and Jurkat. A significant decrease in the proliferation of all malignant T-cell lines was found when they were cultured in medium containing 2 IU/mL of peg-Arg I, compared with cells cultured in normal medium (Figure 1C; P < .001). A similar arrest in the proliferation was noticed when the malignant T cells were cultured in medium lacking L-Arginine. We previously showed that primary activated T cells starved of L-Arginine were arrested in the G0-G1 phase of the cell cycle.9 Similarly, cell-cycle analysis showed that all tested malignant T-cell lines cultured for 24 hours in the presence of peg-Arg I were arrested in the G0-G1 phase (Figure 1D; P < .001). Thus, the arrest in malignant T-cell proliferation induced by peg-Arg I could be explained by a low progression into the cell cycle.
Role of cyclin D3 on the decreased proliferation induced by peg-Arg I
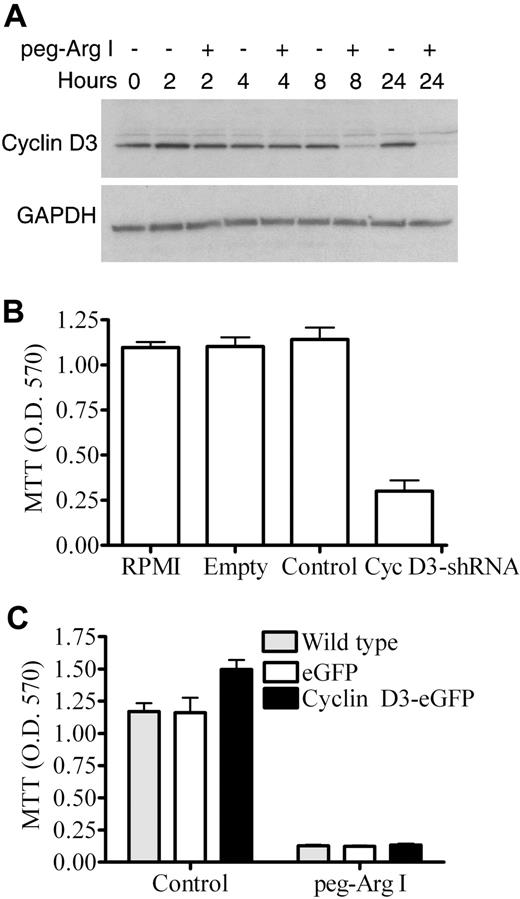
Deletion of cyclin D3 impairs malignant T-cell proliferation in vitro and in vivo by arresting cell-cycle progression into the G0-G1 phase.9,22,23 We tested whether the treatment of CCRF-CEM cells with peg-Arg I inhibited the expression of cyclin D3. A significant decrease in cyclin D3 expression was observed as early as 8 hours in CCRF-CEM cells cultured in the presence of peg-Arg I, compared with cells cultured in normal medium (Figure 2A). The decrease in cyclin D3 induced by peg-Arg I was not compensated by other cyclin D (D1 or D2) proteins since we were unable to detect their expression in CCRF-CEM cells cultured with peg-Arg I (data not shown). If peg-Arg I targets cyclin D3 to block proliferation, then silencing of cyclin D3 should induce similar effects. Interestingly, silencing of cyclin D3 mRNA in CCRF-CEM cells (Cyc D3-shRNA) induced a significant decrease in their proliferation (Figure 2B; P < .001), suggesting the role of cyclin D3 in T-ALL cell proliferation. To further determine the relevance of the cyclin D3 down-regulation in the proliferation arrest induced by peg-Arg I, we measured the proliferation of CCRF-CEM cells over-expressing cyclin D3 after treatment with peg-Arg I. The ectopic expression of cyclin D3 in CCRF-CEM cells slightly increased their proliferation when cultured in normal medium (Figure 2C). However, the ectopic over-expression of cyclin D3 in CCRF-CEM cells (Cyclin D3-eGFP) did not reverse the proliferation arrest induced by peg-Arg I (Figure 2C). Thus, the data suggest that although cyclin D3 is fundamental for malignant T-cell proliferation, the inhibition of cyclin D3 expression by peg-Arg I is not the only alteration responsible for the inhibited proliferation.
Peg-Arg I impairs cyclin D3 expression in T-ALL cells. (A) Cyclin D3 expression was determined by Western blot in CCRF-CEM cells cultured with or without peg-Arg I. (B) CCRF-CEM cells (1 × 10⁵) previously transfected with shRNA-coding plasmids against nonrelevant sequences (Control) or cyclin D3 (Cyc D3-shRNA), or transfected with empty plasmids (Empty) were cultured for 72 hours and proliferation tested by MTT. (C) CCRF-CEM cells over-expressing cyclin D3 (Cyclin D3-eGFP), expressing eGFP, or wild-type cells were cultured for 72 hours in RPMI medium (Control) or medium containing peg-Arg I (2 IU/mL), after which proliferation was tested by MTT. Experiments were repeated at least 3 times obtaining similar results.
Peg-Arg I impairs cyclin D3 expression in T-ALL cells. (A) Cyclin D3 expression was determined by Western blot in CCRF-CEM cells cultured with or without peg-Arg I. (B) CCRF-CEM cells (1 × 10⁵) previously transfected with shRNA-coding plasmids against nonrelevant sequences (Control) or cyclin D3 (Cyc D3-shRNA), or transfected with empty plasmids (Empty) were cultured for 72 hours and proliferation tested by MTT. (C) CCRF-CEM cells over-expressing cyclin D3 (Cyclin D3-eGFP), expressing eGFP, or wild-type cells were cultured for 72 hours in RPMI medium (Control) or medium containing peg-Arg I (2 IU/mL), after which proliferation was tested by MTT. Experiments were repeated at least 3 times obtaining similar results.
Mechanisms leading to gene expression regulation by peg-Arg I
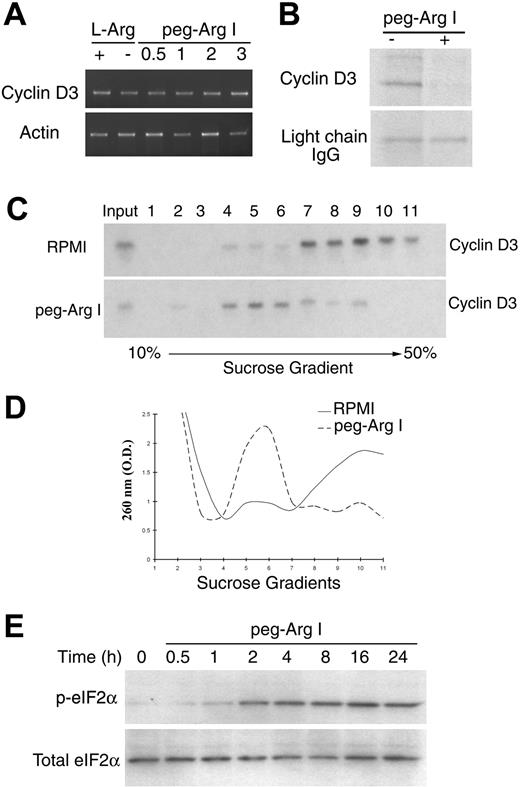
Although treatment of CCRF-CEM cells with peg-Arg I inhibited cyclin D3 protein expression, similar levels of cyclin D3 mRNA were detected in cells cultured in the presence or the absence of peg-Arg I (Figure 3A and supplemental Figure 4). In contrast, CCRF-CEM cells cultured with peg-Arg I had a decreased cyclin D3 protein synthesis, measured by pulse chase analysis, compared with CCRF-CEM cells cultured in normal medium (Figure 3B). Localization of mRNAs in heavy polysomes is a characteristic of active translation mechanisms.24 Cyclin D3 mRNA was located in light polysomes of CCRF-CEM cells treated with peg-Arg I, whereas it was in heavy polysomes of cells cultured in normal medium (Figure 3C), confirming the effect of peg-Arg I on the cyclin D3 translation. To determine whether the arrest in cyclin D3 protein synthesis by peg-Arg I was a specific effect or the result of a global attenuation in translation, we compared the accumulation of polysomes in sucrose gradients from cells cultured with or without peg-Arg I. A general distribution of polysomes in light sucrose fractions occurred in CCRF-CEM cells cultured with peg-Arg I (Figure 3D), whereas they localized in heavy fractions in cells cultured without peg-Arg I. The arrest in protein synthesis by amino acid starvation has been reported to be mediated by phosphorylation of the eukaryotic-translation-initiation-factor 2 alpha (eIF2α). Accordingly, an increased expression of phospho-eIF2α was found as early as 2 hours in CEM-CCRF cells cultured with peg-Arg I (Figure 3E). Thus, peg-Arg I induces a global arrest in translation in malignant T cells, which impairs the expression of genes including those involved in malignant T-cell proliferation, such as cyclin D3.
Peg-Arg I inhibits the expression of cyclin D3 in T-ALL cells through a global arrest in protein synthesis. (A) Cyclin D3 mRNA levels were tested by RT-PCR in CCRF-CEM cells cultured for 24 hours in medium with or without L-Arginine (L-Arg) or in medium containing increasing concentrations of peg-Arg I (0.5-3 IU/mL). (B) Pulse-chase analysis for cyclin D3 in CCRF-CEM cells cultured in the presence or the absence of peg-Arg I (2 IU/mL) for 24 hours. (C) Cyclin D3 mRNA levels were tested in polysomes isolated using sucrose gradients from CCRF-CEM cells cultured in RPMI with or without peg-Arg I for 24 hours. (D) A representative experiment from panel C, in which fractions were tested for absorbance (260 nm) to determine the general distribution of the polysomes. (E) CCRF-CEM cells cultured in medium with peg-Arg I (2 IU/mL) were tested for the expression of phospho-eIF2α by immunoblot. The experiments were repeated a minimum of 3 times obtaining similar results.
Peg-Arg I inhibits the expression of cyclin D3 in T-ALL cells through a global arrest in protein synthesis. (A) Cyclin D3 mRNA levels were tested by RT-PCR in CCRF-CEM cells cultured for 24 hours in medium with or without L-Arginine (L-Arg) or in medium containing increasing concentrations of peg-Arg I (0.5-3 IU/mL). (B) Pulse-chase analysis for cyclin D3 in CCRF-CEM cells cultured in the presence or the absence of peg-Arg I (2 IU/mL) for 24 hours. (C) Cyclin D3 mRNA levels were tested in polysomes isolated using sucrose gradients from CCRF-CEM cells cultured in RPMI with or without peg-Arg I for 24 hours. (D) A representative experiment from panel C, in which fractions were tested for absorbance (260 nm) to determine the general distribution of the polysomes. (E) CCRF-CEM cells cultured in medium with peg-Arg I (2 IU/mL) were tested for the expression of phospho-eIF2α by immunoblot. The experiments were repeated a minimum of 3 times obtaining similar results.
Peg-Arg I induces malignant T-cell apoptosis in vitro
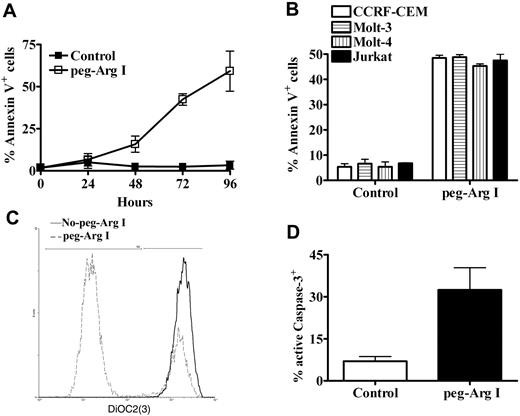
Previous proposed models for cell response against stress, suggested an initial attenuation in translation, which provides the plasticity needed for cells to respond to the changes in the environment.25 If the stress conditions persist, the arrest in the translation is followed by the induction of cell apoptosis.26 Accordingly, a gradual increase in the expression of the apoptosis marker annexin V occurred in CCRF-CEM cells treated with peg-Arg I, compared with cells cultured in control medium (Figure 4A). A similar induction of annexin V was also noticed in other malignant T-cell lines including Molt-3, Molt-4, and Jurkat, when cultured for 72 hours in medium containing peg-Arg I (Figure 4B; P < .001). Because peg-Arg I inhibits proliferation and induces apoptosis in T-ALL cells, we asked about the effect of peg-Arg I on B-ALL cells. B-ALL cell lines SB, Sup-B15, and RS4 were cultured with or without peg-Arg I for 72 hours, after which proliferation and annexin V expression were measured. Similar to the effects induced on T-ALL cells, we found that B-ALL cells cultured with peg-Arg I have a decreased proliferation, which correlated with an increased expression of annexin V (supplemental Figure 5).
Peg-Arg I induces T-ALL apoptosis. (A) CCRF-CEM cells were cultured in medium with or without peg-Arg I and the expression of annexin V was tested after 24, 48, 72, and 96 hours by flow cytometry. (B) Malignant T-cell lines including CCRF-CEM, Molt-3, Molt-4, and Jurkat were cultured as in panel A and tested for the expression of annexin V after 72 hours. Peg-Arg I impaired the mitochondrial membrane potential (C), and induced active caspase-3 expression (D) in CCRF-CEM cells. Values are from 3 similar experiments.
Peg-Arg I induces T-ALL apoptosis. (A) CCRF-CEM cells were cultured in medium with or without peg-Arg I and the expression of annexin V was tested after 24, 48, 72, and 96 hours by flow cytometry. (B) Malignant T-cell lines including CCRF-CEM, Molt-3, Molt-4, and Jurkat were cultured as in panel A and tested for the expression of annexin V after 72 hours. Peg-Arg I impaired the mitochondrial membrane potential (C), and induced active caspase-3 expression (D) in CCRF-CEM cells. Values are from 3 similar experiments.
Changes in the mitochondrial potential have been suggested as one of the classical markers of the intrinsic mediated apoptosis.26 The dye DiOC2(3) penetrates the cytosol of cells and accumulates primarily in the mitochondria with active membrane potential. However, DiOC2(3) fluorescence decreases after mitochondrial disruption. A decrease in the DiOC2(3) intensity was found in CCRF-CEM cells cultured in the presence of peg-Arg I, but not in cells cultured without peg-Arg I (Figure 4C), suggesting that peg-Arg I impairs the mitochondrial membrane potential. Active caspase-3 is a marker for cells undergoing apoptosis and is considered one of the major caspase effectors. An accumulation of active caspase-3 was detected in CCRF-CEM cells cultured in medium containing peg-Arg I, whereas it was decreased in cells cultured in normal medium (Figure 4D; P = .031). Altogether, the results suggest that malignant T cells treated with peg-Arg I have an initial attenuation in translation, which is followed by the induction of tumor cell apoptosis.
Peg-Arg I impairs proliferation of primary activated T cells, but does not induce apoptosis
We addressed whether the effect induced by peg-Arg I is preferential for T-cell leukemia cells relative to nonmalignant T cells. Our previous results suggested that primary activated T cells cultured in the absence of L-Arginine had a decreased proliferation caused by an arrest of the cells in the G0-G1 phase of the cell cycle.9 A similar decrease in the proliferation (P < .001) and an arrest in the G0-G1 phase of the cell cycle (supplemental Figure 6 A-B) was found in primary activated T cells (anti-CD3/CD28) cultured in medium containing peg-Arg I. However, in contrast to the effect induced in malignant T cells, we found that normal activated T cells cultured in the presence of peg-Arg I had neither an increased expression of annexin V nor a decreased DiOC2(3) intensity (supplemental Figure 6C-D). Thus, peg-Arg I arrests cell-cycle progression in primary T cells, but does not induce apoptosis.
Injection of CCRF-CEM cells into NOD-Scid mice induces T-ALL
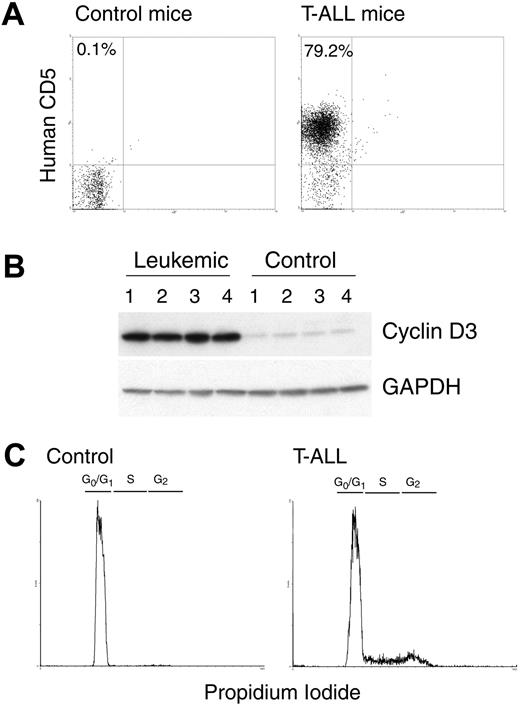
Injection of CCRF-CEM cells into NOD-Scid mice induces the generation of T-ALL.17 Tumor T-ALL cells can be tracked in this tumor model using fluorochrome-labeled anti–human CD5 antibodies.17 Mice injected with CCRF-CEM T-ALL cells displayed a physiologic deterioration, including lethargy, hunched appearance, and hutch fur around 30 days after tumor injection.17 At that time, there was an accumulation of human CD5+ cells in the spleens of tumor-bearing mice, but not in the spleens of tumor-free mice (Figure 5A). A similar accumulation of CD5+ cells also occurred in peripheral blood, lymph nodes, and bone marrow of the CCRF-CEM tumor-bearing mice (data not shown).17 The accumulation of human CD5+ tumor cells in the spleen of CCRF-CEM–bearing mice led to a significant enlargement of the spleen size (data not shown). In addition, spleens from CCRF-CEM–bearing mice displayed an increased expression of cyclin D3, compared with spleens from mice without tumors (Figure 5B). Accordingly, cell-cycle analysis showed that spleens from CCRF-CEM-bearing mice, but not from mice without tumors, had a high progression of cells into the cell cycle (Figure 5C), suggesting the high rate of proliferation of CCRF-CEM cells in vivo.
NOD-Scid injected with CCRF-CEM cells develop T-ALL. (A) A representative experiment showing that CCRF-CEM–bearing NOD-Scid mice have an increased accumulation of human CD5+ cells in the spleens after 30 days of tumor injection. (B-C) Spleens from panel A were tested for the expression cyclin D3 and GAPDH by Western blot and for the cell-cycle progression using propidium iodide. The experiments were repeated a minimum of 3 times obtaining similar results.
NOD-Scid injected with CCRF-CEM cells develop T-ALL. (A) A representative experiment showing that CCRF-CEM–bearing NOD-Scid mice have an increased accumulation of human CD5+ cells in the spleens after 30 days of tumor injection. (B-C) Spleens from panel A were tested for the expression cyclin D3 and GAPDH by Western blot and for the cell-cycle progression using propidium iodide. The experiments were repeated a minimum of 3 times obtaining similar results.
Antitumoral effect of peg-Arg I injection in T-ALL–bearing mice
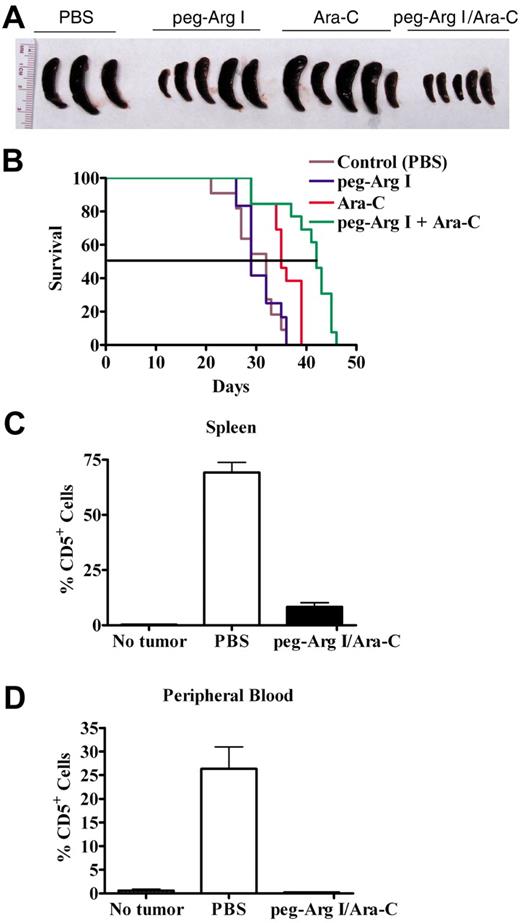
We determined the effect of peg-Arg I and the antimetabolic chemotherapy agent Ara-C as a therapy in the CCRF-CEM tumor model. Injection of CCRF-CEM–bearing mice with either peg-Arg I or Ara-C alone induced a heterogeneous antitumor response, which was evidenced by the prevention of the spleen enlargement in some of the treated tumor-bearing mice (Figure 6A). In addition, treatment with the combination of peg-Arg I and Ara-C induced a homogenous prevention of the spleen growth in 100% of the T-ALL tumor-bearing mice (Figure 6A), suggesting a synergistic antitumor effect. Furthermore, a significant prolongation in the survival of T-ALL-bearing mice occurred after treatment with peg-Arg I plus Ara-C (Figure 6B), compared with tumor-bearing mice treated with either peg-Arg I, Ara-C or PBS (P < .001). We also tested the effect of the peg-Arg I plus Ara-C therapy in the accumulation of CCRF-CEM cells in vivo. A significant prevention in the accumulation of human CD5+ cells in the spleen (Figure 6C; P < .001) and peripheral blood (Figure 6D; P = .005) was found in CCRF-CEM–bearing mice treated with the combination of peg-Arg I and Ara-C, but not in tumor-bearing mice treated with PBS.
Peg-Arg I plus Ara-C inhibit the accumulation of T-ALL cell in vivo. (A) Peg-Arg I/Ara-C homogeneously prevents the spleen growth induced by CCRF-CEM cells. Tumor size was tested after 30 days of tumor injection. (B) Survival of CCRF-CEM-bearing mice was established after therapies with PBS (Control; n = 11), peg-Arg I (n = 12), Ara-C (n = 13), or peg-Arg I/Ara-C (n = 13). (C-D) Percentage of human CD5+ cells was established in spleens and peripheral blood after 30 days of tumor injection in mice treated with peg-Arg I/Ara-C (n = 10) or PBS (n = 10).
Peg-Arg I plus Ara-C inhibit the accumulation of T-ALL cell in vivo. (A) Peg-Arg I/Ara-C homogeneously prevents the spleen growth induced by CCRF-CEM cells. Tumor size was tested after 30 days of tumor injection. (B) Survival of CCRF-CEM-bearing mice was established after therapies with PBS (Control; n = 11), peg-Arg I (n = 12), Ara-C (n = 13), or peg-Arg I/Ara-C (n = 13). (C-D) Percentage of human CD5+ cells was established in spleens and peripheral blood after 30 days of tumor injection in mice treated with peg-Arg I/Ara-C (n = 10) or PBS (n = 10).
Peg-Arg I plus Ara-C therapy impairs T-ALL proliferation, down-regulates cyclin D3 expression, and induces T-ALL cell apoptosis in vivo
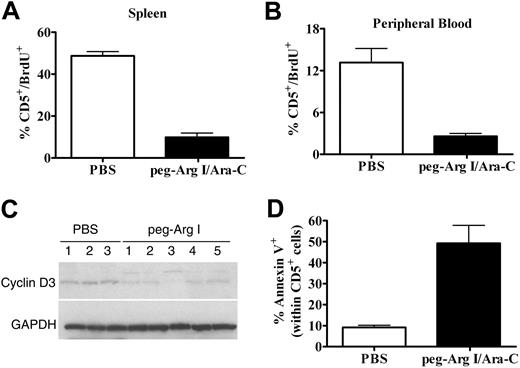
To further confirm the antitumor effect of peg-Arg I, we measured CCRF-CEM cells proliferation in vivo by testing BrdU incorporation. Treatment of CCRF-CEM-bearing mice with peg-Arg I plus Ara-C significantly reduced the percentage of CD5+/BrdU+ cells in the spleen (P < .001) and peripheral blood (P < .001), compared with tumor-bearing mice treated with PBS (Figure 7A-B). This effect correlated with a lower expression of cyclin D3 in human CD5+ cells isolated from tumor-bearing mice treated with peg-Arg I plus Ara-C, compared with CD5+ cells from PBS treated tumor-bearing mice (Figure 7C). The clinical potential of the peg-Arg I/Ara-C therapy will depend on its ability to finally induce tumor cell death. Accordingly, a significant expression of annexin V was found in CD5+ cells from spleens of tumor-bearing mice treated with peg-Arg I plus Ara-C, compared with cells from PBS treated mice (Figure 7D; P = .001), suggesting that the peg-Arg I/Ara-C therapy induces malignant T-cell apoptosis in vivo.
Peg-Arg I plus Ara-C impairs malignant T-cell proliferation and induces tumor cell apoptosis in vivo. (A-B) Proliferation of T-ALL cells was tested in vivo in CCRF-CEM-bearing mice treated with peg-Arg I/Ara-C (n = 10) or PBS (n = 10) by measuring the uptake of BrdU, as described in “Cell-cycle progression and proliferation.” (C) A representative experiment showing the expression of cyclin D3 and GAPDH in CD5+ cells sorted from individual tumor-bearing mice treated with PBS (n = 3) or peg-Arg I plus Ara-C (n = 5). The experiment was repeated a minimum of 3 times obtaining similar results. (D) Annexin V expression was established in gated CD5+ cells in the spleens from tumor-bearing mice treated with peg-Arg I/Ara-C (n = 10) or PBS (n = 10) after 30 days of tumor injection.
Peg-Arg I plus Ara-C impairs malignant T-cell proliferation and induces tumor cell apoptosis in vivo. (A-B) Proliferation of T-ALL cells was tested in vivo in CCRF-CEM-bearing mice treated with peg-Arg I/Ara-C (n = 10) or PBS (n = 10) by measuring the uptake of BrdU, as described in “Cell-cycle progression and proliferation.” (C) A representative experiment showing the expression of cyclin D3 and GAPDH in CD5+ cells sorted from individual tumor-bearing mice treated with PBS (n = 3) or peg-Arg I plus Ara-C (n = 5). The experiment was repeated a minimum of 3 times obtaining similar results. (D) Annexin V expression was established in gated CD5+ cells in the spleens from tumor-bearing mice treated with peg-Arg I/Ara-C (n = 10) or PBS (n = 10) after 30 days of tumor injection.
Discussion
Over the past 40 years, refinements in the chemotherapy regimens and supportive care have lead to a great success in the treatment of children with T-ALL. However, the generation of successful therapies for adult patients with T-ALL has been less rewarding. The overall complete remission rate of adult T-ALL continues to be approximately 40%. Therefore, it is imperative to generate new therapies that alone or in combination with traditional treatments can increase the cure rate of adult T-ALL. In this study, we hypothesized that limiting L-Arginine availability by the use of peg-Arg I will block T-ALL tumor cell proliferation and be a potential therapy to treat T-ALL. Our results show that peg-Arg I impaired the proliferation of malignant T cells and finally induced tumor cell apoptosis. In addition, the combination of peg-Arg I with the chemotherapy agent Ara-C significantly prolonged survival in T-ALL-bearing mice.
An increased arginase activity has been described in patients with solid tumors,8,27 where it may enhance tumor growth by promoting polyamines production.28 However, the role of arginase in T-cell malignancies is unknown. We have not detected arginase I in T-ALL cell lines or T-ALL-bearing mice (data not shown), which suggests that arginase does not play a major role in this type of malignancy. The potential use of the L-Arginine depletion as a therapy in T-ALL depends on the ability of the tumor cells to produce L-Arginine de novo. This process is controlled by the enzymes argininosuccinate synthetase (ASS) and argininosuccinate lyase (ASL), which metabolize citrulline initially into argininosuccinate and finally into L-Arginine.5 Previous studies have suggested that cells from adult T-ALL patients do not express significant levels of ASS,29 suggesting a potential sensitivity of T-ALL cells to therapies that induce L-Arginine starvation. However, determining whether T-ALL cells expressing ASS and ASL are resistant to peg-Arg I treatment will be important to determine the possible mechanisms of resistance to this treatment in T-ALL patients.
Results obtained in T-ALL patients treated with L-asparaginase have suggested that the limitation of amino acids may be used as a therapeutic approach in T-ALL.30 Treatment of other tumors including melanomas and HCC with either the L-Arginine metabolizing enzymes ADI or peg-Arg I has significantly impaired tumor cell proliferation.13-15 Cheng et al showed that peg-Arg I injection significantly retarded tumor growth in HCC-tumor–bearing mice.15 Although peg-Arg I therapy alone did not induce a homogenous antitumoral effect in our study, its combination with Ara-C significantly prevented tumor growth and prolonged survival of T-ALL-bearing animals. Furthermore, our results suggest that treatment of T-ALL cells with peg-Arg I induces a global arrest in protein synthesis, which impairs the expression of proteins fundamental for malignant T-cell proliferation (ie, cyclin D3), and finally leads to the induction of malignant T-cell apoptosis. This is in agreement with models of stress, including nutrient starvation, gamma irradiation, hypoxia, and UV exposure, where cells initially attenuate translation, and if the stress situation is either too long or strong the cells finally undergo apoptosis.31
The translation process can be divided into 3 distinct phases: initiation, elongation, and termination. Although each step is subjected to regulatory processes, under most circumstances, the rate-limiting mechanism in protein synthesis is the initiation step. This mechanism possibly evolved because it is more effective to reduce the load of new proteins than prevent the accumulation of unfolded proteins.25 In addition, by decreasing translation, the cells can save up to 50% of the energy they normally expend.25 The arrest in protein synthesis by L-Arginine starvation has been reported to be mediated by the accumulation of empty tRNAs that activate GCN2,9 which subsequently phosphorylates eIF2α.32 Phosphorylation of eIF2α inhibits the GDP–GTP exchange by reducing the dissociation rate of eIF2B, blocking the access of methionyl tRNA to the translation initiation complex and globally inhibiting translation.33 Our results show that peg-Arg I induces the phosphorylation of eIF2α in malignant T cells in vitro. We are currently studying the relevance of the GCN2 activation pathway in the in vivo effects induced by peg-Arg I.
An important question still not fully answered is about the effects of peg-Arg I on normal T cells. Although in vitro proliferation of malignant T cells and normal activated T cells is impaired by the peg-Arg I, there are some differences in the end point effects. Activated T cells starved of L-Arginine recovered their proliferation when the amino acid citrulline was added, suggesting that they have the molecular pathways to produce L-Arginine de novo.9 In contrast, peg-Arg I–treated malignant T-cell lines Jurkat and CCRF-CEM did not express ASS and ASL, and were unable to recover their proliferation after replenishment of citrulline (data not shown). Furthermore, despite the arrest in cell-cycle progression found in activated T cells and malignant T cells cultured in the presence of peg-Arg I, we found that primary activated T cells did not undergo apoptosis, as malignant T cells did. However, it is still unknown the effect that peg-Arg I may have on normal activated T cells in vivo, where cells have access to high levels of citrulline to produce L-Arginine de novo. In the case that peg-Arg I inhibits T-cell function in vivo, it can still be used in cycles that transiently allow the recovery of the L-Arginine levels, which would allow the proliferation of the normal activated T cells.
In conclusion, the results obtained from this study suggest the potential benefit of peg-Arg I in the treatment of T-ALL. The continuation of this research will help design new, safe, and effective approaches to test the use of peg-Arg I as an adjuvant for the treatment of T-ALL patients.
The online version of this article contains a data supplement.
The publication costs of this article were defrayed in part by page charge payment. Therefore, and solely to indicate this fact, this article is hereby marked “advertisement” in accordance with 18 USC section 1734.
Acknowledgments
We thank Jonna Ellis (LSU-HSC) for assistance in the preparation of this manuscript.
This work was supported in part by National Institutes of Health–National Center for Research Resources (Centers for Biomedical Research Excellence) P20RR021970, Translational research initiative–LSU-HSC, and the Ladies Leukemia League (P.C.R.).
National Institutes of Health
Authorship
Contribution: C.P.H., K.M., L.A.L.-B., J.Z., R.S., and C.V. performed some of the experiments; J.C. gave advice on experiments testing peg-Arg I in vivo; and P.C.R. planned, performed, and analyzed the experiments.
Conflict-of-interest disclosure: The authors declare no competing financial interests.
Correspondence: Paulo C. Rodriguez, PhD, Stanley S. Scott Cancer Center, LSU-HSC, 533 Bolivar St, Rm 452, New Orleans, LA, 70112; e-mail: prodri1@lsuhsc.edu.

This feature is available to Subscribers Only
Sign In or Create an Account Close Modal