Abstract
L3MBTL1, the human homolog of the Drosophila L(3)MBT polycomb group tumor suppressor gene, is located on chromosome 20q12, within the common deleted region identified in patients with 20q deletion-associated polycythemia vera, myelodysplastic syndrome, and acute myeloid leukemia. L3MBTL1 is expressed within hematopoietic CD34+ cells; thus, it may contribute to the pathogenesis of these disorders. To define its role in hematopoiesis, we knocked down L3MBTL1 expression in primary hematopoietic stem/progenitor (ie, CD34+) cells isolated from human cord blood (using short hairpin RNAs) and observed an enhanced commitment to and acceleration of erythroid differentiation. Consistent with this effect, overexpression of L3MBTL1 in primary hematopoietic CD34+ cells as well as in 20q− cell lines restricted erythroid differentiation. Furthermore, L3MBTL1 levels decrease during hemin-induced erythroid differentiation or erythropoietin exposure, suggesting a specific role for L3MBTL1 down-regulation in enforcing cell fate decisions toward the erythroid lineage. Indeed, L3MBTL1 knockdown enhanced the sensitivity of hematopoietic stem/progenitor cells to erythropoietin (Epo), with increased Epo-induced phosphorylation of STAT5, AKT, and MAPK as well as detectable phosphorylation in the absence of Epo. Our data suggest that haploinsufficiency of L3MBTL1 contributes to some (20q−) myeloproliferative neoplasms, especially polycythemia vera, by promoting erythroid differentiation.
Introduction
Deletion of the long arm of chromosome 20 (20q−) represents the second most common primary chromosomal abnormality in the hematologic malignancies, after the Philadelphia chromosome.1 The 20q− abnormality is observed in 10% of patients with myeloproliferative neoplasms (MPNs), most commonly polycythemia vera (PV),2 in 4% of patients with myelodysplastic syndrome,3 and in 1% to 2% of patients with acute myeloid leukemia.4 Inactivation (or haploinsufficiency) of putative tumor suppressors on 20q has been proposed to explain the pathogenesis of these disorders.
We have been studying L3MBTL1, the human homolog of the Drosophila tumor suppressor gene, lethal(3)malignant brain tumor,5 whose inactivation results in overgrowth of adult optic neuroblasts and ganglion mother cells of the larval brain.6 We demonstrated that human L3MBTL1 functions as a transcriptional repressor,7 and after crystallizing the MBT repeat domain,8 determined that L3MBTL1 compacts chromatin by binding monomethylated and dimethylated lysine residues in histones H1 (H1K26) and H4 (H4K20).9,10 Two mutational analyses of small numbers of 20q− patient samples found no mutation in the nondeleted allele of L3MBTL1,11,12 suggesting that haploinsufficiency of L3MBTL1 would have to contribute to these disorders.
Despite the known role of L3MBTL1 in affecting chromatin structure, the function of L3MBTL1 in hematopoiesis is largely unknown. To define the role of L3MBTL1 in normal human hematopoiesis and its potential role in the 20q− myeloid disorders, we used RNA interference to reduce L3MBTL1 expression in human cord blood (CB) CD34+ hematopoietic stem/progenitor cells (HSPCs). We found that L3MBTL1 knockdown accelerated erythroid differentiation and increased signaling in response to erythropoietin (Epo), as well as low-level activation of the JAK-STAT, MAP kinase, and AKT signaling pathways in the absence of Epo. Similarly, we were able to impair erythroid differentiation by overexpressing L3MBTL1 in primary hematopoietic CD34+ cells and in 20q− cell lines. Thus, L3MBTL1 regulates human erythropoiesis, and lack of L3MBTL1 could contribute to the pathogenesis of 20q− disorders, in particular PV.
Methods
Purification and in vitro primary culture of human CB CD34+ cells
Mononuclear cells were isolated from CB (obtained from the New York Blood Center on a contractual basis) by Ficoll-Hypaque Plus density centrifugation. CD34+ HSPCs were purified by positive selection using the Midi-magnetic-activated cell sorting LS+ separation columns and isolation kit (Miltenyi). CD34+ cells were cultured in Iscove modified Dulbecco medium (IMDM, Cellgro) containing 20% BIT 9500 medium (Stem Cell Technologies) supplemented with stem cell factor (SCF; 100 ng/mL), Fms-like tyrosine kinase 3 (FLT-3; 10 ng/mL), interleukin-6 (IL-6; 20 ng/mL), and thrombopoietin (TPO; 100 ng/mL; these cytokines were purchased from PeproTech).
Generation of lentiviruses and infection of primary hematopoietic CD34+ cells
Lentiviral vectors were produced by transfection of 293T cells, according to standard protocols.13 After 24 hours of growth, CD34+ cells were infected with high-titer lentiviral concentrated suspensions, in the presence of 8 μg/mL polybrene (Sigma-Aldrich). Sequences targeted by short hairpin RNAs (shRNAs) were: GGAAAGACGATGACGGAAA (shLUC), GTAGTGAGTTGTAGATAAA (sh1), GGTCAGTCATAGTGGAGAA (sh2), and GCCTGCACTTTGATGGGTATT (sh3). shRNAs were cloned into the H1p HygroEGFP14 (shLUC, sh1, and sh2) or LKO vectors (empty vector and sh3). The luciferase-directed shRNA, cloned into the H1 vector, was used as control.15 A detailed description of the constructs is provided in supplemental Figure 1 (available on the Blood Web site; see the Supplemental Materials link at the top of the online article).
Flow cytometry
Transduced CB CD34+ cells were sorted for green fluorescence (GFP) and CD34 expression after staining with an allophycocyanin (APC)–conjugated anti-CD34 antibody (BD Biosciences PharMingen), using a fluorescence-activated cell sorting (FACS) Vantage cell sorter. Transduced K562 cells, cultured in RPMI medium supplemented with 10% fetal bovine serum, were sorted for GFP 72 hours after the infection. Cells were harvested for flow cytometry on days 7, 9, and 11 in cytokine-driven liquid culture. Cells were stained with the following antibodies: CD34-APC (BD Biosciences PharMingen), CD11b-phycoerythrin (PE; Immunotech), CD14-PE (Immunotech), CD71-APC (BD Biosciences PharMingen), glycophorin A-PE (Invitrogen), and CD41-PE (Immunotech) and analyzed by FACS. Analysis of progenitor cell populations was performed by staining cells with the following antibodies: CD3-PECy5, CD4-PECy5, CD7-PECy5, CD8-PECy5, CD10-PECy5, CD19-PECy5, CD20-PECy5, CD2-PECy5, CD11b-PECy5, CD56-PECy5, GPA-PECy5, CD45RA-FITC, CD38-PECy7, CD34-APC, and IL-3α-PE (BioLegend) and CD45RA-V450 (BD Biosciences PharMingen). The characterization of specific progenitor cell subsets (common myeloid progenitor [CMP], granulocyte-monocyte progenitor [GMP], and megakaryocyte-erythrocyte progenitor [MEP]) was performed by FACS analysis according to the methods described by Park et al.16
Cytokine-driven liquid culture conditions and isolation of MPN samples
CD34+ cells were cultured in 20% BIT in IMDM, with different cytokines to support erythroid, myeloid, or megakaryocytic cell differentiation. The erythroid cultures contained Epo (6 IU/mL) and SCF (100 ng/mL); the myeloid cultures SCF (100 ng/mL), FLT-3 (10 ng/mL), IL-3 (20 ng/mL), IL-6 (20 ng/mL), granulocyte-macrophage colony-stimulating factor (GM-CSF; 20 ng/mL), and granulocyte colony-stimulating factor (G-CSF; 20 ng/mL); the megakaryocytic cultures SCF (100 ng/mL), TPO (100 ng/mL), and IL-11 (50 ng/mL); and the basic cultures SCF (100 ng/mL), FLT-3 (10 ng/mL), IL-6 (20 ng/mL), and TPO (100 ng/mL). Epo and G-CSF were purchased from Amgen, and the other cytokines were purchased from PeproTech.
CD34+ cells were isolated from PV patient phlebotomy samples or essential thrombocythemia/myelofibrosis patient peripheral blood samples (obtained on an Memorial Sloan-Kettering Cancer Center Institutional Review Board–approved protocol) and cultured in serum-free stem cell expansion media supplemented with SCF (100 ng/mL), IL-3 (20 ng/mL), IL-6 (10 ng/mL), and Epo (0.5 IU/mL) every other day. Cells were harvested at day 7 or day 9 for Western blot assays. The cells were more than 70% CD71/Glycophorin A (GlyA) double-positive at these times of collection.
Cytospin preparations, Giemsa staining, and benzidine staining
A total of 2 × 10⁵ cells were centrifuged into slides for 5 minutes at 33g and air dried. Cells were stained with May-Grunwald-Giemsa stains and observed under light microscope for morphologic analysis. Benzidine staining was performed as described previously.17
RNA extraction and quantitative real-time RT-PCR
For quantitative reverse-transcription polymerase chain reaction (RT-PCR), total RNA was isolated from 2 × 10⁵ cells using the RNeasy mini kit (QIAGEN), and then subjected to reverse transcription with random hexamers (SuperScript III kit; Invitrogen). Real-time PCR reactions were performed using an ABI 7500 sequence detection system. A list of PCR primers is available on request.
Methylcellulose colony and LTC-IC assays
CFU assays.
A total of 1 × 10⁴ GFP+ CD34+ transduced cells were plated (in duplicate) in methylcellulose with Epo (5 IU/mL), SCF (50 ng/mL), IL-3 (20 ng/mL), IL-6 (20 ng/mL), G-CSF (20 ng/mL), and GM-CSF (20 ng/mL). Burst-forming units–erythroid (BFU-E), granulocyte-macrophage colony-forming units (CFU-GM), and CFU-granulocyte erythrocyte macrophage megakaryocyte colonies (GEMM) were scored 14 days after seeding. For the long-term culture–initiating cell (LTC-IC) assays, 4 × 10⁵ GFP+CD34+ cells were grown on MS-5 stromal cells in IMDM, supplemented with 12.5% horse serum, 12.5% fetal bovine serum, 4mM l-glutamine, 100 U/mL penicillin, 100 μg/mL streptomycin, and 1μM hydrocortisone. Medium was half-replenished every week, and cobblestone areas were scored at week 5. At week 5, cells were harvested and plated in methylcellulose medium with cytokines, as described for the CFU assay.
The images were captured by the Leica MZFL3 Stereoscope with a 0.5× plan objective. The camera used was a QImaging RetigaEx and Volocity Software 4.3.0 was used to acquire the images digitally.
Antibodies
The following antibodies were used for Western blot assays: the affinity-purified anti-L3MBTL1 antibody,7 pSTAT5 (Cell Signaling), STAT5 (Cell Signaling), pMAPK1/2 (Cell Signaling), MAPK (Cell Signaling), pAKT (Cell Signaling), AKT (Cell Signaling), pFOXO1/3 (Cell Signaling), JNK (Santa Cruz Biotechnology), JAK2 (Cell Signaling), p16 (Santa Cruz Biotechnology), and Raf-1 (Santa Cruz Biotechnology).
Ras activation assay
Ras-GTP was precipitated from total cell lysates using the Ras activation assay kit, purchased from Millipore, according to the manufacturer's instructions.
Overexpression assays
Retroviral vectors were produced by transfection of Phoenix A cells with the MIGR1 control or MIGR1 full-length L3MBTL1-HA c-DNA plasmids,9 according to standard protocols.13 CMK, U937, HEL, and K562 cells were grown in RPMI medium supplemented with 10% fetal bovine serum and infected with high-titer retroviral suspensions in the presence of 8 μg/mL polybrene (Sigma-Aldrich). Seventy-two hours after infection, the GFP-positive cells were sorted by FACS.
Results
Knockdown of L3MBTL1 accelerates erythroid differentiation of human hematopoietic CD34+ progenitor cells
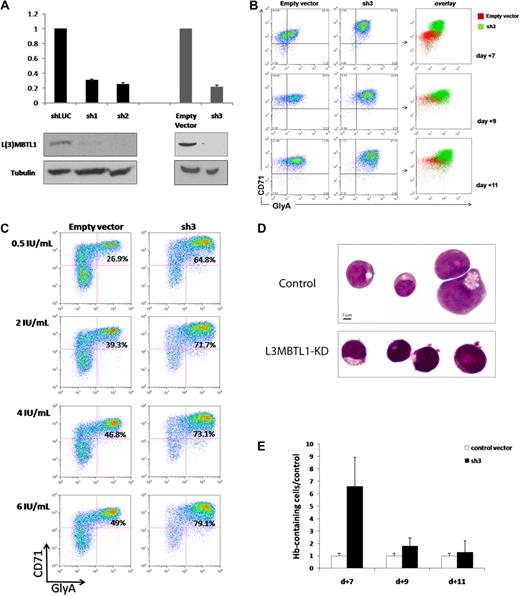
To investigate the function of L3MBTL1 in human hematopoiesis, we knocked down L3MBTL1 in CD34+ human CB cells, using lentiviruses expressing shRNAs targeting L3MBTL1, and 72 hours after infection documented the efficient knockdown of L3MBTL1 mRNA and protein in the sorted GFP+ CD34+ cells by quantitative RT-PCR and Western blot, for several different shRNA constructs (Figure 1A). These cells were then placed in Epo-driven liquid culture (6 IU/mL), and the expression of CD71 and GlyA was monitored by flow cytometry at different time points. The generation of mature erythroid precursor cells (CD71/GlyA double-positive cells) was consistently faster and more efficient for the L3MBTL1-KD cells, compared with the control vector-infected cells (Figure 1B; supplemental Figure 2). Furthermore, although CD71/GlyA double-negative cells were prominently found among the control cells, there were no CD71/GlyA double-negative cells after L3MBTL1-KD. These observations were consistently seen using several different shRNA constructs targeting L3MBTL1, demonstrating enhanced erythroid differentiation after L3MBTL1 depletion.
Knockdown of L3MBTL1 promotes the erythroid differentiation of human hematopoietic CD34+ progenitor cells. (A) Lentiviral constructs expressing shRNAs targeting luciferase (control) or L3MBTL1 (sh1 and sh2) led to efficient knockdown in primary CB CD34+ cells, as assessed by Western blot and quantitative RT-PCR. shRNAs of a different backbone (empty vector and sh3) also yielded efficient knockdown of L3MBTL1. All the presented data were confirmed using both sets of constructs. (B) Expression of CD71 and GlyA on human HSPCs, as assayed by flow cytometric analysis at days 7, 9, and 11 of Epo-induced culture. (C) Expression of CD71 and GlyA on human HSPCs, cultured with different concentrations of Epo, as assayed by flow cytometric analysis at 7 days. (D) Cells from panel B were stained with May-Grunwald-Giemsa on day 7 of Epo-induced culture, and their morphology was captured by light microscopy. (E) Epo-exposed cells at days 7, 9, and 11 of Epo-induced culture were resuspended in benzidine solution, and cells that stained dark blue-green were scored as positive.
Knockdown of L3MBTL1 promotes the erythroid differentiation of human hematopoietic CD34+ progenitor cells. (A) Lentiviral constructs expressing shRNAs targeting luciferase (control) or L3MBTL1 (sh1 and sh2) led to efficient knockdown in primary CB CD34+ cells, as assessed by Western blot and quantitative RT-PCR. shRNAs of a different backbone (empty vector and sh3) also yielded efficient knockdown of L3MBTL1. All the presented data were confirmed using both sets of constructs. (B) Expression of CD71 and GlyA on human HSPCs, as assayed by flow cytometric analysis at days 7, 9, and 11 of Epo-induced culture. (C) Expression of CD71 and GlyA on human HSPCs, cultured with different concentrations of Epo, as assayed by flow cytometric analysis at 7 days. (D) Cells from panel B were stained with May-Grunwald-Giemsa on day 7 of Epo-induced culture, and their morphology was captured by light microscopy. (E) Epo-exposed cells at days 7, 9, and 11 of Epo-induced culture were resuspended in benzidine solution, and cells that stained dark blue-green were scored as positive.
To evaluate the sensitivity of L3MBTL1-KD cells to Epo, we measured GlyA and CD71 expression by FACS analysis in the L3MBTL1-KD HSPCs after plating these cells in culture with SCF (100 ng/mL) and different doses of Epo (0.5, 2, 4, and 6 U/mL). At the lowest concentration of Epo (0.5 IU/mL), and at all tested concentrations of Epo, the L3MBTL1-KD cells showed accelerated erythroid maturation compared with control cells (2.4-, 1.8-, 1.6-, and 1.6-fold, respectively; Figure 1C).
Consistent with the immunophenotypic evidence, these cells also showed morphologic evidence of erythroid differentiation after L3MBTL1-KD. As erythroid differentiation proceeds, erythroblasts display a gradual decrease in cell size, increase in chromatin condensation, and increase in hemoglobin (Hb) concentration,18 and indeed, the L3MBTL1-KD cells appeared smaller with more condensed chromatin than the control cells (which displayed a larger, more homogeneous, and eccentrically placed nucleus, as seen in Figure 1D). Likewise, benzidine staining revealed a 6.6-fold enrichment of Hb-containing cells compared with controls at day 7 of culture, consistent with the time of highest immunophenotypic difference, with a 1.7-fold and 1.3-fold enrichment at days 9 and 11 of culture (Figure 1E). These results further indicate a role for L3MBTL1 in regulating the erythroid differentiation of human HSPCs.
L3MBTL1 expression decreases during normal erythroid differentiation of human HSPCs
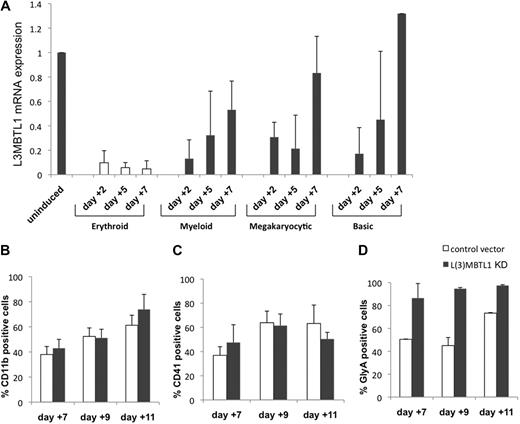
To investigate whether changes in L3MBTL1 expression are only seen during erythroid differentiation, we cultured normal CB CD34+ cells in various cytokine cocktails that preferentially support erythroid, myeloid, or megakaryocytic differentiation and evaluated L3MBTL1 expression (by quantitative RT-PCR) at different time points. L3MBTL1 is down-regulated on differentiation generally, but especially in cells exposed to the erythroid-promoting cytokines SCF plus Epo (Figure 2A). These cells maintain a low-level L3MBTL1 expression over time, whereas the cells grown under other culture conditions show a rebound in L3MBTL1 expression by day 7.
L3MBTL1 knockdown specifically promotes erythroid, but not myeloid or megakaryocytic, differentiation of human CD34+ cells. (A) L3MBTL1 expression levels were assessed by quantitative RT-PCR in normal CD34+ CB cells. The cells were placed in different culture conditions stimulating erythroid, myeloid, and megakaryocytic differentiation for 2, 5, and 7 days. Total RNA was extracted from 2 × 10⁵ cells. (B) Seventy-two hours after lentiviral infection, GFP+CD34+ cells were cultured in myeloid conditions for 7, 9, and 11 days, and the expression of myeloid-specific markers CD11b (CD14 and CD33 not shown) was assessed by flow cytometric analysis (n = 3). (C) Seventy-two hours after lentiviral vector infection, the GFP+CD34+ cells were cultured in megakaryocytic conditions for 7, 9, and 11 days, and expression of the megakaryocytic-specific marker CD41 was assessed by flow cytometric analysis (n = 3). (D) GFP+CD34+ cells, 72 hours after lentiviral vector infection, were cultured in erythroid conditions for 7, 9, and 11 days, and expression of the erythroid-specific marker GlyA was assessed by flow cytometric analysis (n = 3).
L3MBTL1 knockdown specifically promotes erythroid, but not myeloid or megakaryocytic, differentiation of human CD34+ cells. (A) L3MBTL1 expression levels were assessed by quantitative RT-PCR in normal CD34+ CB cells. The cells were placed in different culture conditions stimulating erythroid, myeloid, and megakaryocytic differentiation for 2, 5, and 7 days. Total RNA was extracted from 2 × 10⁵ cells. (B) Seventy-two hours after lentiviral infection, GFP+CD34+ cells were cultured in myeloid conditions for 7, 9, and 11 days, and the expression of myeloid-specific markers CD11b (CD14 and CD33 not shown) was assessed by flow cytometric analysis (n = 3). (C) Seventy-two hours after lentiviral vector infection, the GFP+CD34+ cells were cultured in megakaryocytic conditions for 7, 9, and 11 days, and expression of the megakaryocytic-specific marker CD41 was assessed by flow cytometric analysis (n = 3). (D) GFP+CD34+ cells, 72 hours after lentiviral vector infection, were cultured in erythroid conditions for 7, 9, and 11 days, and expression of the erythroid-specific marker GlyA was assessed by flow cytometric analysis (n = 3).
Given the increased erythroid differentiation after L3MBTL1-KD, we also assessed whether L3MBTL1-KD altered myeloid and/or megakaryocytic differentiation. L3MBTL1-KD and control GFP+ CD34+ cells grown in G-CSF–driven liquid culture showed similar expression of myeloid-specific cell surface markers (CD11b, CD14, or CD33, Figure 2B; and data not shown). Similarly, we observed no effect on the expression of the megakaryocyte marker CD41 in TPO-driven cultures (Figure 2C), demonstrating that L3MBTL1 depletion specifically affects erythroid differentiation (Figure 2D).
To investigate whether known regulators of erythropoiesis were up-regulated after L3MBTL1-KD, we quantified the level of Epo-receptor, GATA-1, FOG-1, NF-E2, LMO2, and FKLF mRNA expression in L3MBTL1-KD CD34+ cells plated in Epo-induced liquid cultures and found an “erythroid signature,” as shown in supplemental Figure 3. However, none of these genes was up-regulated in the L3MBTL1-KD CD34+ cells, 72 hours after viral infection, before they were plated in cytokine-induced culture conditions, even though we did find down-regulation of PU.1, RUNX1, and CEBPα mRNA (data not shown), genes known to be down-regulated during erythropoiesis. Thus, we cannot attribute the pro-erythroid effects of L3MBTL1-KD to changes in any of these “erythroid-associated genes,” at this time.
Knockdown of L3MBTL1 induces leukemia cell differentiation toward the erythroid lineage
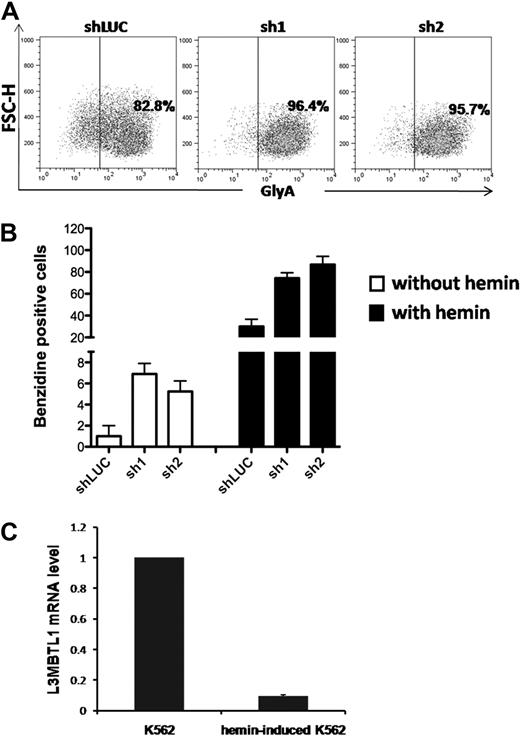
To determine whether L3MBTL1-KD can also affect the differentiation of leukemia cells, we used lentiviral vectors to express shRNA-targeting luciferase (shLUC) or L3MBTL1 (sh1 and sh2) in K562 cells. We sorted GFP+ cells (by FACS) 72 hours after infection and as seen in CB cells, KD of L3MBTL1 in K562 cells increased GlyA expression, compared with control cells (Figure 3A; supplemental Figure 4), and led to higher benzidine staining before and after hemin exposure (Figure 3B). As hemin is known to trigger the erythroid differentiation of K562 cells17 and activate globin gene expression,19 we studied L3MBTL1 expression in K562 erythroleukemia cells after hemin exposure. Four days of hemin exposure (at 50μM) markedly decreased the level of L3MBTL1 mRNA (Figure 3C) commensurate with an increase in benzidine-positive cells and increased globin gene expression (data not shown). Thus, L3MBTL1 loss can induce erythroid differentiation in leukemia cells as well as in normal human HSPCs.
Knockdown of L3MBTL1 induces further erythroid differentiation of K562 erythroleukemia cells. (A) K562 cells, grown in RPMI medium supplemented with 10% fetal bovine serum, without exogenous cytokines or hemin, were infected with lentiviral constructs targeting luciferase (shLUC) or L3MBTL1 (sh1 and sh2). GFP+ cells, sorted by FACS at 72 hours after infection, were analyzed for GlyA expression by flow cytometry. (B) GFP+ K562 cells, before and after exposure to hemin (50μM) for 4 days, were stained with benzidine to assess their Hb content. (C) K562 cells were treated with 50μM hemin for 4 days and the L3MBTL1 mRNA level assessed in the hemin-exposed versus the nontreated cells by quantitative RT-PCR (n = 3).
Knockdown of L3MBTL1 induces further erythroid differentiation of K562 erythroleukemia cells. (A) K562 cells, grown in RPMI medium supplemented with 10% fetal bovine serum, without exogenous cytokines or hemin, were infected with lentiviral constructs targeting luciferase (shLUC) or L3MBTL1 (sh1 and sh2). GFP+ cells, sorted by FACS at 72 hours after infection, were analyzed for GlyA expression by flow cytometry. (B) GFP+ K562 cells, before and after exposure to hemin (50μM) for 4 days, were stained with benzidine to assess their Hb content. (C) K562 cells were treated with 50μM hemin for 4 days and the L3MBTL1 mRNA level assessed in the hemin-exposed versus the nontreated cells by quantitative RT-PCR (n = 3).
Loss of L3MBTL1 leads to expansion of erythroid progenitors in long-term cultures
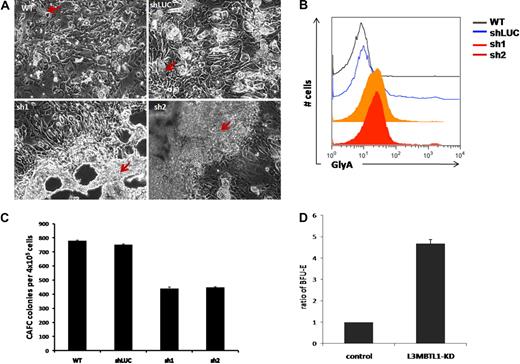
To elucidate the role of L3MBTL1 in the earliest stem/progenitor cells, we performed LTC-IC assays, culturing 4 × 10⁵ GFP+ CD34+ transduced cells on MS5 stromal cells. We observed an impressive expansion of progenitor cells from the L3MBTL1-KD cells at week 5. The L3MBTL1-KD cells grew mostly on top of the MS5 layer, in sheets of cells rather than cobblestones, whereas the control cells formed normal cobblestones that grew underneath the stromal layer (Figure 4A). To define the nature of these cells, we used flow cytometry to define their lineage-specific cell surface marker profile. The L3MBTL1-KD showed strikingly higher GlyA expression compared with control cells, suggesting that these cells are erythroid progenitors (Figure 4B). Furthermore, when the week 5 culture of the LTC-IC assay cells was plated in methylcellulose, we observed a greater number of BFU-E among the KD cells than the control cells (Figure 4D). Nonetheless, KD of L3MBTL1 did decrease stem cell frequency in both limiting dilution and bulk CAFC assays (Figure 4C).
L3MBTL1-KD leads to expansion of erythroid progenitors in long-term culture. (A) Sorted 4 × 10⁵ GFP+ CD34+ were plated on MS5 stromal cell layer and cultured for 5 weeks. At week 5, the colonies were examined using an inverted optical microscope. The red arrows indicate the cobblestone area forming cells in the wt and shLUC figures. The red arrows indicate the overgrowth of progenitor cells (predominantly erythroid) in the sh1 and sh2 photographs. (B) The expression of GlyA on floating cells from 5-week LTC-IC cultures was evaluated by flow cytometry. (C) CAFC colony numbers were evaluated at week 5 of MS-5 stromal cell–based culture (n = 2). (D) Week 5 LTC-IC cells were plated on methylcellulose, and the secondary BFU-E colonies were scored after 10 days. The ratio of BFU-E colonies is shown, based on BFU-E numbers in the control cells.
L3MBTL1-KD leads to expansion of erythroid progenitors in long-term culture. (A) Sorted 4 × 10⁵ GFP+ CD34+ were plated on MS5 stromal cell layer and cultured for 5 weeks. At week 5, the colonies were examined using an inverted optical microscope. The red arrows indicate the cobblestone area forming cells in the wt and shLUC figures. The red arrows indicate the overgrowth of progenitor cells (predominantly erythroid) in the sh1 and sh2 photographs. (B) The expression of GlyA on floating cells from 5-week LTC-IC cultures was evaluated by flow cytometry. (C) CAFC colony numbers were evaluated at week 5 of MS-5 stromal cell–based culture (n = 2). (D) Week 5 LTC-IC cells were plated on methylcellulose, and the secondary BFU-E colonies were scored after 10 days. The ratio of BFU-E colonies is shown, based on BFU-E numbers in the control cells.
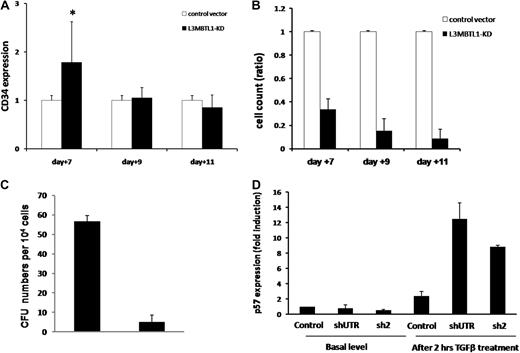
These findings suggest that L3MBTL1 knockdown may not only promote the premature differentiation of erythroid committed cells but may also recruit more progenitor cells to differentiate toward the erythroid lineage. Indeed, when we sorted the L3MBTL1-KD cells into the CMP (CD34+CD38+IL3Rα+CD45Rα−Lin−), MEP (CD34+CD38+IL3Rα−CD45Rα−Lin−), and GMP (CD34+CD38+IL3Rα+CD45Rα+Lin−) progenitor cell subsets, we found a modest increase of the MEP and GMP populations, at the expense of the CMP cells (supplemental Figure 5). This implies that loss of L3MBTL1 in progenitor cells can also drive them to differentiate. To further address this issue, we evaluated the ability of L3MBTL1-KD HSPCs to maintain CD34 expression over time. Whereas CD34 expression was initially higher in the KD cells, by day 11 we found no difference in CD34 expression between the KD and the control cells (Figure 5A). Given these findings, we evaluated whether the commitment toward the erythroid lineage that follows L3MBTL1 down-modulation impairs the proliferative potential of HSPCs. Cell counts at each time point (days 7, 9, and 11) revealed slower growth of KD-HSPCs compared with control cells in liquid cultures with SCF, IL-3, TPO, and FLT-3 (Figure 5B), or Epo, G-CSF, and TPO (data not shown). We also evaluated the clonogenic ability of sorted CD34+ L3MBTL1-KD HSPCs in CFU assays and found decreased progenitor frequency compared with controls; all types of colonies were less frequent (Figure 5C).
Proliferation potential of L3MBTL1-KD human hematopoietic progenitor cells. (A) The maintenance of CD34 expression was evaluated in L3MBTL1-KD CB cells by flow cytometry. GFP+CD34+ CB cells were cultured with SCF, FLT-3, IL-6, and TPO. *P < .005. (B) Cell counts of L3MBTL1-KD CB cells were monitored at different time points in liquid culture with SCF, FLT-3, IL-6, and TPO. (C) Seventy-two hours after lentiviral infection, sorted GFP+CD34+ HPCs were placed in CFU assays and the number of CFUs quantified. (D) p57 mRNA expression was assessed by quantitative RT-PCR in L3MBTL1-KD HPCs, with and without exposure to 200pM TGF-β1 for 2 hours (n = 2).
Proliferation potential of L3MBTL1-KD human hematopoietic progenitor cells. (A) The maintenance of CD34 expression was evaluated in L3MBTL1-KD CB cells by flow cytometry. GFP+CD34+ CB cells were cultured with SCF, FLT-3, IL-6, and TPO. *P < .005. (B) Cell counts of L3MBTL1-KD CB cells were monitored at different time points in liquid culture with SCF, FLT-3, IL-6, and TPO. (C) Seventy-two hours after lentiviral infection, sorted GFP+CD34+ HPCs were placed in CFU assays and the number of CFUs quantified. (D) p57 mRNA expression was assessed by quantitative RT-PCR in L3MBTL1-KD HPCs, with and without exposure to 200pM TGF-β1 for 2 hours (n = 2).
As the cell's proliferative potential appears to be slightly decreased after L3MBTL1-KD, we tested the sensitivity of HSPCs to transforming growth factor-β (TGF-β). We treated CD34+ cells with 200pM TGF-β, which induces the expression of p5720 ; we observed a greater induction of p57 mRNA in L3MBTL1-KD cells at 2 hours compared with control cells (Figure 5D); no change in p57 expression was observed in the KD cells in the absence of TGF-β.
L3MBTL1-KD alters the Epo-dependent and Epo-independent phosphorylation of STAT5, AKT, and MAP kinase
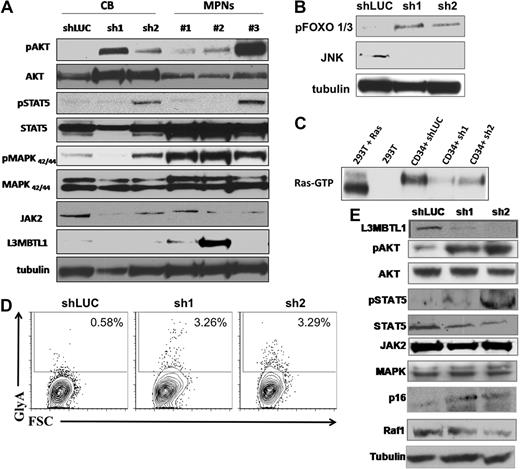
To investigate the effect of L3MBTL1-KD on intracellular signaling pathways, we prepared lysates from CD34+ L3MBTL1-KD cells cultured in Epo for 1 week and performed Western blot analyses. We found increased signaling downstream of the Epo receptor, with consistently greater phosphorylation of AKT, FOXO 1/3, and MAPK and variably increased phosphorylation of JAK2 and STAT5, compared with controls (Figure 6A-B). RAS-GTP and Raf-1 protein levels were decreased in the L3MBTL1-KD cells, consistent with the enhanced erythroid maturation (Figure 6C,E). Overall, this pattern of activation mirrors the activation of signaling pathways seen in similarly cultured CD34+ HSPCs isolated from JAK2V617F+ MPN patients (Figure 6A).
Primary hematopoietic cells lacking L3MBTL1 show Epo-independent phosphorylation of STAT5, AKT, and MAP kinase. (A) Primary GFP+ CD34+ cells were harvested after one week in erythroid culture and lysed, according to standard protocols. Cultured CD34+ cells from MPN patients bearing the JAK2V617F mutation were harvested after 1 week of culture in Epo. Phosphorylation of STAT5, AKT, and MAPK was assessed by Western blot. The protein levels of JAK2, STAT5, AKT, MAPK, and L3MBTL1 were also assessed. (B) Primary GFP+ CD34+ cells were harvested after one week in erythroid culture and FOXO phosphorylation, and JNK expression levels were assessed by Western blot assay. Tubulin serves as a loading control for panels A, B, and E. (C) A total of 2 × 10⁷ GFP+ CD34+ cells, plated in erythroid culture conditions, were tested for Ras activation, by detection of GTP-bound Ras. Cells were lysed and incubated with (GST)-Raf-RBD fusion protein coupled to glutathione agarose beads. GTP-bound Ras was detected by Western blotting using an isoform-specific antibody. (D) Expression of the erythroid markers CD71 and GlyA was evaluated on L3MBTL1-KD CB cells cultured without Epo, in SCF, FLT-3, IL-6, and TPO. (E) After 1 week in culture without Epo, the GFP+ CD34+ cells were lysed, and phosphorylation of STAT5 and AKT was assessed by Western blot analysis. The protein levels of JAK2, STAT5, AKT, MAPK, Raf-1, p16, and L3MBTL1 were also assessed.
Primary hematopoietic cells lacking L3MBTL1 show Epo-independent phosphorylation of STAT5, AKT, and MAP kinase. (A) Primary GFP+ CD34+ cells were harvested after one week in erythroid culture and lysed, according to standard protocols. Cultured CD34+ cells from MPN patients bearing the JAK2V617F mutation were harvested after 1 week of culture in Epo. Phosphorylation of STAT5, AKT, and MAPK was assessed by Western blot. The protein levels of JAK2, STAT5, AKT, MAPK, and L3MBTL1 were also assessed. (B) Primary GFP+ CD34+ cells were harvested after one week in erythroid culture and FOXO phosphorylation, and JNK expression levels were assessed by Western blot assay. Tubulin serves as a loading control for panels A, B, and E. (C) A total of 2 × 10⁷ GFP+ CD34+ cells, plated in erythroid culture conditions, were tested for Ras activation, by detection of GTP-bound Ras. Cells were lysed and incubated with (GST)-Raf-RBD fusion protein coupled to glutathione agarose beads. GTP-bound Ras was detected by Western blotting using an isoform-specific antibody. (D) Expression of the erythroid markers CD71 and GlyA was evaluated on L3MBTL1-KD CB cells cultured without Epo, in SCF, FLT-3, IL-6, and TPO. (E) After 1 week in culture without Epo, the GFP+ CD34+ cells were lysed, and phosphorylation of STAT5 and AKT was assessed by Western blot analysis. The protein levels of JAK2, STAT5, AKT, MAPK, Raf-1, p16, and L3MBTL1 were also assessed.
To determine whether knockdown of L3MBTL1 can contribute to the Epo-independent erythroid cell growth found in MPN patients, we placed sorted CD34+ L3MBTL1-KD cells in Epo-free culture media supplemented with SCF, IL-6, FLT-3, and TPO for 1 week and found a small GlyA-positive (ie, erythroid progenitor) cell population in the L3MBTL1-KD cells (Figure 6D). Despite the absence of Epo, phosphorylation of STAT5 and AKT was clearly seen (Figure 6E). Moreover, L3MBTL1-KD cells also displayed increased p16INK4a expression (Figure 6E), a protein associated with the induction of erythropoiesis in primary PV samples.21,22
To assess whether decreased L3MBTL1 expression could be implicated in the pathogenesis of non-20q− MPNs, we evaluated the expression of L3MBTL1 in granulocytes obtained from 75 MPN patients, 28 patients with PV, and 47 patients with ET (who did not show loss of 20q) and compared it with the level of expression in granulocytes obtained from 10 normal donors using Affymetrix HGU133a.2 arrays. We observed a more than or equal to 20% decrease in the expression of L3MBTL1 in 43% of the PV samples (12 of 28) and 62% of the essential thrombocythemia samples (29 of 47) compared with the normal controls (P < .001 and P < .001, respectively; data not shown). This suggests that down-regulation of L3MBTL1 may also play a role in non-20q− myeloproliferative neoplasms.
L3MBTL1 restricts erythroid differentiation
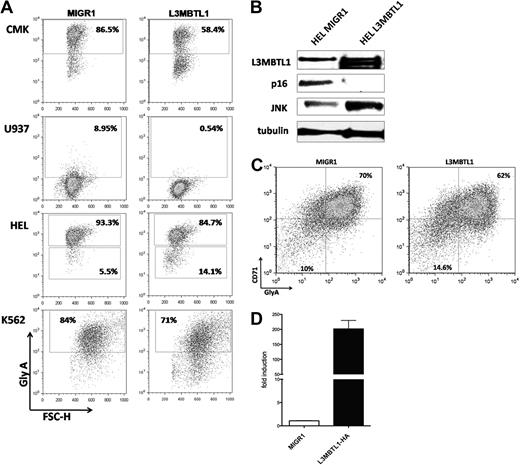
To address the function of L3MBTL1 in 20q− disorders and to explore the mechanism by which L3MBTL1 affects erythroid differentiation, we overexpressed the full-length L3MBTL1-HA c-DNA in 3 human 20q− hematopoietic cell lines (ie, HEL, CMK, and U937 cells) and in K562 cells. We sorted the GFP+ cells and evaluated GlyA expression by FACS analysis: L3MBTL1-HA expressing cells showed decreased expression of glycophorin A (Figure 7A), suggesting that L3MBTL1 restricts erythroid differentiation. The decreased GlyA expression was seen in CMK (58% vs 86%) and U937 cells (0.5% vs 9%), as well as in HEL (85% vs 93%) and K562 cells (71% vs 84%).
L3MBTL1 restricts erythroid differentiation. (A) GlyA expression was assessed by FACS in the L3MBTL1-HA expressing CMK, U937, HEL, and K562 cells compared with the MIGR1 (empty vector) transduced cells. (B) p16 protein expression levels were determined by Western blot analysis in L3MBTL1-HA HEL cells versus the MIGR1 (empty vector) control HEL cells. JNK and L3MBTL1 levels are also shown. Tubulin served as the loading control. (C) GlyA expression in L3MBTL1-HA expressing CD34+ cells after 3 days of culture with SCF 100 ng/mL and Epo 6 IU/mL, compared with the MIGR1 (empty vector) transduced cells. (D) L3MBTL1 mRNA expression levels in retrovirally infected CD34+ cells, quantified by quantitative PCR (n = 3).
L3MBTL1 restricts erythroid differentiation. (A) GlyA expression was assessed by FACS in the L3MBTL1-HA expressing CMK, U937, HEL, and K562 cells compared with the MIGR1 (empty vector) transduced cells. (B) p16 protein expression levels were determined by Western blot analysis in L3MBTL1-HA HEL cells versus the MIGR1 (empty vector) control HEL cells. JNK and L3MBTL1 levels are also shown. Tubulin served as the loading control. (C) GlyA expression in L3MBTL1-HA expressing CD34+ cells after 3 days of culture with SCF 100 ng/mL and Epo 6 IU/mL, compared with the MIGR1 (empty vector) transduced cells. (D) L3MBTL1 mRNA expression levels in retrovirally infected CD34+ cells, quantified by quantitative PCR (n = 3).
We also overexpressed L3MBTL1 in primary human CD34+ cells, obtaining an almost 200-fold increase in L3MBTL1 expression, as documented by quantitative RT-PCR (Figure 7D). We placed the sorted GFP+ CD34+ cells in Epo-induced liquid culture and consistently found a decreased percentage of CD71+/GlyA+ cells (62% vs 70%) after 3 days of culture (Figure 7C). The milder decrease in GlyA expression seen in primary human CD34+ cells, compared with the 20q− cells, may reflect the normal genetic background of the transduced cells and their intrinsic growth rates. Overexpression of L3MBTL1 in HEL cells did decrease the expression of p16INK4 (Figure 7B), further suggesting that L3MBTL1 may affect erythropoiesis by regulating (ie, repressing) p16 expression. Further studies are needed to address this issue.
Discussion
Haploinsufficiency of the polycomb group (PcG) gene L3MBTL1 has been identified in patients with 20q−-associated myeloid malignancies,11,12 but whether this has functional relevance for these disorders has not been previously determined. We have demonstrated that L3MBTL1 loss induces the erythroid differentiation of human HSPCs and therefore could contribute to the most common 20q−-associated hematologic disorder, PV. Further, L3MBTL1-KD CD34+ cells show an enhanced response to Epo, resulting in the more rapid development of immunophenotypically and morphologically mature erythroblasts with increased hemoglobin content, compared with control cells. We have demonstrated the increased sensitivity of L3MBTL1 knockdown hematopoietic stem/progenitor cells to Epo at different concentrations of Epo and at very early time points. The erythroid commitment that follows L3MBTL1-KD occurs early, based on the erythroid progenitor cell expansion seen in the LTC-IC assay. However, the observed changes in the frequency of the different human progenitor cell subsets (decreased CMP and increased GMP and MEP cells) may indicate a second effect, in the committed progenitor cell population.
L3MBTL1 is classified as a polycomb group protein, and recent evidence suggests that PcG proteins regulate stem cell pluripotency by maintaining the repression of lineage-specifying genes that trigger the differentiation process.23,24 L3MBTL1 is down-regulated on Epo- or hemin-induced erythroid differentiation. L3MBTL1 is also down-regulated, or at least is less abundant in MEP cells compared with more immature stem cells or progenitor cell populations (such as CMP), which suggests that erythroid differentiation may require “silencing” of L3MBTL1 function. As a compactor of euchromatin, L3MBTL1 could serve as an epigenetic brake on erythroid commitment. Gene expression profiling of cells treated with Epo supports this hypothesis, as L3MBTL1 is one of the genes most strongly down-regulated on Epo exposure.25 Pr-Set7, an H4K20-specific methyltransferase that physically associates with L3MBTL1 and is responsible for the H4K20 methyl mark that serves as a docking site for L3MBTL1 binding, is also down-regulated in hemin-treated K562 cells,9,26 which suggests that, by binding chromatin and maintaining repression of its target genes, L3MBTL1 impairs erythroid differentiation.
Recently, the ability of reactive oxygen species to trigger the precocious differentiation of Drosophila stem cells into all 3 mature blood cell types has been linked to down-regulation of PcG expression.27 This down-regulation is associated with JNK activation, and it triggers differentiation toward lamellocyte but not plasmatocyte or crystal cell differentiation, somewhat similar to the effects of L3MBTL1 KD on erythroid, but not myeloid or megakaryocytic, lineages. Reactive oxygen species triggers FOXO activation27 ; similarly, we found increased phosphorylation/activation of the STAT5, AKT/FOXO, and MAPK pathways in L3MBTL1-KD HSPCs, even in the absence of Epo. Such Epo-independent signaling is a hallmark of the MPNs, especially PV. PcG members specifically repress the JAK-STAT pathway in the Drosophila eye imaginal disc,28 and our data suggest that L3MBTL1 acts in a fashion similar to regulate erythroid differentiation.
We also found increased expression of p16INK4a in L3MBTL1-KD cells. Increased expression of p16INK4A is also found in erythroid colony-forming cells isolated from patients with PV.21 p16 has been linked to erythroid differentiation and apoptosis in erythroleukemia cells22 and may play a role in mediating the effects of L3MBTL1 in erythropoiesis because we also observed down-regulation of p16 after L3MBTL1 overexpression. Like p16 up-regulation, down-regulation of FoxOs by L3MBTL1-KD could also contribute to the decreased CAFC frequency seen after L3MBTL1-KD.29 Although we previously reported that L3MBTL1-KD can increase c-myc levels in some cell types, and cyclin E or cyclin A levels in others,10,30 we did not observe such increases in the human CD34+ cells at the time points assayed (data not shown). Such increases are seen in terminally differentiated cells (such as 293T cells) and may be needed for cells to manifest a strong proliferative response to L3MBTL1-KD.
In future studies, we wish to determine whether L3MBTL1 loss can cooperate with the constitutively activated mutant JAK2 kinases found in patients with MPNs. There appears to be a relationship between del20q and the occurrence of the JAK2 V617F mutation. In one study of 29 patients with 20q deletion, 28 were found to be JAK2 V617F+.31 In another study of MPN patient samples, the JAK2V617F/JAK2 burden was 2% to 25% of the clonal cells, even though all of the clonal cells had del20q.32 Whereas these studies suggest that the 20q deletion may represent one of several pre-JAK2 events (others being mutations in TET2, ASXL1, c-CBL, or currently unknown proteins),33,34 Schaub et al have reported that del20q may occur after the acquisition of JAK2V617F in some clones.35 It is possible that, during the genesis of the MPNs, the acquisition of additional genetic mutations (ie, JAK2V617F) allows L3MBTL1-deficient cells to override the antiproliferative mechanisms elicited by p16 or MAPK activation.
L3MBTL1 plays a key role in hematopoiesis by regulating the erythroid differentiation of HSPCs. Given that L3MBTL1 is located within the common deleted region on 20q seen in patients with PV, our data suggest that loss of L3MBTL1 is important in the pathogenesis of such disorders.
The online version of this article contains a data supplement.
The publication costs of this article were defrayed in part by page charge payment. Therefore, and solely to indicate this fact, this article is hereby marked “advertisement” in accordance with 18 USC section 1734.
Acknowledgments
We thank Christopher Park for the analysis of human progenitor cells, Benjamin Ebert for providing MPN patient samples, and Emanuela Romano and James Young for providing important reagents.
This work was supported by Associazione Cristina Bassi contro le leucemie acute dell'adulto and American Italian Cancer Foundation postdoctoral fellowships to F.P.; and NCI R01 grant 102202 to S.D.N.
We dedicate this paper to the late Bruno Rotoli, whose devotion to his patients, his mentees, and his profession will always be remembered, and to the late Piernicola Boccuni, whose prior investigations of L3MBTL1 made this study possible.
National Institutes of Health
Authorship
Contribution: F.P. conducted experiments, analyzed the data, and wrote the paper; N.G. designed shRNAs, performed experiments, and analyzed the data; R.H.-A. designed shRNAs and performed the Ras pull-down experiments; O.A.-W. and R.L.L. analyzed the MPN patient database and helped with the progenitor cell analysis; T.A. helped perform the long-term colony assays; F.V. and S.M. helped with cell cultures and plasmids; L.W., F.L., and X.Z. provided technical expertise; and S.D.N. supervised the experimental design and helped write and edit the paper.
Conflict-of-interest disclosure: The authors declare no competing financial interests.
Correspondence: Stephen D. Nimer, Memorial Sloan-Kettering Cancer Center, 1275 York Ave, New York, NY 10065; e-mail: s-nimer@mskcc.org.
References
Author notes
F.P. and N.G. contributed equally to this study.

This feature is available to Subscribers Only
Sign In or Create an Account Close Modal