Abstract
We determined the sequence of events and identified and quantitatively characterized the mobility of moving structures present during the early stages of fibrin-clot formation from the beginning of polymerization to the gel point. Three complementary techniques were used in parallel: spinning-disk confocal microscopy, transmission electron microscopy, and turbidity measurements. At the beginning of polymerization the major structures were monomers, whereas at the middle of the lag period there were monomers, oligomers, protofibrils (defined as structures that consisted of more than 8 monomers), and fibers. At the end of the lag period, there were primarily monomers and fibers, giving way to mainly fibers at the gel point. Diffusion rates were calculated from 2 different results, one based on sizes and another on the velocity of the observed structures, with similar results in the range of 3.8-0.1 μm2/s. At the gel point, the diffusion coefficients corresponded to very large, slow-moving structures and individual protofibrils. The smallest moving structures visible by confocal microscopy during fibrin polymerization were identified as protofibrils with a length of approximately 0.5 μm. The sequence of early events of clotting and the structures present are important for understanding hemostasis and thrombosis.
Introduction
Fibrin-clot formation is a stepwise process, the first step being cleavage of fibrinogen by thrombin to remove fibrinopeptide A, which exposes the knobs ‘A’ binding sites to form fibrin monomers.1-3 The fibrin monomers polymerize in a half-staggered manner, producing small oligomers and protofibrils4-7 with a periodicity of 22.5 nm, as shown by electron microscopy and X-ray diffraction.8 The next step is lateral aggregation: the association of protofibrils side by side. To proceed from longitudinal to lateral growth, protofibrils must be sufficiently long, approximately in the range of 0.6-0.8 μm.9 Next, the fibrin network is established through fiber branching and lateral and longitudinal growth, resulting in a gel.10 Finally, there is some network rearrangement due to new fiber formation.11 The rate of polymerization is affected by many factors, including the rate of fibrinopeptide cleavage, oligomer formation, and lateral aggregation.12 Recently, we described the sequence of events during fibrin-network formation in the hydrated clot as observed by deconvolution microscopy during real-time polymerization.11
Fibrin polymerization is a dynamic process, which makes it difficult to study. We found that at the early stages of network formation, fibers are mobile,11 but we were not able to characterize the movements of the fibers quantitatively. To quantify this type of movement, it is necessary to collect a large stack of images in a short time. To resolve this issue, in the research reported here, we used a spinning-disk confocal microscope, which has the advantage over the deconvolution microscope that it has multiple pinholes in a disk rotating as rapidly as 1800-5000 rpm, providing very fast, video-rate image acquisition. However, the resolution limit of any light microscope does not allow the detailed visualization of small structures such as fibrin monomers, dimers, trimers, and tetramers, which appear at the beginning of polymerization. Transmission electron microscopy has been used to visualize such small structures that form at different times up until the gel point. Therefore, in the present work, spinning-disk confocal microscopy, electron microscopy, and turbidity measurements were used together to monitor fibrin polymerization dynamically with good temporal and spatial resolution. The sequence of early events of fibrin-clot formation and changes in the proportion of structures (monomers, dimers, trimers, protofibrils, and fibers) were characterized as a function of time from the beginning of polymerization to the gel point. The mobility and sizes of fibrin-related structures were characterized quantitatively, and the smallest moving structures visible in the light microscope were identified. These new findings bring us closer to understanding the early stages of clot formation, which may help to interpret the clinical significance of changes in the gel point and lead to new methods in the treatment and prophylaxis of thrombosis.
Methods
Fibrin polymerization reaction and gel-point measurements
Polymerization was carried out in 50mM Tris-HCl, 140mM NaCl, pH 7.4, and 2.5mM CaCl2 by mixing 1.5 mg/mL of purified human plasminogen-free fibrinogen (HYPHEN BioMed) and 0.1 U/mL of thrombin (final concentrations). Alexa Fluor 488–labeled fibrinogen (Invitrogen) with an average of 6 molecules of dye per molecule of protein was added to the polymerization mixture at a final concentration of 0.03 mg/mL. After all components were mixed, the sample was inserted into a Sigmacoat-treated glass chamber made of a microscope slide and a coverslip separated by 2 strips of double-stick tape such that the height of the chamber was 350 μm.11 Sigmacoat was used to produce a very thin hydrophobic film on the glass surface to reduce surface effects.
The time of the change from the liquid to the solid state is called the gel point. To measure the gel point, the polymerization mixture was prepared in transparent, Sigmacoat-treated glass tubes. A timer was started after all components were mixed, and the gel point was observed by eye, with 5 replicates for each sample.
Light-microscopy studies
Polymerization reactions were carried out as described in “Fibrin polymerization reaction and gel point measurements.” A stack of 26 images was acquired in real time during the fibrin-polymerization reaction every 16 seconds for 45 minutes using a spinning-disk confocal microscope consisting of a Yokogawa CSU 10 scanner combined with an Olympus IX 71 microscope using a 63×/1.4 NA Plan Apo or 20× objective lens (Olympus). A back-thinned electron-multiplying charge-coupled device camera (C9100-13) was used for image capture (Hamamatsu). A diode laser (Spectral Applied Research) was used for excitation at 488 nm. IPLab 4.0.8 software (BD Biosciences) controlled all aspects of image acquisition.
Quantitative analysis and identification of moving structures
Diffusion rates were calculated to quantitatively characterize moving structures. Three different approaches were used to calculate diffusion rates. The first approach was based on the velocity of the moving structures observed. The distance representing the displacement of the same structure over a given time was measured from 2 different images obtained with a known time interval, and the velocity was calculated.
The second approach was based on measurement of the size of the structures observed. The size measurement of the structures was obtained from spinning-disk confocal micrographs and corrected using the point-spread function or the degree of spreading (blurring) of the point object. The point-spread function was measured with 210-nm beads as point objects using methods that have been developed and validated by others to correct the size measurements of fluorescent structures observed by light microscopy.13-16 Z stacks of bead images were merged into one, and the intensity profile was built using a Gaussian function to fit the intensity profile. To determine the apparent size of the bead, the full width at half-maximum (the circle within which the intensity was 50% of maximum intensity) was measured. ImageJ Version 1.36b software (National Institutes of Health) was used for analysis of the light micrographs.
The third approach was based on comparisons of diffusion coefficients obtained from experimental data with calculated diffusion coefficients of various sizes of protofibrils with different diameters and lengths. The average diameter of a cylindrical protofibril was calculated, assuming that the average density of a protein is 0.73 g/cm3 and knowing the molecular weight of fibrin to calculate the volume, with 2 halves of a fibrin molecule within each 2.25-nm repeat. Then, knowing the diameter of an individual protofibril and taking into account the information that lateral aggregation starts after the protofibril reaches a length between 600 and 800 nm, we calculated the diameters and lengths for 2, 3, 4, and 5 protofibrils aggregated laterally. The calculations for oligomers and protofibrils were straightforward because we knew the sizes and protein content of these structures accurately. The best model that we have of initial lateral aggregates is that the protofibrils twist around each other, so we have calculated an average diameter assuming that they are roughly cylindrical. The diameters were corrected for the measured relative amount of protein and water in fibrin fibers.17 We used these sizes to calculate the diffusion rates that could be used like a ruler to define the types of structures compared with diffusion rates based on experimental data.
Transmission electron microscopy studies
The polymerization reaction was carried out as described in “Polymerization reaction and gel point measurements,” stopped at the specific times 0, 1, 3, 6, and 9 minutes by the addition of 5 units/mL final concentration of hirudin (Sigma-Aldrich), and immediately diluted with a volatile buffer (0.05M ammonium formate with 30% glycerol). Very rapid dilution and spraying of the samples minimized the potential for dissociation of oligomers, but some changes may still occur.18 After spraying diluted samples onto freshly cleaved mica, the samples were rotary shadowed with tungsten in a vacuum evaporator (Denton Vacuum). Specimens were examined in an FEI/Philips 400 electron microscope. Images were taken at 80 kV with a magnification of 36 000×. More than 10 micrographs were analyzed at each time point.
Analysis of electron micrographs
The numbers of monomers, dimers, trimers, tetramers, protofibrils, and fibers were determined from counting structures observed in transmission electron microscope images of the rotary shadowed structures. A protofibril was defined as a double strand of 8 or more monomers. These measurements were carried out for at least 10 electron micrographs for each time point (1, 3, 6, and 9 minutes). Once the structures present were counted, all counts were normalized by the total number of monomers present in all of the structures.
Results
Turbidity measurements of fibrin polymerization
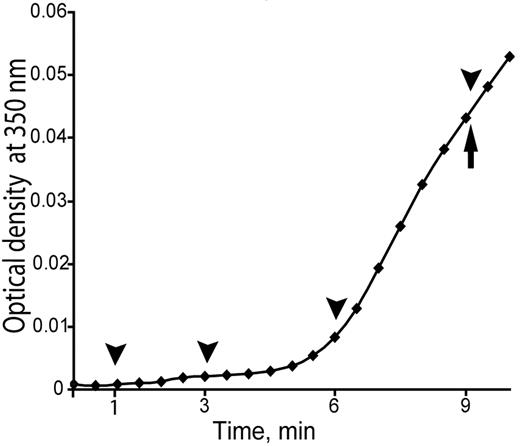
The dynamics of fibrin polymerization were characterized in general under the conditions of these microscopy experiments by measurement of turbidity curves averaged from 3 identical polymerization assays. For direct comparison with the microscopy results, turbidity was measured in the same chambers that were used for microscopy (Figure 1). The lag period, the time until the turbidity begins to rise, was determined from the turbidity curves to be 345 ± 10 seconds. The average gel point, the time of the change from liquid to solid, was determined to be 540 ± 11 seconds (n = 5; Figure 1).
Initial part of the turbidity curve from the beginning of polymerization to the gel point. Turbidity curves were averaged from 3 identical experiments. The lag phase was 0-345 ± 10 seconds, and the gel point at 540 ± 11 seconds. Arrowheads show the time when the polymerization reaction was stopped and samples were taken for transmission electron microscopy studies. The arrow shows the gel point.
Initial part of the turbidity curve from the beginning of polymerization to the gel point. Turbidity curves were averaged from 3 identical experiments. The lag phase was 0-345 ± 10 seconds, and the gel point at 540 ± 11 seconds. Arrowheads show the time when the polymerization reaction was stopped and samples were taken for transmission electron microscopy studies. The arrow shows the gel point.
Spinning-disk confocal microscopy of fibrin polymerization
Four-dimensional data were obtained from the time of mixing of fibrinogen and thrombin until the gel point and carefully analyzed. We observed fluorescently labeled fibrin structures that were mobile and moved in 3 dimensions (supplemental Videos 1-2, available on the Blood Web site; see the Supplemental Materials link at the top of the online article). At the beginning of polymerization, the smallest structures appeared as small, fluorescent dots moving among larger, soluble fibrin precursors. At the middle of the lag period at approximately 3 minutes, these structures elongated and appeared as rod-like structures or fibers with length and diameter. They continued to move independently of each other and started branching. At the end of the lag period at approximately 5 minutes, they continued moving but the velocity of these structures slowed down, because of intensive branching and longitudinal and lateral growth. At 6 minutes, when the turbidity curve started to rise, branching and lateral and longitudinal growth resulted in the formation of a fiber scaffold, which continued to move slowly. At the time the scaffold was formed, there were some small structures that continued moving with velocities higher than that of the scaffold. They later grew laterally and longitudinally and eventually attached to the scaffold.
Electron microscopy study of fibrin polymerization
To answer the question of what were the smallest fibrin-related structures present at the beginning of polymerization and how they changed before the gel point, we synchronized our confocal microscopy experiments with electron microscopy experiments. Four time points were chosen, 1, 3, 6, and 9 minutes, at which time the reaction was stopped (see “Transmission electron microscopy studies”). The 1-minute time point corresponded to the time just after fibrinogen and thrombin were mixed (0 time), 3 minutes corresponded to the middle of the lag phase, 6 minutes corresponded to the end of the lag period when the polymerization curve started to rise, and 9 minutes corresponded to the gel point (Figure 1).
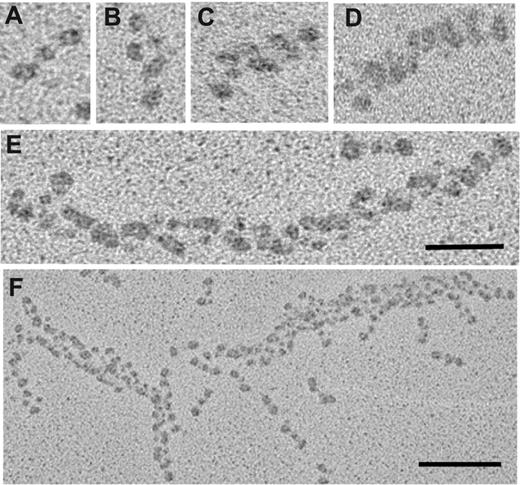
Structures that appeared at each time point were identified from their morphology as monomers, dimers, trimers, tetramers, protofibrils (defined as structures that consisted of more them 8 monomers), and fibers. Structures consisting of 5, 6, and 7 monomers were not observed under our experimental conditions (Figure 2).
Transmission electron micrographs showing representative fibrin structures. Structures can be identified as: (A) monomers, (B) dimers, (C) trimers, (D) tetramers, (E) protofibrils, and (F) fibers. Scale bars, 50 nm (A-E) and 100 nm (F).
Transmission electron micrographs showing representative fibrin structures. Structures can be identified as: (A) monomers, (B) dimers, (C) trimers, (D) tetramers, (E) protofibrils, and (F) fibers. Scale bars, 50 nm (A-E) and 100 nm (F).
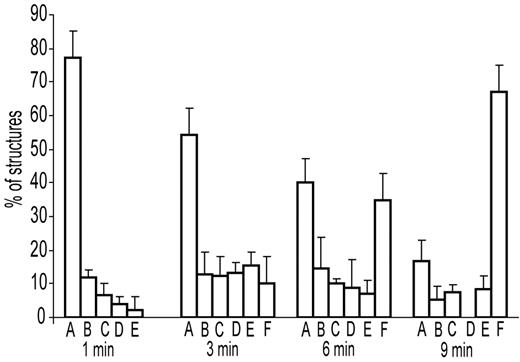
To understand the dynamic changes of fibrin structures as a function of time during the early stages of fibrin polymerization, the numbers of each type of observed structure were quantified for each time point. The number of monomers within each type of structure were calculated and normalized by the number of total monomers present in each whole micrograph, determined as the sum of all free monomers plus monomers present in all other fibrin structures (Figure 3). The results of such analyses showed that at 1 minute from the beginning of polymerization, the major structures were monomers, whereas small protofibrils consisting of more than 8 fibrin monomers represented 2% of all defined structures (Figure 3). Fibers were not present at this time point. In the middle of the lag period at 3 minutes, all types of structures were found: monomers, dimers, trimers, tetramers, protofibrils, and fibers. At this time, monomers still remained a major fraction at 54%. At 6 minutes, when the turbidity started rising, the numbers of free monomers and monomers polymerized in dimers, trimers, tetramers, protofibrils, and fibers were almost equal. Around the time of the gel point at 9 minutes, the major structures appeared to be fibers, but some of the smaller structures—monomers, dimers, and trimers—were also present (tetramers were not found at this time point).
Histograms showing the percentage of fibrin structures visualized by electron microscopy at 1, 3, 6, and 9 minutes during fibrin polymerization. All types of structures that appear in the images were counted in each micrograph. The number of monomers within each type of structure was calculated and normalized by the number of monomers present in the whole micrograph. Structures can be identified as: (A) fibrin monomers, (B) dimers, (C) trimers, (D) tetramers, (E) larger oligomers and protofibrils, and (F) fibers.
Histograms showing the percentage of fibrin structures visualized by electron microscopy at 1, 3, 6, and 9 minutes during fibrin polymerization. All types of structures that appear in the images were counted in each micrograph. The number of monomers within each type of structure was calculated and normalized by the number of monomers present in the whole micrograph. Structures can be identified as: (A) fibrin monomers, (B) dimers, (C) trimers, (D) tetramers, (E) larger oligomers and protofibrils, and (F) fibers.
Quantitative analysis and identification of moving structures
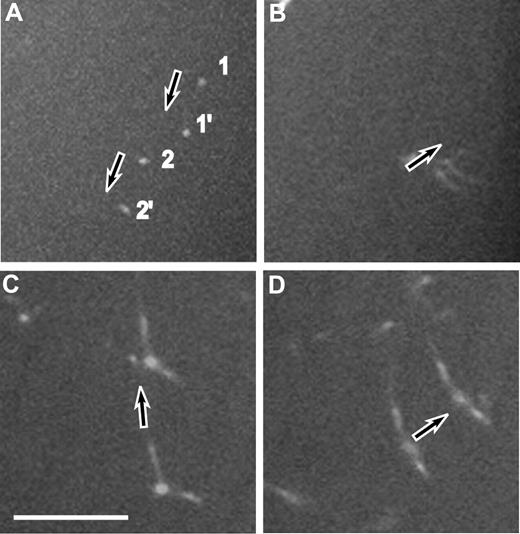
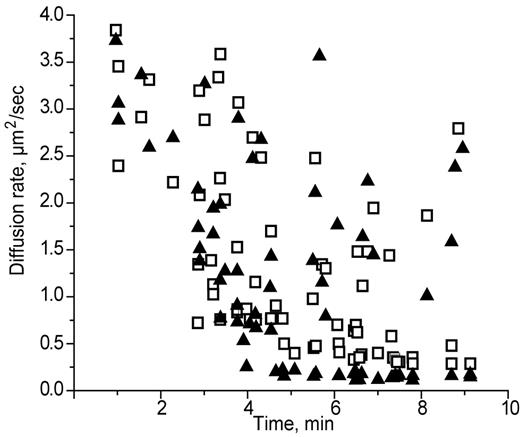
Diffusion coefficients were calculated to characterize the movement and sizes of fibrin structures during the early stages of fibrin polymerization. Two different approaches were used to calculate the diffusion rate, one based on size and the other based on the velocity of the moving structures. The sizes of the moving structures observed in the spinning-disk confocal microscope, including the lengths of the rod-like structures and the diameters of the round structures, were measured. The measurements from the confocal microscope were corrected using the point-spread function of our instrument to compensate somewhat for the imaging limitations of light microscopy (see “Quantitative analysis and identification of moving structures”).13,19 We measured the velocity of moving structures during the lag period by identifying the same structures at 2 close time points (Figure 4). We observed a decrease in the diffusion rates for a majority of structures from both calculations, those based on velocity and those based on size, over time until the gel point, probably because of the increased sizes with time due to the processes of elongation and lateral aggregation (Figure 5). However, at the gel point (at ∼ 9 minutes), we found some small structures that were still moving with relatively high diffusion rates of up to 2.75 μm2/s.
Z projections of 2 spinning-disk confocal micrographs at different times. This technique was used to measure the displacement of each individual fibrin structure during a known time interval to calculate the velocity. (A) Displacement of a fibrin structure during 0.6 seconds. (B) Displacement of another moving structure during 0.6 seconds. (C) Projection of 2 Z sections, one 6 minutes and 5 seconds and another one 6 minutes and 21 seconds from the beginning of polymerization. (D) Projection of 2 Z sections, one at 6 minutes and 54 seconds and another one at 7 minutes and 5 seconds. Arrows show the direction of movement. 1 and 1′ correspond to one moving structure; 2 and 2′ correspond to another moving structure. Scale bar represents 10 μm.
Z projections of 2 spinning-disk confocal micrographs at different times. This technique was used to measure the displacement of each individual fibrin structure during a known time interval to calculate the velocity. (A) Displacement of a fibrin structure during 0.6 seconds. (B) Displacement of another moving structure during 0.6 seconds. (C) Projection of 2 Z sections, one 6 minutes and 5 seconds and another one 6 minutes and 21 seconds from the beginning of polymerization. (D) Projection of 2 Z sections, one at 6 minutes and 54 seconds and another one at 7 minutes and 5 seconds. Arrows show the direction of movement. 1 and 1′ correspond to one moving structure; 2 and 2′ correspond to another moving structure. Scale bar represents 10 μm.
Diffusion rates of fibrin structures calculated by 2 different methods as a function of time. Calculations were based on the sizes (▴) or on the velocities (□) of moving structures.
Diffusion rates of fibrin structures calculated by 2 different methods as a function of time. Calculations were based on the sizes (▴) or on the velocities (□) of moving structures.
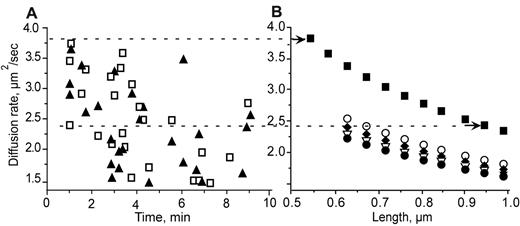
We found that both diffusion coefficient calculations had the same range, 3.8-0.1 μm2/s, and were highly correlated (r2 0.87; P = .001). To determine the sizes of fibrin structures with such diffusion coefficients, we compared diffusion coefficients obtained from experimental data with those calculated for various sizes of protofibrils and fibers (ie, aggregated protofibrils) with different diameters and lengths (for details, see “Quantitative analysis and identification of moving structures”). At 1 minute from the beginning of polymerization, the diffusion coefficients were in the range of 2.4-3.8 μm2/s. We found from the known fibrin structures that this range corresponded to only a few possible types of structures: protofibrils in the length range from 0.54-0.95 μm, fibers consisting of 2 laterally aggregated protofibrils up to a length 0.67 μm, and 3 laterally aggregated protofibrils up to a length of 0.62 μm (Figure 6). Thus, the smallest structures we were able to see in the spinning-disk confocal microscope from 1 minute after the beginning of polymerization until the gel point were protofibrils with a length of approximately 0.5 μm.
Identification of fibrin structures by comparison of diffusion coefficients obtained from experimental data with those calculated for model structures with different lengths and thicknesses. (A) Diffusion coefficients obtained from experimental data. Calculations were based on size (▴) or on the velocities (□) of moving structures. (B) Diffusion coefficients are shown for one protofibril (■), 2 protofibrils (○), 3 protofibrils (♦), 4 protofibrils (▿), and 5 protofibrils (●). The dashed lines connecting panels A and B show the correlations between the measured (A) and calculated (B) diffusion coefficients, so it is possible to deduce what the structures observed could be (arrows at the right end of the dashed lines). For example, the top dashed line, for one of the largest diffusion coefficients measured, 3.8 μm2/s, corresponds to a protofibril with a length of 0.54 μm. The lower dashed line is another example showing the possible fibrin structures that correspond to a diffusion rate of 2.4 μm2/s, a single protofibril with a length of 0.95 μm, 2 laterally aggregated protofibrils with a length of 0.62 μm, or 3 laterally aggregated protofibrils with a length of 0.67 μm.
Identification of fibrin structures by comparison of diffusion coefficients obtained from experimental data with those calculated for model structures with different lengths and thicknesses. (A) Diffusion coefficients obtained from experimental data. Calculations were based on size (▴) or on the velocities (□) of moving structures. (B) Diffusion coefficients are shown for one protofibril (■), 2 protofibrils (○), 3 protofibrils (♦), 4 protofibrils (▿), and 5 protofibrils (●). The dashed lines connecting panels A and B show the correlations between the measured (A) and calculated (B) diffusion coefficients, so it is possible to deduce what the structures observed could be (arrows at the right end of the dashed lines). For example, the top dashed line, for one of the largest diffusion coefficients measured, 3.8 μm2/s, corresponds to a protofibril with a length of 0.54 μm. The lower dashed line is another example showing the possible fibrin structures that correspond to a diffusion rate of 2.4 μm2/s, a single protofibril with a length of 0.95 μm, 2 laterally aggregated protofibrils with a length of 0.62 μm, or 3 laterally aggregated protofibrils with a length of 0.67 μm.
Discussion
Early events in fibrin polymerization have been quantitatively studied previously using different techniques, including turbidity,20 light scattering,21,22 microscopy,23 and kinetic analyses.12,18 These different methods have provided data from different standpoints, but all of these studies were based on indirect observations rather than direct visualization and yielded average values. There was some direct observation of moving fibrin structures at the early stages of fibrin network formation,24 but these images were not analyzed quantitatively because adequate technology was not available. We used a different approach to solve this problem: electron microscopy, spinning-disk confocal microscopy, and turbidity measurements were synchronized. This is a powerful combination, because the strengths and weaknesses of these 3 techniques are complementary. Although spinning-disk confocal microscopy allows the rapid, real-time imaging of hydrated structures, its resolution is limited, whereas electron microscopy requires dehydrated, stained specimens but allows high-resolution visualization of small structures. Turbidity is a very commonly used technique that measures global properties of clots, and can be used to characterize the kinetics in addition to the overall clot structure.
Our results provide quantitative analyses of fibrin structures and the dynamics of changes in these structures before the gel point. We show that at the beginning of fibrin polymerization, the population of fibrin structures is not homogeneous and consists of monomers and small double-stranded structures, dimers, trimers, tetramers, and protofibrils made up of 8 or more monomers. These results are in agreement with light-scattering data21,22 showing that during the lag period, the population of fibrin structures is not homogenous; however, those investigators were not able to characterize these structures in detail. Our data provide new information about the types of fibrin structures and the dynamic changes in their proportions during the lag period and approaching the gel point. Structures made of 5, 6, and 7 monomers were not observed in our studies, perhaps because these structures are not stable or the majority of small oligomers elongate rapidly.
At the middle of the lag period, the fraction of protofibrils was elevated compared with the fraction of dimers, trimers, and fibers. This observation suggests that during this time the rate of longitudinal growth of oligomers or protofibrils is higher than the rate of lateral aggregation of these structures.18 At the time that turbidity began to rise, the percentage of fibers increased and the percentage of protofibrils decreased compared with the middle of the lag period, suggesting that the major process occurring at this time had changed to lateral aggregation. Because the percentage of small structures such as dimers, trimers, and tetramers did not differ much at the beginning and middle of the lag period, it could be that the rate of oligomer formation and the rate of lateral aggregation were similar. The decrease of small structures at the end of the lag period could have arisen from their incorporation into bigger protofibrils or fibers. The lack of tetramers at the gel point could mean that the rate of association into larger structures is faster than for monomers, dimers, and trimers. Small structures found at the gel point indicate that oligomer and network formation continues after the gel point, which is in agreement with our recently published results.11
The diffusion coefficients we measured for moving structures that appeared from the beginning of polymerization to the gel point decreased during this time because of increases in the size of these structures as a result of the processes of longitudinal and lateral growth and branching. Although the diffusion coefficients for most structures decreased at the time when the turbidity curve started to rise, there were still some structures with high diffusion coefficients. These findings support the results discussed in the second paragraph of “Discussion” showing that the population of fibrin structures is not homogeneous and that smaller structures are still present.
The sizes of the smallest structures observed in the spinning-disk confocal microscope at 1 minute after the beginning of polymerization were determined from analysis of diffusion coefficients and were found to be protofibrils approximately 0.5 μm in length. This conclusion is consistent with the electron microscope images in that there were protofibrils and smaller structures but no fibers at 1 minute after initiation of polymerization (Figure 3). Size measurement data of electron microscope images at the later time of polymerization at 3 minutes support this conclusion, because at this time the most frequent size was 0.4 μm, which corresponds to protofibrils built from 19 fibrin monomers. In other words, fibers are not the primary structures even at the middle of the lag period of fibrin polymerization.
In conclusion, we analyzed the dynamic sequence of the early events of fibrin-clot formation from the beginning of polymerization to the gel point using the complementary techniques of electron microscopy, spinning-disk confocal microscopy, and turbidity measurements. Structures formed during the early stages of fibrin polymerization were visualized and dynamic changes in the proportion of these structures were characterized. The mobility and sizes of fibrin structures were characterized, and the smallest moving fibrin structures visible in a light microscope were identified. Understanding of the events responsible for gelation and their relation to the clotting process help us to interpret the clinical significance of changes in the gel point, which are widely used for assessment of coagulation in the clinical setting. Knowledge of these aspects of the polymerization process may lead to new methods of prophylaxis, diagnosis, and treatment of thrombosis by modulation of the specific steps that have been observed and analyzed here.
An Inside Blood analysis of this article appears at the front of this issue.
The online version of this article contains a data supplement.
The publication costs of this article were defrayed in part by page charge payment. Therefore, and solely to indicate this fact, this article is hereby marked “advertisement” in accordance with 18 USC section 1734.
Acknowledgments
We thank Dr Rustem Litvinov for valuable discussions while we were preparing this paper.
This work was supported by National Institutes of Health grants HL030954 and HL090774.
National Institutes of Health
Authorship
Contribution: I.N.C. designed the research, performed experiments, analyzed and discussed results, prepared the figures, and wrote the paper; C.N. performed electron microscopy; and J.W.W. designed the research, discussed results, and wrote the paper.
Conflict-of-interest disclosure: The authors declare no competing financial interests.
Correspondence: John W. Weisel, Department of Cell and Developmental Biology, University of Pennsylvania School of Medicine, 421 Curie Blvd, 1054 BRB II/III, Philadelphia, PA 19104-6058; e-mail: weisel@mail.med.upenn.edu.

This feature is available to Subscribers Only
Sign In or Create an Account Close Modal