Abstract
Micro-RNAs (miRNAs) have been recognized as critical regulators of gene expression, and deregulation of miRNA expression has been implicated in a wide spectrum of diseases. To provide a framework for the role of miRNAs in B-cell development and malignancy, we deep-sequenced miRNAs from B1 cells and 10 developmental stages that can be identified within the mouse B2 B-cell lineage. The expression profiles of the 232 known miRNAs that are expressed during B-cell development display stage-specific induction patterns, yet hierarchical clustering analysis showed relationships that are in full agreement with the model of the B2 B-cell developmental pathway. Analysis of exemplary miRNA expression profiles (miR-150, miR-146a, miR-155, miR-181) confirmed that our data are in agreement with previous results. The high resolution of the expression data allowed for the identification of the sequential expression of oncomir-1/miR-17-92 and its paralogs miR-106a-363 and miR-106b-25 in subsequent developmental stages in the BM. Further, we have identified and validated 45 novel miRNAs and 6 novel miRNA candidates expressed in developing B cells.
Introduction
Our understanding of the role of micro-RNAs (miRNAs) in processes such as development and differentiation has increased dramatically over the past few years. The most current version of the miRNA reference database miRBase V16.0 describes 672 Mus musculus and 1048 Homo sapiens miRNAs, but predictions of the total number of miRNAs for these species range up to the thousands,1,2 suggesting that there are more miRNAs to be discovered. Indeed, with the advent of next-generation sequencing technology studies have emerged describing tens to hundreds of new miRNA candidates.3-7 Overall, these studies suggest that the known miRNAs described to date predominantly represent the most abundant, globally expressed and evolutionary conserved miRNAs. Those miRNAs still to be discovered most probably are those expressed at lower levels, more cell type specific, or species specific. Validation of new miRNAs involves identification of rodent/human equivalents (unless they are species specific), structural predications, and the presence of the miRNA* sequence (which is the lesser abundant single-stranded small RNA sequence generated by Dicer processing of the pre-miRNA hairpin).5
Studies have shown that miRNAs play important roles in the immune system and in its development.8 Recently, deep sequencing of small RNAs isolated from 27 immune tissues,6 provided a partial survey of the miRNAs expressed in various cell types and stages of immune development. Lineage-specific knockout of proteins involved in miRNA generation, such as Dicer, halt immune cell development.9-11 Further studies in which specific miRNAs have been eliminated further support this view.12-18
B cells represent perhaps the best-characterized developmental lineage in the immune system,19,20 and the role of miRNAs in their development has been established. Deletion of Dicer early in B-cell development leads to a block at the pro to pre–B-cell transition.10 miR-15a and miR-16-1 regulate several mRNAs involved in apoptosis or cell cycle progression (eg, Mcl1, Bcl2, Ets1, and Jun).21 In human chronic lymphocytic leukemia chromosomal region 13q14 containing miR-15a and miR-16-1 is often deleted,21 and deletion of this region in mice in vivo causes a B-cell autonomous lymphoproliferative disorder.22 Overexpression of miR-155 from the VH promoter-Ig heavy chain Eμ enhancer leads to pre–B-cell proliferation and lymphoma in mice,23 and it has been reported that this miRNA is important for regulation of the germinal center response.14 The oncomir-1/miR-17-92 cluster controls Bim expression15,18 and miR-150 represses c-Myb during B-cell development,17 both proteins playing pivotal roles in early B-cell development. Finally, miR-34a inhibits the transition of pro-B cells into pre-B cells by inhibiting Foxp1, a known B-cell oncogene.24 Thus, miRNAs are strongly implicated in the B-cell lineage.
To understand the contribution of the expression of individual miRNAs (or miRNA sets) to normal B-cell development and function, we undertook a detailed survey of miRNA expression in the B2 B-cell developmental subsets. Deep sequencing of small RNA libraries generated from these stages (and from B1 B cells) identified 232 known miRNAs, and we found that most B-cell developmental steps are characterized by the induction of groups of miRNAs that are specific to each stage. Further analysis identified 45 new miRNAs expressed during B-cell development of which 12 yielded miRNA* sequences as well.
Methods
Mice
C57Bl/6J mice were purchased from The Jackson Laboratory and kept and killed as described in protocols approved by the St Jude Children's Research Hospital Committee on Use and Care of Animals.
B-cell sorting
B220+ B cells were MACS-purified from pooled BM or spleen cells obtained from ten 8-week-old C57Bl/6J mice (The Jackson Laboratory). B220-coated microbeads for MACS were obtained from Miltenyi Biotec. Ten distinct B2 B-cell developmental stages and B1 B cells can be identified in mouse BM and spleen with the use of the Hardy classification of B-cell development (Figure 1).19,20 To delineate all of these fractions the B220+ pools were incubated with antibody combinations (supplemental Figure 1, available on the Blood Web site; see the Supplemental Materials link at the top of the online article) that discriminate Hardy fractions A through F in the BM and T1, T2/T3, Fo, Mz, and B1 B cells in the splenic B220+ pool (see supplemental Methods).19
RNA isolation, deep sequencing, and real-time quantitative PCR
Total RNA was isolated with the mirVana miRNA isolation kit (Applied Biosystems; see supplemental Methods). Integrity of each total RNA preparation was confirmed by RNA 6000 Pico Chip assay with the use of the Agilent Technologies 2100 Bioanalyzer. Small RNA fractions (19-24 nucleotides) were isolated from the total RNA samples, and libraries were prepared and sequenced on the Illumina 1G Sequencer as described previously.25 Real-time quantitative PCR (qPCR) was performed with TaqMan single miRNA assays and TaqMan low-density arrays (LDAs; Applied Biosystems) or NCode SYBR Green miRNA real-time qPCR (Invitrogen).
Bioinformatics and biostatistics
The sequence tags obtained were filtered for contaminating synthetic oligos and sequentially blasted against 4 small noncoding RNA (ncRNA) databases (miRBase,26 NONCODE,27 GtRNAdb,28 and RNAdb29 ) to obtain the ncRNA composition of the libraries. The expression profiles of the known miRNAs were obtained by matching all sequences by BLAST analysis against miRBase V14 mature miRNA and miRNA* databases. The principle component analysis (PCA) and hierarchical clustering were performed with Partek Genomics Suite V6.5. All statistical tests were performed with the STATA Data Analysis and Statistical Software package (Stata Corporation). To identify new miRNA candidates the deep-sequencing output was uploaded to the miRanalyzer Web server.30 An initial list of 405 new miRNA candidates was narrowed down to 66 by manual inspection. Our inspection criteria required the presence of sequence tags (custom annotation) on the hairpin coordinates (as obtained from miRanalyzer), the generation of a hairpin structure on transfer of the hairpin sequence (RNA-fold algorithm), and verification of the location of the mature miRNA sequence (and where applicable the miRNA* sequence) with respect to the hairpin structure. The remaining shortlist of 66 candidates was subsequently validated. A more elaborate description of the process can be found in supplemental Methods.
Results
Sequencing, annotation, and validation of small ncRNA species in B-cell development
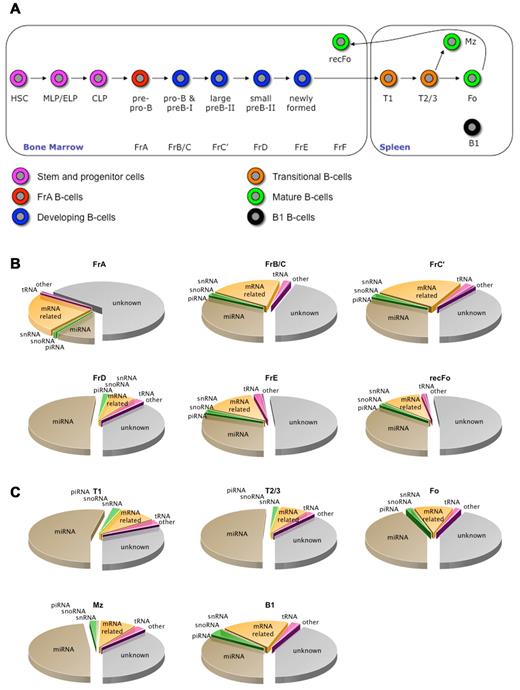
The Hardy classification distinguishes 10 distinct B2 B-cell developmental stages and B1 B cells in mouse BM and spleen (Figure 1).19,20 Six BM B-cell stages (FrA, FrB/C, FrC′, FrD, FrE, and FrF; the latter cells are also known as recirculating follicular B cells and will be called recFo herein) and 5 spleen B-cell populations (T1, T2/3, Fo, Mz, and B1) were isolated (supplemental Methods; supplemental Figure 1), and libraries of 19-24 nucleotide RNAs for each fraction were subjected to deep sequencing, yielding 0.6-3.7 million reads per stage (supplemental Table 1). Next, the sequence reads were classified as described in (“Bioinformatics and biostatistics”; supplemental Methods). Supplemental Table 1 shows that the differences in total RNA yield or in miRNA sequence counts do not always correlate with the numbers of processed cells. This may be caused by differences in total RNA or miRNAs per cell or by differences in miRNA-to-total RNA ratios in different stages of B-cell development, similar to what has been found during T-cell development.31 The material used for the generation of the sequence libraries was obtained during a single sort; therefore, it is difficult to conclude whether these differences are because of experimental variability or caused by intrinsic differences between the various developmental stages. In general, the composition of the libraries resembles those described for other small RNA libraries.4,32,33 In most of the developmental stages the miRNAs were found to be the most abundant ncRNA subset (Figure 1; supplemental Table 1). The set designated “mRNA related” contains sequences that associate with mRNAs and may represent mRNA degradation products. Alternatively, they may be previously unknown miRNAs or other small ncRNA species. Sequences corresponding to tRNA loci might represent tRNA-derived smRNAs, a ncRNA species that has recently been identified.34 In each library a considerable number of sequences could not be annotated and might represent new miRNAs or other ncRNAs that have not been previously identified. Blast analysis of the sequenced libraries against miRBase26 provided sequence counts for all known miRNAs, and the frequency and normalized counts of each miRNA were calculated for each stage (supplemental Methods; supplemental Table 2).
The B2 B-cell lineage and the ncRNA classes present in the depicted developmental stages. (A) A simplified scheme of B2 B-cell development (see supplemental Materials and Methods). Four different ncRNA databases were sequentially queried with our sequencing libraries. Fractions isolated from the BM are shown (B), and (C) depicts the spleen-derived fractions. Pie charts represent the distribution of 8 different classes of small RNAs: unknown indicates not annotated; miRNA, micro-RNA; piRNA, Piwi-interacting RNA; snoRNA, small nucleolar RNA; snRNA, small nuclear RNA; mRNA related, messenger RNA related; tRNA, transfer RNA; and other, other ncRNAs. In general, the distributions are similar to those described in other studies. MLP indicates multipotent lymphoid progenitor; ELP, early lymphoid progenitor; and CLP, common lymphoid progenitor.
The B2 B-cell lineage and the ncRNA classes present in the depicted developmental stages. (A) A simplified scheme of B2 B-cell development (see supplemental Materials and Methods). Four different ncRNA databases were sequentially queried with our sequencing libraries. Fractions isolated from the BM are shown (B), and (C) depicts the spleen-derived fractions. Pie charts represent the distribution of 8 different classes of small RNAs: unknown indicates not annotated; miRNA, micro-RNA; piRNA, Piwi-interacting RNA; snoRNA, small nucleolar RNA; snRNA, small nuclear RNA; mRNA related, messenger RNA related; tRNA, transfer RNA; and other, other ncRNAs. In general, the distributions are similar to those described in other studies. MLP indicates multipotent lymphoid progenitor; ELP, early lymphoid progenitor; and CLP, common lymphoid progenitor.
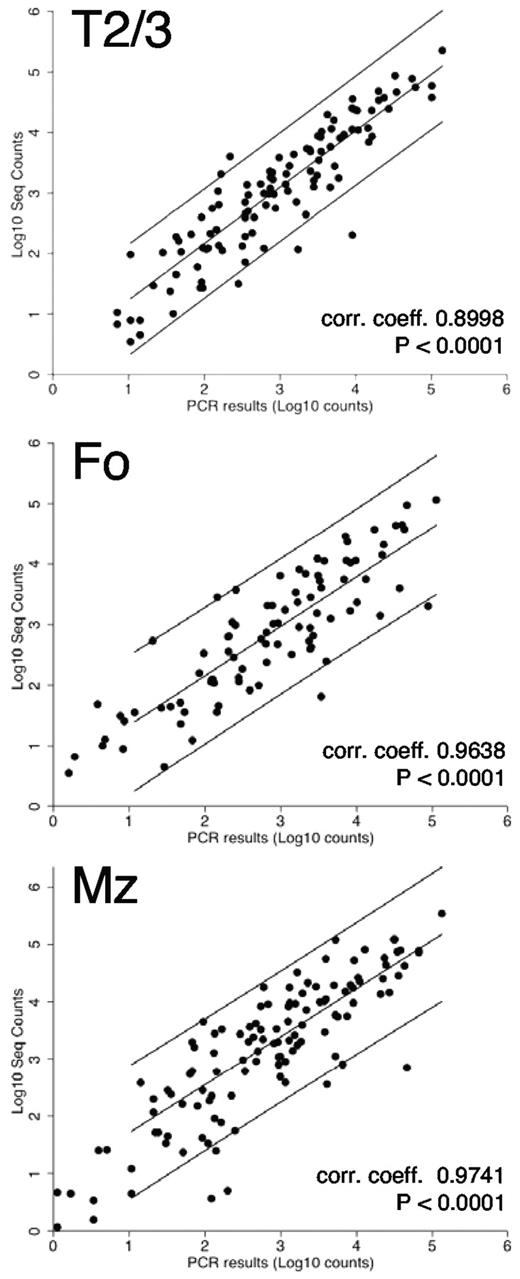
To validate the sequencing output and the normalization strategy we used miRNA real-time qPCR LDAs with biologic replicate samples (the same populations obtained from a different sort on a different day) from T1, T2/3, Fo, and MZ fractions. Expression of ∼ 200 known miRNAs was confirmed in these splenic B-cell populations. We found excellent correlation between the LDA results and the normalized sequence counts (Figure 2; Pearson correlation coefficients, 0.8998-0.9741; all P values < .0001). We further validated the expression profiles of a subset of miRNAs by single miRNA real-time qPCR assays (supplemental Figure 2A-C). In general we found that the patterns of the expression profiles of individual miRNAs were similar between assays. However, the height of individual expression levels varied between assays (eg, at times the heights of the expression profiles of 2 miRNAs were inverted), comparing the sequence data with the real-time qPCR results. This could be caused by differences in primer binding efficiency for different miRNAs or by miRNA editing events,35 resulting in imperfect hybridization of the real-time qPCR primers that are designed to amplify the published generic miRNA sequence.36 In addition, small differences could exist between the different biologic replicate samples that were used for the assays. Nevertheless, in most cases the profiles of individual miRNAs among the B-cell fractions were consistent with those obtained in the sequencing counts. We also compared our results with data presented in a survey of several immune cell types, describing the immune system's miRNome,6 a study in which a partial analysis of B-cell developmental subsets was performed. Although several populations analyzed were not comparable (on the basis of staining protocols), 2 populations designated “mature” and Mz were similar (but not identical) to our Fo and Mz populations, respectively. We therefore compared the expression of 169 miRNAs that were found to be present unambiguously in both datasets. On comparison of the counts (supplemental Figure 2D) correlation coefficients of 0.6096 (P < .0001, mature/Fo) and 0.5807 (P < .0001, Mz/Mz) were obtained. Moreover, a nonparametric Spearman rank correlation test on the same data resulted in scores of 0.7060 and 0.7152 for Fo and Mz comparisons, respectively (P < .0001 for both), confirming the similarities between the 2 datasets for these B-cell subsets. Therefore, the miRNA frequencies and profiles obtained by our deep-sequencing analysis are probably valid for all fractions.
Validation of sequencing results by TaqMan LDAs. Excellent correlations were found between the normalized sequence counts and the TaqMan real-time qPCR LDA results for ∼ 200 known miRNAs.
Validation of sequencing results by TaqMan LDAs. Excellent correlations were found between the normalized sequence counts and the TaqMan real-time qPCR LDA results for ∼ 200 known miRNAs.
Relationships between miRNA profiles in B-cell developmental fractions
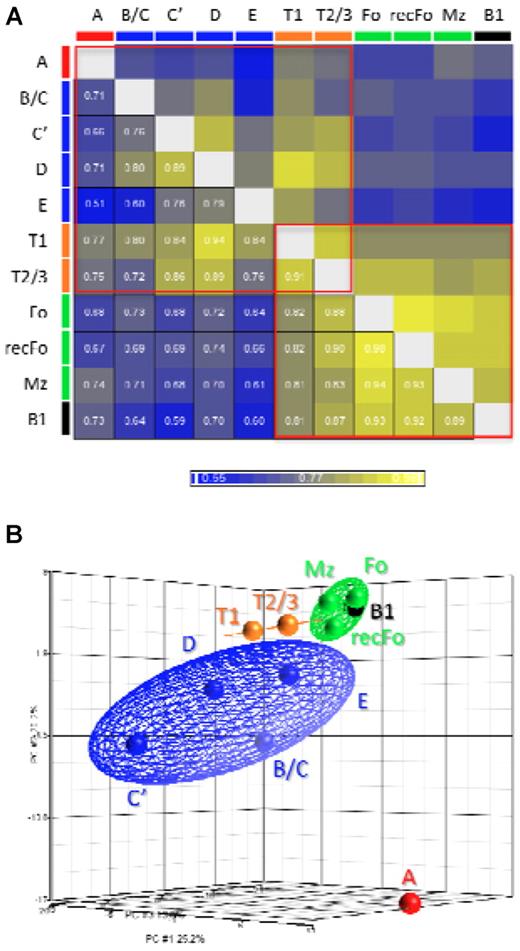
We performed a Pearson correlation test (Figure 3A) to analyze the overall correlations between the miRNA expression profiles obtained for each stage of B-cell development. The results show that (1) the miRNA expression profile of FrA cells is the most distinct profile among all other fractions, (2) there are larger differences between the stages in the BM compartment than between the splenic stages, and (3) transitional B-cell profiles show resemblance to both BM and splenic B-cell stages. Within the group of mature B-cell stages the highest correlation was found between Fo and recFo cells (confirming their relationship19,20 ) despite that we sorted these 2 populations from different compartments. Remarkably, the profile of B1-lineage B cells is similar to that of the mature B cells of the B2 lineage. To better appreciate the variance between the stages we performed a PCA (Figure 3B). The results of this analysis are in agreement with the results of the Pearson correlation test.
Comparisons between the miRNA profiles of each fraction. (A) Pearson correlation coefficients for the comparisons between all fractions. (B) A 3-dimensional representation of the PCA. The cell fractions were grouped and depicted as follows: FrA cells (red), early B cells (FrB/C, C′, D, and E; blue), transitional B cells (T1 and T2/3; orange), mature B cells (Fo, recFo, and Mz; green), and B1 lineage B cells (black). The colored ellipsoids represent the 95% confidence boundaries for each of the groups described. The results described in this figure are in agreement with the model for development of the B2 B-cell lineage.
Comparisons between the miRNA profiles of each fraction. (A) Pearson correlation coefficients for the comparisons between all fractions. (B) A 3-dimensional representation of the PCA. The cell fractions were grouped and depicted as follows: FrA cells (red), early B cells (FrB/C, C′, D, and E; blue), transitional B cells (T1 and T2/3; orange), mature B cells (Fo, recFo, and Mz; green), and B1 lineage B cells (black). The colored ellipsoids represent the 95% confidence boundaries for each of the groups described. The results described in this figure are in agreement with the model for development of the B2 B-cell lineage.
Hierarchical clustering of miRNAs in B-cell fractions
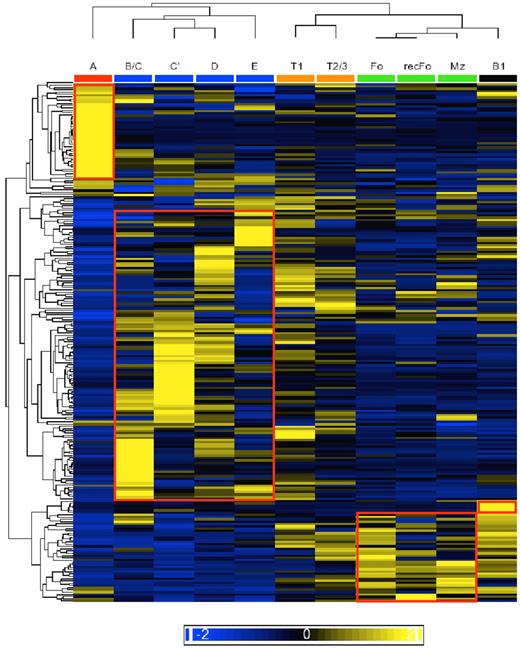
To obtain insight into the expression pattern of individual miRNAs we performed a hierarchical clustering analysis (Figure 4). We noted that FrA cells and the developing B cells (FrB/C through E) have characteristic miRNA expression profiles that can be used to distinguish each population and therefore could be used as a “diagnostic” profile. FrA cells appear to express a group of miRNAs that are underrepresented in all of the developmental stages thereafter (miR-2138, -532-3p, -500, -1959, -221, -1965, -1900, -1893, -501-5p, and let-7f*). The miR-30 family (miR-30a, b, and c), which was shown to negatively regulate p53 expression,37 is also well represented in this stage. Included in the group of miRNAs that are induced in FrB/C are miR-34a (known to be transactivated by p5338-40 ) and miR-17, -19a, -19b, and -20a that are encoded by the oncomir-1/miR-17-92 cluster.15,41,42 In FrC′ other members of the oncomir-1/miR-17-92 cluster (miR-18a and -92a), miR-18b, -20b, and -363, which are encoded by the miR-106a-363 cluster, and miR-15/16 are well represented. In FrD miR-106a of the miR-106a-363 cluster and the miR-106b-25 cluster (the second oncomir-1/miR-17-92 paralog) are expressed (specifically miR-25 and -93). miR-181a is the most widely studied miRNA43 well represented in FrE. The only population obtained from BM that does not cluster with the other BM populations is the recFo cells, which display a similar miRNA profile to the Fo cells in the spleen.
Hierarchical clustering of miRNA expression frequencies. Unsupervised clustering of the miRNA profiles arranged the cell fractions according to the model of B-cell development (dendrogram on top). The red boxes accentuate clusters of miRNAs that seem to be specific to the indicated stage(s). The colored scale bar represents standard deviations from the mean.
Hierarchical clustering of miRNA expression frequencies. Unsupervised clustering of the miRNA profiles arranged the cell fractions according to the model of B-cell development (dendrogram on top). The red boxes accentuate clusters of miRNAs that seem to be specific to the indicated stage(s). The colored scale bar represents standard deviations from the mean.
In contrast to the BM subsets, the miRNA profiles in the splenic fractions do not widely diverge from one another. The transitional T1 and T2/3 stages display expression profile similarities with both the developing B-cell stages in the BM and the mature B-cell populations. miR-350 and -301b are specifically induced in T1 cells. The T2/3 profile shows more similarity to the mature B cells than to the developing B cells. Another feature is the presence of a group of miRNAs that is not expressed in the BM, appears in transitional cells, and continues to be expressed in mature B cells. Within this group miR-155 appears to be the most highly expressed in Mz cells and miR-150, which is induced in T2/3 cells, peaks in Fo, recFo, and B1 B cells but is down-regulated in Mz cells. Finally, a group of miRNAs was identified that is specific to the B1 lineage, namely miR-2137, -2142, -143, -125b-5p, and -146a.
Expression of known miRNAs in B-cell fractions
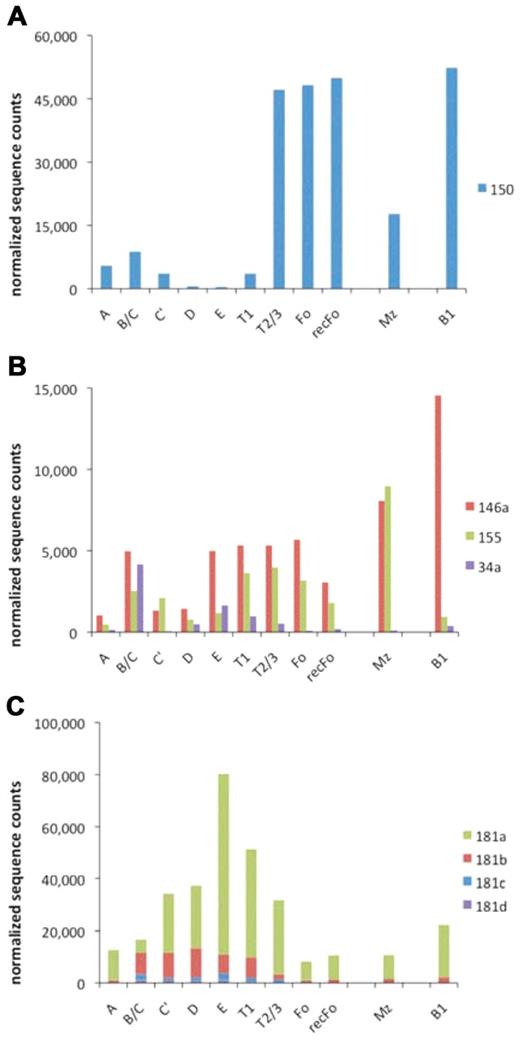
We found 232 previously described mouse miRNAs to be expressed at counts of ≥ 10 on average throughout all the 11 B-cell stages that we interrogated (supplemental Table 2). Throughout the dataset fluid changes in sequence counts were observed for individual miRNAs when progressing through the B-cell developmental pathway (Figures 5 and 6; supplemental Table 2). We examined miRNAs that are known to be involved in lymphocyte development or activation and found that miR-150 is regulated most strongly within the dataset (specifically > 13-fold induction from T1 to T2/3). In contrast, miR-146a appears to be regulated at various developmental steps during B-cell development. miR-155 appears to be induced during the transitions from FrA to B/C, from E to T1, and from T2/3 to Mz (but not from T2/3 to Fo), whereas miR-34a is induced strongly in FrB/C. Finally, the miR-181 family is induced in the early B cells and in the transitional B-cell stages.
Expression of immunologic relevant miRNAs. The normalized counts for miR150 (A), miR-146a, miR-155, and miR-34a (B) in all B-cell developmental stages are shown. (C) The summed counts for the miR-181 family members are depicted. The results are in agreement with limited published data that are available.
Expression of immunologic relevant miRNAs. The normalized counts for miR150 (A), miR-146a, miR-155, and miR-34a (B) in all B-cell developmental stages are shown. (C) The summed counts for the miR-181 family members are depicted. The results are in agreement with limited published data that are available.
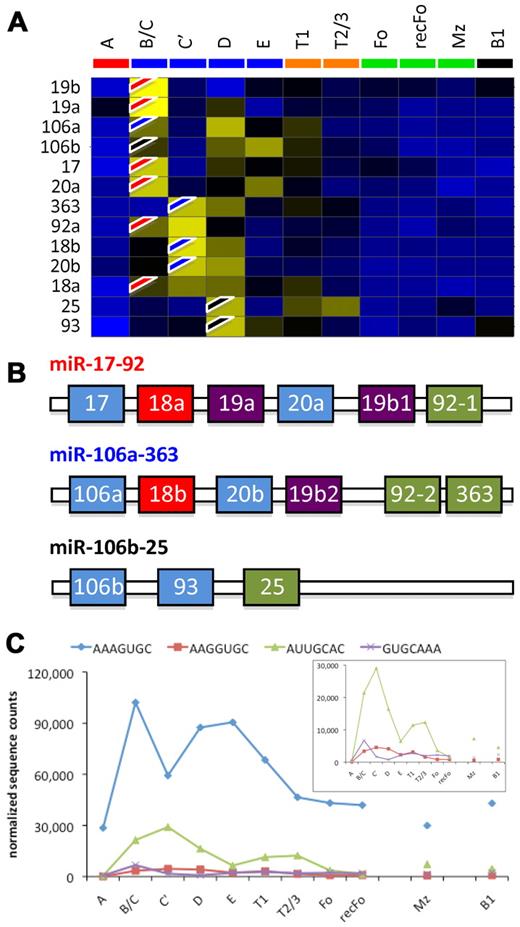
Expression analysis of oncomir-1/miR-17-92 and its paralogs miR-106a-363 and miR-106b-25. (A) Hierarchical clustering of the miRNA expression frequencies. The flags (red indicates oncomir-1/miR-17-92; blue, miR-106a-363; and black, miR-106b-25) show where each miRNA is induced. The results suggest sequential expression of the 3 clusters in consecutive developmental stages. (B) The architecture of the paralogs. Similarly colored miRNAs within each cluster have identical seed sequences. (C) The summed counts for each seed family are shown (inset is a rescaling of the last 3 seed families), suggesting biphasic expression of the seed families.
Expression analysis of oncomir-1/miR-17-92 and its paralogs miR-106a-363 and miR-106b-25. (A) Hierarchical clustering of the miRNA expression frequencies. The flags (red indicates oncomir-1/miR-17-92; blue, miR-106a-363; and black, miR-106b-25) show where each miRNA is induced. The results suggest sequential expression of the 3 clusters in consecutive developmental stages. (B) The architecture of the paralogs. Similarly colored miRNAs within each cluster have identical seed sequences. (C) The summed counts for each seed family are shown (inset is a rescaling of the last 3 seed families), suggesting biphasic expression of the seed families.
Expression of oncomir-1/miR-17-92 and its paralogs in BM B2-lineage populations
We noticed that miR17-92/oncomir-1 and its paralogs miR-106a-363 and miR-106b-25 are expressed in the BM B-cell populations. To study these 3 paralogs in more detail we clustered the expression profiles of the miRNAs that they encode (Figure 6A). Most members of the oncomir-1/miR-17-92 cluster (flagged red on the heat map) appear in FrB/C, most members of miR-106a-363 (flagged blue) are expressed in FrC′, and the miRNAs encoded by the third paralog miR-106b-25 (black flags) are expressed in FrD. All 3 miRNA clusters encode miRNAs that use similar seed sequences for target recognition (Figure 6B). Because seed sequences are essential for target recognition, one can postulate that miRNAs with identical seed sequences target the same mRNA (or mRNAs), whereas the rest of its sequence fine-tunes its targeting efficiency.44 We therefore analyzed the expression of the 4 “seed-families,” by summing the counts of the miRNAs with identical seed sequences. The results show biphasic expression for each seed group in the BM fractions, although there also seems to be a slight induction from FrE to T1 to T2/3 (Figure 6B).
Novel candidate miRNAs expressed during B-cell development
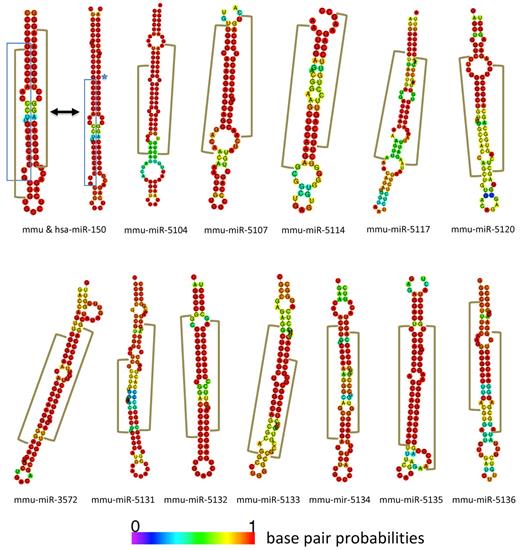
To identify new miRNAs we subjected our sequences to the miRanalyzer Web server.30 The analysis resulted in 405 hairpin candidates designated SJmc-1 through -405 (St Jude miRNA candidate 1 through 405). Within this group SJmc-1 through -64 were expressed at a level of ≥ 10 copies per stage on average throughout B-cell development. Of the 405 candidate hairpins 198 have equivalents in the human genome (on the basis of use of the UCSC liftover tool). Inspection of the top 100 of the candidate list generated by miRanalyzer and the remaining hairpins with equivalents in the human genome yielded 66 candidates (supplemental Table 3). Our initial analysis was done using the miRBase V14 version.26 For complete analysis we therefore had to cross-reference our results to V15 and V16 updates when these became available. The V16 update also contained the novel miRNAs described in an article that came out before the V16 release.9 This article confirmed 4 of our candidate list of 66 to be miRNAs (SJmc-15, -44, -60, and -90 were named mmu-miR-3068, -466n, -3096, and -3058). Besides these, SJmc-4, -7, -23, -24, -29, -56, -63, -68, -92, and -116 were annotated as mmu-miR-1839, -1306, -1934, -669-o, -669-i, -1249, -1944, -1955, -1964, and -26-a-2, respectively. For one of the recently annotated miRNAs, a miRNA* sequence was found which has not been described in miRBase to date26 (SJmc-63* is mmu-miR-1944*). In summary, our analysis yielded several candidates that were subsequently identified in other analyses, providing validation for our approach. The miRNA candidates that were left were curated by miRBase.26 This procedure identified 2 of our candidates to be identical to ribosomal RNA sequences (SJmc-41 and SJmc-45). Because of the abundancy of ribosomal RNA in the cell and because we did not identify miRNA* sequences for these hairpins, these candidates were not accepted as novel miRNAs. In addition, miRBase26 did not accept 6 of our candidates that have sequence homology with snoRNAs (SJmc-27, -43, -57, -60-2, -62, and -91) and for which we did not find miRNA* sequences either. It is possible that these human snoRNAs function both as snoRNAs and as miRNAs as has been suggested previously for other loci45 ; therefore, these can be considered miRNA candidates that can be named by miRBase when additional proof is presented. Ultimately, miRBase accepted 45 of our candidates to be novel miRNAs,26 and those were named accordingly (supplemental Table 3). For 12 of these we found the associated miRNA* sequence in addition to the mature miRNA sequence (Figure 7). We further validated the candidates by (1) confirming their presence in multiple developmental stages, (2) confirming their generation on deep sequencing of small RNAs isolated from B220+ splenocytes, (3) by real-time qPCR, or (4) showing their conservation in the human genome (the results of these analyses are summarized in supplemental Table 3). Of the 45 novel miRNAs 35 were identified in multiple stages of B-cell development, and 13 were confirmed on deep sequencing of B220+ splenocytes. PCR analysis validated 39 of the 45 novel miRNAs (supplemental Figure 3; supplemental Table 4). To examine the conservation of the mouse candidate hairpins in humans we examined orthologous regions on the human genome that were identified by UCSC Genome Browser's liftover algorithm.46,47 Although 19 novel miRNAs appeared to have orthologs on the human genome, only 2 of them passed our inspection criteria. Altogether, 34 of the 45 novel miRNAs were validated by multiple assays and the remaining 11 by one method. In line with the analyses of the known miRNAs, the normalized sequence counts for the new miRNAs were calculated (supplemental Table 5). The counts for SJmc-116/miR-26a-2 were considerably higher than those for the other novel miRNAs (33 611 on average). Because this locus encodes a miRNA of identical sequence to miR-26a-1, one of the most highly expressed miRNAs in our dataset, the relative contribution of the miR-26a-1 and -2 locus to the miR-26a sequence counts cannot be determined. The second most highly expressed new miRNA is miR-5097 that has an average count of 458. This shows that the novel miRNAs are expressed at lower levels than the known miRNAs in B cells, which is in agreement with results of other miRNA profiling studies.3,5,6 The question remains whether these lower levels are physiologically relevant, because it probably requires the mRNA targets in question to be expressed at low levels as well. However, it cannot be excluded that the latter is the case. In addition, we have not addressed whether the novel miRNAs are present in other tissues, where they might be expressed at higher levels. In summary, our analysis identified 45 new candidate miRNAs, of which 12 have associated miRNA* sequences and 6 novel miRNA candidates.
Novel miRNAs with associated miRNA* sequences. New miRNA/miRNA* hairpin structures are depicted with miR-150 as a control. The blue brackets encompass the generic miRNA sequence as found in miRBase.25 The brown brackets represent the discrete regions that are hit by the sequences in our libraries. The blue stars indicate where the human sequence differs from the mouse sequence.
Novel miRNAs with associated miRNA* sequences. New miRNA/miRNA* hairpin structures are depicted with miR-150 as a control. The blue brackets encompass the generic miRNA sequence as found in miRBase.25 The brown brackets represent the discrete regions that are hit by the sequences in our libraries. The blue stars indicate where the human sequence differs from the mouse sequence.
Discussion
We have elucidated the miRNome of the B2 B-cell developmental lineage by deep sequencing. The miRNA expression profiles of the different stages are distinct and characteristic for each subpopulation. Hierarchical clustering showed that groups of miRNAs are induced stage specifically. The stage-specific expression profiles suggest that the cells were sorted in relatively pure populations. We did not attempt to demonstrate this experimentally because, although we pooled BM and spleen B cells from 10 mice, sorting some of the stages yielded cell numbers too low to allow for reanalysis. Most importantly however, all the validating experiments were performed with biologic replicate samples (the same populations obtained from a different sort on a different day), and the results of these validations clearly indicate that our sorting protocol yields reproducible results. Altogether this confirms the validity of our sequencing data even though it was generated with the use of cells isolated from a single sort.
The clustering of the developmental stages places the BM-derived recFo cells among the mature B cells isolated from the spleen and shows their miRNA expression profile to be most similar to the one of their predecessors, the Fo cells. In contrast, spleen-derived T1 cells display a different miRNA expression profile from that of FrE cells (the predecessors of T1 cells in the BM). This suggests that the FrE-to-T1 transition is a differentiation step involving “reprogramming” of miRNA expression. Consequently, this may result in differences in protein expression. The miRNA profile of B1 cells resembles the other mature B-cell subsets in the spleen, although these cells are derived from a different developmental lineage.48 Despite these similarities a small B1-specific cluster is apparent. One of the miRNAs in this cluster is miR-146a that has been described to be activated by lipopolysaccharide/NF-κB signaling.49 Because B1 cells are thought to be involved in innate immune responses, it is possible that the B1-specific miRNAs are induced because the B1 cells have been activated. Alternatively, it has also been suggested that B1 cells require spleen-derived signals for full maturation.50 Another possibility is therefore that the B1-specific miRNAs are involved in B1-cell development. Although the described B-cell subpopulations show stage-specific expression patterns, our statistical analysis also shows that the similarities between the different stages are in complete concordance with the model for the developmental pathway of the B2 B-cell lineage.
The expression patterns of the individual miRNAs display gradual changes from stage to stage during B2 B-cell development. This fluidity is retained during the transition from FrE cells (BM) into T1 B cells (spleen), despite that the hierarchical clustering shows substantial differences between these 2 stages. The resolution of our data is best shown by the results obtained for oncomir-1/miR-17-92 and its 2 paralogs miR-106a-363 and miR-106b-25. Oncomir-1/miR-17-92 is essential for B cells because it targets Bim,10,15 whereas its paralogs are thought to play a redundant role in B-cell development.15 Previous work showed that oncomir-1/miR-17-92 and miR-106b-25 are ubiquitously expressed in many mouse tissues, whereas miR-106-363 was not detectable by RNAse protection assay in any of the tissues tested.15 Our results show that miR-106a-363 is expressed in mouse BM from FrC′ on (the BM was not examined by Ventura et al15 ). Moreover, our data show that the 3 paralogs are induced sequentially in FrB/C, FrC′, and FrD (oncomir-1/miR-17-92, miR-106a-363, and miR-106b-25, respectively). We also analyzed data extracted from a recent miRNA profiling study.6 This data confirmed that oncomir-1/miR17-92 is induced in pro-B cells (results not shown). However, the staining procedure applied by those investigators did not allow for distinguishing FrC′ and FrD cells (these sets are probably combined in their pre-B population), so their dataset cannot distinguish the sequential induction of miR-106a-363 and miR-106b-25.
We also examined the expression patterns of selected miRNAs with well-established roles in B-cell development. miR-181a was reported to be abundant in thymocytes and BM B cells,12 and the latter is confirmed by our data. It was reported that miR-150 is absent from pro-B and pre-B cells and is induced in resting and mature B cells, where it down-regulates c-Myb.17 Our data show that miR-150 is expressed in FrA and FrB/C but decreases in FrC′ to reach its lowest levels in FrD and FrE. It is then induced again in T1 B cells to reach peak levels in T2/3, Fo, recFo, and Mz cells. Our analysis therefore shows that miR-150 is present in pro-B and pre-B cells, suggesting that the previous analysis by Northern blot17 is not sufficiently sensitive to detect miR-150 in the BM.
Two proinflammatory miRNAs, miR-146a and miR-155, were both found to be higher in Mz than in Fo B cells despite that these both develop from the same predecessor cell (T1 cells develop into T2/3 cells, and in the latter population precursors are present for both Fo and Mz cells).51 This suggests that miR146a and miR-155 are more important for Mz cell development or that these Mz B cells could have received proinflammatory signals necessary for their development or function or both. Lipopolysaccharide-induced expression of miR-146a depends on NF-κB and acts as a negative feedback loop on NF-κB activity by down-regulating IL-1 receptor–associated kinase 1 and TNF receptor–associated factor 6.49 miR-155 is also induced by proinflammatory signals and sustains these by inhibiting Socs1, which is a negative regulator of immune cell activation.52 It has recently been described that miR-34a regulates B-cell development in the BM by targeting Foxp1.24 These investigators reported that miR-34a is low in lineage-negative cells but that it is high in pro-B cells. Next, it is down-regulated in pre-B cells to reach a low level again in B cells. Our data show that miR-34a is virtually absent in FrA and FrC′ but that it is specifically and strongly induced in FrB/C cells. Furthermore, a second induction of this miRNA can be observed from FrD through T2/3, but the levels in these populations never reach that of the FrB/C cells. In summary, our data are in agreement with previous reports describing expression levels of individual miRNAs.
The deep-sequencing approach also allowed for the identification of 45 new miRNAs. For 12 of these we also found the miRNA* sequence, which is the most stringent validating argument that can be applied.5 In line with previous reports,3,5,6 the normalized sequence counts for the new miRNA were significantly lower than those for the known miRNAs. Besides the novel miRNAs we also identified an miRNA/miRNA* combination (SJmc-56) that is new to mouse but which is already annotated on the human genome as hsa-miR-1249 and previously undetected miRNA* sequences for 2 miRNAs annotated in the recent miRBase 15 update (mmu-miR-1944* and mmu-miR-26a-2*).26 In fact, our data show that miR-1944* is much higher expressed than miR-1944, and the same was found for miR-1306*. This could mean that either these 2 miRNAs have been annotated incorrectly or that these miRNAs exhibit tissue-specific strand preference.5 Finally, just as is the case for SJmc-116/miR-26a-2/miR-26a-1 (see “Results”) the miRNA generated by mmu-miR-3962 differs only one nucleotide from mature mouse Let-7g (yet they annotate to different chromosomes). Because one nucleotide difference falls within the parameters that we set for the analysis, we cannot determine the relative contribution of each to the sequence counts. However, we would like to propose that mmu-miR-3962 is a new member of the Let-7 family.
In summary, we used the Hardy classification19,20 to delineate the B2 B-cell developmental pathway into 10 developmental stages and subsequently sequenced the miRNAs that are expressed in each stage. We characterized the fine-regulation of the expression of 232 of the known miRNAs that are expressed during B-cell development and found stage-specific profiles that smoothly progress through the lineage. Furthermore, we identified 45 new miRNAs. Our data provide a complete characterization of the miRNome of the B2 B-cell lineage, thereby providing a point of reference for future studies on the role of miRNAs in B-cell development, B-cell function, and B-cell disease.
The online version of this article contains a data supplement.
The publication costs of this article were defrayed in part by page charge payment. Therefore, and solely to indicate this fact, this article is hereby marked “advertisement” in accordance with 18 USC section 1734.
Acknowledgments
We thank Dr John Obenauer, Dr Robert Carter, and Dr David Finkelstein of St Jude's Information Sciences Department for help with bioinformatics and statistical analyses. Dr Richard Ashmun of St. Jude's Flow Cytometry and Cell Sorting Shared Resource advised on FACS strategies.
This work was supported by the National Institutes of Health (NIH) and the Howard Hughes Medical Institute (HHMI; G.J.H.) and the American Lebanese Syrian Associated Charities. E.P.M. was supported by a fellowship from the American Australian Association.
National Institutes of Health
Authorship
Contribution: D.C.S., G.J.H., D.R.G., and S.W. designed research; D.C.S., A.M.H.-E., E.P.M., and S.W. performed research; D.C.S., D.M., G.N., and S.W. analyzed data; and D.C.S., D.R.G., and S.W. wrote the paper.
Conflict-of-interest disclosure: The authors declare no competing financial interests.
Correspondence: Douglas R. Green, Department of Immunology, St Jude Children's Research Hospital, Memphis, TN 38105; e-mail: douglas.green@stjude.org; or Sebo Withoff, Department of Genetics, University Medical Center Groningen, Groningen, The Netherlands; e-mail: s.withoff@medgen.umcg.nl.
References
Author notes
D.R.G. and S.W. contributed equally to this study.

