Abstract
Abstract 2889
The ability to characterize distribution of neoplastic hematopoietic cells and their progenitors in their native microenvironment is emerging as an important challenge and potential therapeutic target in many disease areas, including multiple myeloma. The goal of the study is to develop a method of analyzing neoplastic cells in their hematopoietic niche context using readily available tissue sections and standard histology approaches. We applied this method to study myeloma cells spatial distribution within a given distance of bone, blood supply, or other cell type, and can be generalized to any class of hematopoietic progenitor stem cell and tissue type.
We utilized consecutive cut sections combined with whole slide scanning and novel image analysis to provide quantitative data on bone marrow microenvironment. Consecutive bone marrow core biopsy sections from multiple myeloma patients were stained for CD34 (endothelial cells) and CD138 (myeloma plasma cells).
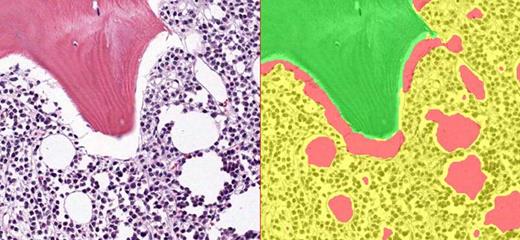
We applied pattern recognition image analysis to find all bone areas, followed by a cell based analysis to identify all plasma cells. We then computationally grew a distance out from bone, at increments of 5 microns, and classified myeloma cells as either inside or outside of this distance, and computed the percentages of myeloma cells near bone.
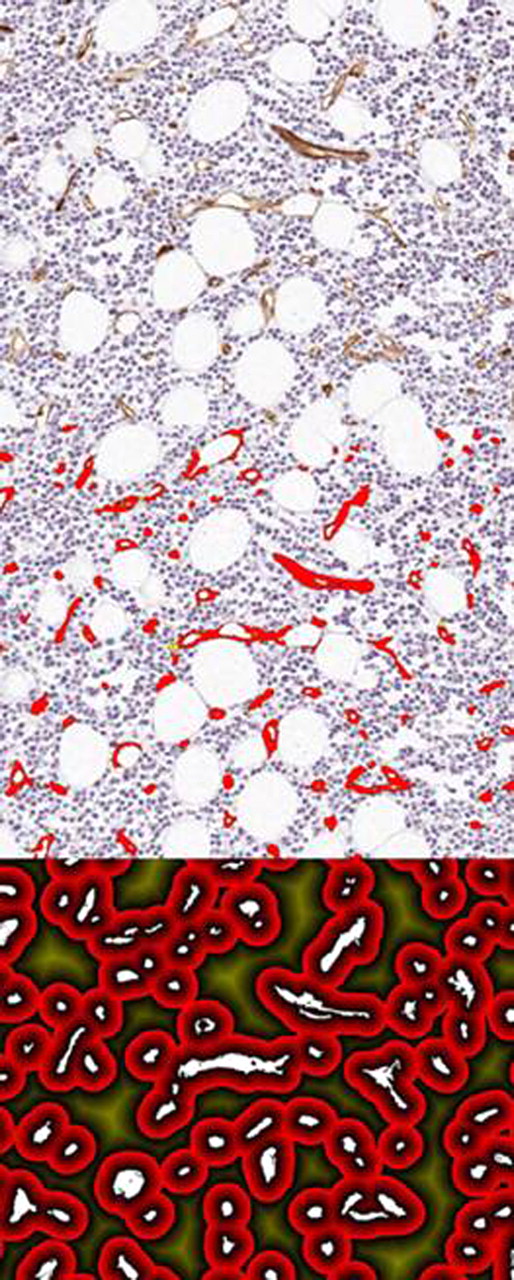
We identified endothelial cells using an image analysis thresholding technique, followed by an algorithm that groups neighboring endothelial cells into vessels. The number of vessels was reported as a microvessel density, and the percentage of hematopoietic cells within a given distance of vessels was also calculated for each sample. We then looked at three distances (15, 20, and 25 microns) in twelve representative samples as a threshold to stratify the neoplastic cells based on their distance from vessels.
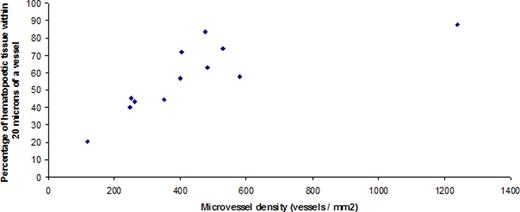
The image analysis markup for the pattern recognition approach in bone is shown in Figure 1, and the vessel image analysis approach is described in Figure 2. Using 12 bone marrow sections, we determined the best distance for discriminating between low and highly vascularized samples was 20 microns (Table 1). The correlation between computer based microvessel density (MVD) analysis and percentage of hematopoietic cells in proximity to vessels (MVP) is shown in Figure 3.
We demonstrate the feasibility of analyzing the spatial distribution of plasma cells, and possibly other hematopoietic / stem cells in their microenvironment, as characterized by the distance to both bone and vessels in bone marrow. The distance of 20 microns was determined empirically as providing the most separation of data between high and low vascularized samples, suggesting a potential differential oxygenation point. While the MVD measurement had a high degree of correlation with MVP, MPV measures a different biological phenomena, namely the percentage of tissue that is well oxygenated, and would only be perfectly correlated if the vessels were exactly evenly distributed in a sample. Preliminary observations appear that there is substantially greater information in the MVP measurement particularly between the range of 400 to 600 vessels / mm2, on samples that would be considered highly vascularized. Further work is ongoing to characterize a large patient cohort and correlate various microenironment variables with clinical outcome and other standard laboratory measurements.
Image analysis pattern recognition was utilized to automatically identify bone (green)
Image analysis pattern recognition was utilized to automatically identify bone (green)
Image analysis process to identify vessels and then mark out a given distance from vessels for which to measure the percentage of plasma cells further than 20 microns from any vessel (area in dark yellow in bottom figure).
Image analysis process to identify vessels and then mark out a given distance from vessels for which to measure the percentage of plasma cells further than 20 microns from any vessel (area in dark yellow in bottom figure).
The correlation between computer-analyzed microvessel density (MVD) and microvessel proximity (MVP).
The correlation between computer-analyzed microvessel density (MVD) and microvessel proximity (MVP).
Determination of an optimum distance from vessels was derived empirically, using a subset of twelve slides with high and low vascularization.
| . | Percent of tissue hematopoetic tissue within: . | MVD . | ||
|---|---|---|---|---|
| Slide ID . | 15 microns . | 20 microns . | 25 microns . | vessels/mm2 . |
| 1 | 74.5 | 16.6 | 0.0 | 475 |
| 2 | 64.8 | 28.1 | 0.0 | 404 |
| 3 | 42.2 | 53.4 | 2.1 | 351 |
| 4 | 80.6 | 12.5 | 0.0 | 1239 |
| 5 | 42.5 | 53.1 | 1.7 | 251 |
| 6 | 50.8 | 34.2 | 9.1 | 398 |
| 7 | 58.4 | 36.8 | 0.1 | 482 |
| 8 | 54.8 | 42.2 | 0.1 | 581 |
| 9 | 38.2 | 56.5 | 3.4 | 246 |
| 10 | 40.8 | 55.4 | 1.4 | 261 |
| 11 | 19.6 | 52.1 | 27.4 | 119 |
| 12 | 68.1 | 26.1 | 0.0 | 529 |
Landis:Flagship Biosciences: Employment. Lange:Flagship Biosciences: Employment. Potts:Flagship Biosciences: Employment.
Author notes
Asterisk with author names denotes non-ASH members.


This feature is available to Subscribers Only
Sign In or Create an Account Close Modal