Abstract
Abstract 1390
We undertook a comprehensive prospective study to compare the clinical, cellular and molecular differences between newly diagnosed (ND) and relapsed (Rel) acute promyelocytic leukemia (APL) patients. 98 ND cases and 28 Rel cases (5 second relapses) were enrolled in this study. 85 (86.7%) of the ND cases were treated with a single agent arsenic trioxide (ATO) regimen. Five (17.8%) Rel cases were discharged against medical advice, the rest were treated with a combination of ATO, ATRA and chemotherapy and advised a SCT in molecular remission.
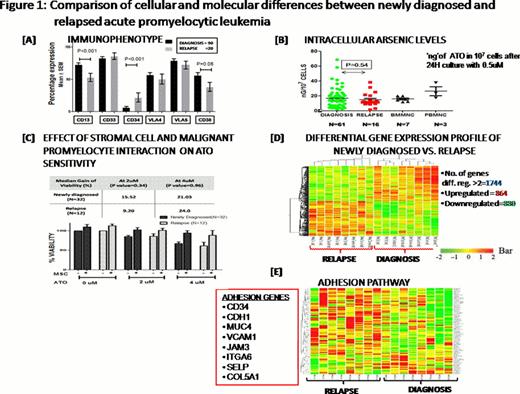
Table 1 summarizes the major clinical differences between ND and Rel cases. Rel patients had a significantly lower WBC counts and higher platelet counts at diagnosis. Coagulopathy was less prominent in Rel cases as evident by the significantly lower number of cases with IC bleeds in this group and the significantly lower platelet rich concentrate requirement in induction (Table 1). Immunophenotyping of the malignant promyelocytes and blasts revealed a significantly increased CD34 expression and significantly reduced CD13 and CD38 expression in Rel cases (Figure 1A). Cytogenetic (CTG) analysis revealed that relapsed patients had a trend to greater proportion of cases with additional karyotypic abnormalities (Table 1).
Evaluation of the malignant promyelocytes and blasts' capacity to concentrate ATO intracellularly as shown in Figure 1B (level of ATO in 107 cells after 24 hour culture with 0.5μM ATO was measured using Atomic Absorption Spectrometry) was not significantly different. Similarly an in-vitro assay of cytotoxicity of ATO (IC-50 measured using standard MTT cell viability assay) was not significantly different between ND and Rel cases (median IC-50= 5.64 ± 3.8 vs. 4.59±4.5 μM; P= 0.28). We had previously noted a protective effect of stromal cell co-culture on the apoptotic action of ATO on malignant promyelocytes. We compared this effect in newly diagnosed and relapsed cases and noted that this protective effect was seen in both groups and was not significantly different (Figure 1C).
A microarray expression profile on 8 randomly selected ND and 8 Rel cases was done. Total RNA extracted from BMMNCs with 90% promyelocytes + blasts and above (enriched when required) was used and microarray was performed with a standard one color Agilent–44K array platform. Differentially regulated genes were clustered using hierarchical clustering based on Pearson coefficient correlation, and 1744 genes were 2 fold and above differentially expressed between at relapse and at diagnosis (Figure 1D). 26 differentially expressed genes were validated by RQ-PCR using ABI Taqman assay system (data not shown). Differential gene list were classified based on functional category and pathways using Biointerpreter Software. The most prominent differentially regulated pathways were cell adhesion, cell survival, cell cycle, immune regulation, stem cell regulation, ubiquitinproteasome degradation system and ion transporters. The heat map of the one such prominent pathway (adhesion) is shown in the figure 1E.
In conclusion, the Rel cases have significant clinical, immunophenotypic and molecular differences when compared to the newly diagnosed cases. The potential reason for relapse and poor prognosis in the Rel group appears to be multi-factorial. Exploring the pathways and genes differentially regulated between these two groups may provide insights in identifying potentially novel therapeutic targets. Preliminary in-vitro data from our centre, consistent with these observations, has shown that stromal cell adhesion mediates resistance to ATO and that inhibition of this by drugs such as bortezomib can overcome it.
Comparison of the baseline demographic data of newly diagnosed and relapsed acute promyelocytic leukemia patients
| Demographic Parameters . | Newly Diagnosed N=98 N (%)/Median (Range) . | Relapsed N=28 N (%)/Median (Range) . | P-value . |
|---|---|---|---|
| Age (years) | 28 (2-60) | 31 (8-54) | 0.997 |
| Sex: Male | 48 (49) | 25 (89.3) | 0.000 |
| WBC x 109/Lt | 14.5 (0.5-290) | 3.5 (0.5-24.90) | 0.000 |
| Platelet x 109/Lt | 17 (3-85) | 31.5 (6-248) | 0.006 |
| RT-PCR: bcr1 | 59 (60.2) | 21 (75) | |
| bcr2 | 2 (2) | 0 | 0.311 |
| bcr3 | 37 (37.8) | 7 (25) | |
| Lactate dehydrogenase (IU/Lt)) | 748 (291-2700) | 554 (284-1155) | 0.006 |
| Fibrinogen mg% | 161 (25-689) | 163 (70-1122) | 0.975 |
| Additional Cytogenetic finding | 34 (36.6) | 11 (61.1) | 0.068 |
| IC Bleed in induction: Yes | 16 (16.3) | 0 (0%) | 0.022 |
| Platelet rich concentrates in induction (units) | 24 (0-85) | 16 (0-48) | 0.027 |
No relevant conflicts of interest to declare.
Author notes
Asterisk with author names denotes non-ASH members.


This feature is available to Subscribers Only
Sign In or Create an Account Close Modal