Abstract
Abstract 1850
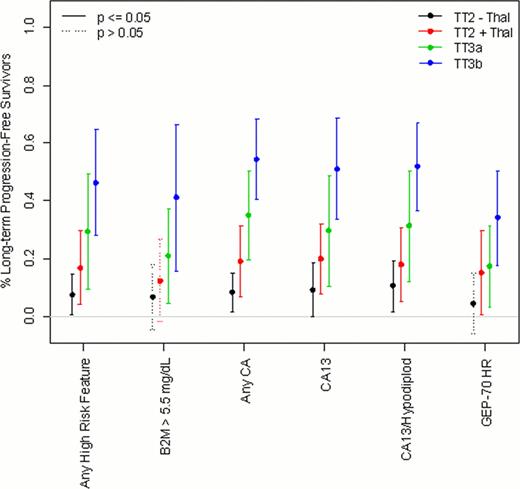
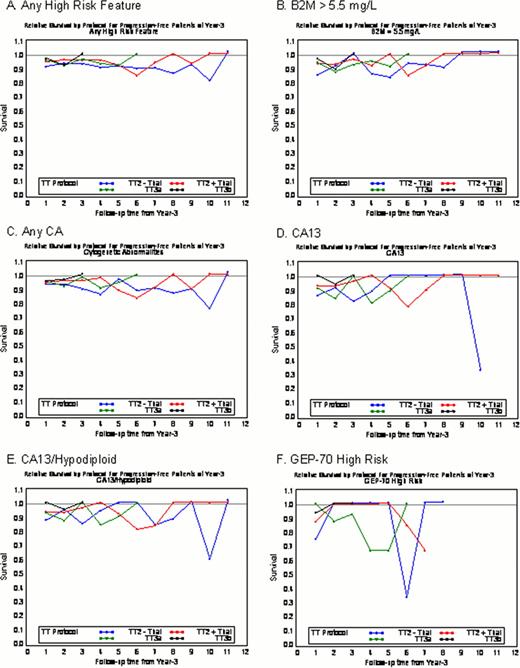
The use of the word cure when discussing MM therapy remains taboo. Albeit most investigators applaud the enormous improvement in clinical outcomes ushered in initially by autotransplant-supported high-dose melphalan. Additionally, the introduction of novel agents inaugurated with thalidomide and followed by bortezomib and lenalidomide have continued a course towards a cure status. Overall survival (OS) and progression-free survival (PFS) are particularly poor with GEP-defined high-risk MM. Here we have examined whether, due to much earlier data maturation in high-risk MM, a fraction of long-term progression-free survivors can be discerned. This fraction of patients not susceptible to progression is consistent with the concept of cure. Here, we use a logistic/Weibull mixture model to estimate the proportion of long-term progression-free survivors. TT2 and TT3 results have been reported previously. We estimated 4-yr rates of OS, PFS and continuous CR (CCR) in TT2's control arm (TT2-), TT2's thalidomide arm (TT2+), TT3A (with VTD maintenance) and TT3B (with VRD maintenance) (Table 1). Progressive improvement in all 3 endpoints were noted with transition from TT2- to TT2+ and further to TT3A/B among the “any high risk feature” cohort and especially for GEP-70-defined high risk. Next we applied the logistic/Weilbull mixture model revealing progressive increments in predicted fractions of long-term PFS (Table 2 ). These data are depicted graphically with p-values in Figure 1. We also examined relative survival rates for patients who remain PFS after 3yr in the context of age and gender matched survival for the general population (Figure 2). These observations are compatible with a finite cure rate in high-risk myeloma. Data will be presented on gene probes of plasma cells and whole bone marrow biopsies, which may define at a baseline status, candidates with high cure potential.
Estimated OS, PFS and CCR at 4-years from Enrollment by High Risk Features
A. TT2
| Risk Factor . | TT2 - Thal . | TT2 + Thal . | ||||||
|---|---|---|---|---|---|---|---|---|
| N . | OS . | PFS . | CCR . | N . | OS . | PFS . | CCR . | |
| Any High Risk Feature | 143 | 53.85% | 34.97% | 15.38% | 134 | 59.70% | 49.25% | 35.82% |
| B2M > 5.5 mg/L | 63 | 52.38% | 31.75% | 22.22% | 59 | 55.93% | 45.76% | 30.51% |
| Any CA | 104 | 50.96% | 32.69% | 10.58% | 93 | 59.14% | 47.31% | 32.26% |
| CA13 | 42 | 40.48% | 26.19% | 14.29% | 58 | 50.00% | 39.66% | 24.14% |
| CA13/Hypodiploid | 59 | 45.76% | 32.20% | 15.25% | 64 | 51.56% | 40.63% | 26.56% |
| GEP-70 High Risk | 20 | 25.00% | 10.00% | 10.00% | 26 | 34.62% | 23.08% | 19.23% |
| LDH > 300 U/L | 15 | 53.33% | 26.67% | 20.00% | 13 | 38.46% | 38.46% | 38.46% |
B. TT3
| Risk Factor . | TT3a . | TT3b . | ||||||
|---|---|---|---|---|---|---|---|---|
| N . | OS . | PFS . | CCR . | N . | OS . | PFS . | CCR . | |
| Any High Risk Feature | 139 | 64.75% | 58.27% | 43.88% | 97 | 63.27% | 57.12% | 42.27% |
| B2M > 5.5 mg/L | 65 | 53.85% | 46.15% | 29.23% | 50 | 58.82% | 52.94% | 30.00% |
| Any CA | 100 | 62.00% | 56.00% | 47.00% | 69 | 62.86% | 58.54% | 46.38% |
| CA13 | 53 | 60.38% | 50.94% | 43.40% | 38 | 60.53% | 55.26% | 47.37% |
| CA13/Hypodiploid | 65 | 61.54% | 52.31% | 46.15% | 49 | 59.18% | 55.10% | 44.90% |
| GEP-70 High Risk | 40 | 42.50% | 35.00% | 30.00% | 37 | 37.84% | 35.14% | 24.32% |
| LDH > 300 U/L | 7 | 42.86% | 42.86% | 0.00% | 10 | 20.00% | 20.00% | 20.00% |
Model Estimates for Proportions of Long-term Progression Free Survivors in High Risk Subgroups. (These estimates were derived from a logistic/Weibull mixture model for progression-free survival. Based on observed survival trends, these models predict a fraction of patients that is not susceptible to the event of interest).
| Protocol . | Predicted Fraction of Long-term Progression-Free Survivors with 95% CI . | |||||
|---|---|---|---|---|---|---|
| Any High Risk Feature . | B2M > 5.5 mg/dL . | Any CA . | CA13 . | CA13/Hypodiploid . | GEP-70 HR . | |
| TT2 - Thal | 0.07 (0.00, 0.14) | 0.07 (−0.04, 0.18) | 0.08 (0.02, 0.15) | 0.09 (0.00, 0.19) | 0.11 (0.02, 0.19) | 0.04 (−0.06, 0.15) |
| TT2 + Thal | 0.17 (0.04, 0.30) | 0.12 (−0.02, 0.27) | 0.19 (0.07, 0.31) | 0.20 (0.08, 0.32) | 0.18 (0.05, 0.31) | 0.15 (0.01, 0.30) |
| TT3a | 0.29 (0.09, 0.49) | 0.21 (0.04, 0.37) | 0.35 (0.20, 0.50) | 0.30 (0.10, 0.49) | 0.31 (0.12, 0.51) | 0.17 (0.03, 0.32) |
| TT3b | 0.46 (0.28, 0.65) | 0.41 (0.16, 0.67) | 0.54 (0.40, 0.68) | 0.51 (0.34, 0.69) | 0.52 (0.37, 0.67) | 0.34 (0.18, 0.51) |
Model Estimates for Proportions of Long-term Progression Free Survivors in High Risk Subgroups. With the exception of TT2- in high B2M and GEP-70 and of TT2+ in high B2M settings, all other subsets were significant (solid symbols). Highest success rates were observed for TT3B reaching 40% to 50%.
Model Estimates for Proportions of Long-term Progression Free Survivors in High Risk Subgroups. With the exception of TT2- in high B2M and GEP-70 and of TT2+ in high B2M settings, all other subsets were significant (solid symbols). Highest success rates were observed for TT3B reaching 40% to 50%.
Relative survival by protocol restricted to patients remaining progression-free after 3 years. For several scenarios (A, B, C), normal-like values are reached progressively earlier with transition from TT2- to TT2+ to TT3A to TT3B.
Relative survival by protocol restricted to patients remaining progression-free after 3 years. For several scenarios (A, B, C), normal-like values are reached progressively earlier with transition from TT2- to TT2+ to TT3A to TT3B.
No relevant conflicts of interest to declare.
Author notes
Asterisk with author names denotes non-ASH members.


This feature is available to Subscribers Only
Sign In or Create an Account Close Modal