Abstract
Allogeneic hematopoietic stem cell transplantation (HSCT) is a potentially curative treatment for patients with chronic myeloid leukemia (CML), and is reserved for those who do not respond optimally to tyrosine kinase inhibitors (TKI). Baccarani et al summarized international consensus criteria (ICC) for response to imatinib in first chronic phase (CP) based on time to response; these criteria are used to select alternative therapies including second generation TKIs or HSCT for less than optimal responses. (Baccarani M, et al.J Clin Oncol. 2009; 27:6041–6051). Patients in blast crisis (BC) or accelerated phase (AP) proceed for HSCT if eligible, regardless of optimal response. The prognostic influence of ICC stratification prior to transplant is unknown. We hypothesized the ICC would influence progression after HSCT in patients with CML; in this study we report the impact of this score on transplant outcomes.
We performed a retrospective review of patients with CML who underwent a reduced intensity conditioning treatment with busulfan/fludarabine/ATG ± imatinib followed by HSCT. From 1/2000 to 5/2012, 104 patients underwent a matched unrelated or related allogeneic HSCT at the M.D. Anderson Cancer Center. The ICC was applied to patients prior to transplant to denote optimal, suboptimal, or failure of response to a TKI. Demographic and disease-related data were collected, as well as transplant-related covariates. Outcome of interest was progression free survival (PFS) and overall survival (OS), which was estimated using the Kaplan-Meier method.
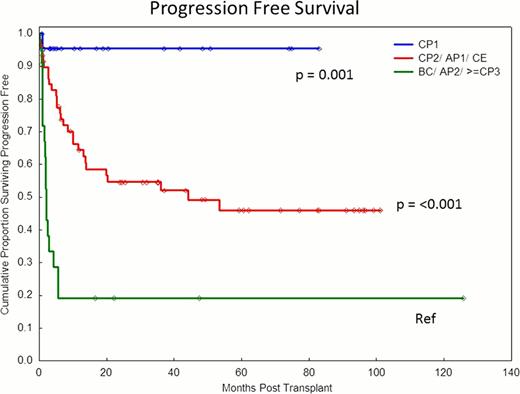
Patient characteristics are summarized in Table 1, and analysis in Table 2. 36/104 patients received a conditioning treatment containing imatinib and PFS was not statistically different. With median follow up of 36 months (1–126), 62 patients are alive and 30 patients have progressed. Of the 42 deaths, 27(64%) were primarily attributed to leukemia relapse, 3 (9%) infection, 6(17%) graft versus host disease and 6(10%) of other causes. OS was 50% (38–61%) at last follow up and 55% (44–65%) at 36 months. By multivariate analysis, factors predicting progression were: disease status CP1 vs >CP1 (p=0.001) and failure vs optimal/suboptimal response to TKI as defined by ICC (p=0.02). Optimal or suboptimal response defined by ICC was not an independent predictor of the rate of disease progression, OS, or PFS. 77% of patients in the most advanced disease group (AP2/BC/≥CP3) failed to respond to a TKI compared with 44% of patients in CP1 and intermediate group (CP2/AP1/CE), (p=0.006). Age >50 yrs was associated with a trend for higher disease progression, and lower OS and PFS but did not reach significance. There was no impact of ICC stratification in first chronic phase patients; only one patient died or progressed despite 48% identified as failure based on ICC score.
In this single center study with long follow up, we demonstrated ICC score is strongly correlated with disease status at transplant. The latter factor remains the most significant predictor of outcomes. Patients transplanted in first chronic phase have a low rate of progression with allogeneic hematopoietic transplantation regardless of response to TKI therapy based upon ICC score.
| ICC Score prior to HSCT . | Optimal (n=21/19%) . | Suboptimal (n=29/29%) . | Failure (n=53/52%) . |
|---|---|---|---|
| Diagnosis to HSCT (yrs) | 2.5 (0.3–20) | 2 (0.4–26) | 2.8 (0.2–17) |
| Age at HSCT (yrs) | 44 (14–66) | 47 (19–64) | 44 (21–69) |
| Disease Status Correlated to ICC | |||
| CP1 (23/23%) | 5/22% | 7/30% | 11/48%% |
| CP2 (39/38%) | 12/31% | 13/33%% | 14/36% |
| ≥CP3 (5/5%) | 2/40% | 1/20% | 2/40% |
| AP1 (10/10%) | 0/0% | 4/40% | 6/60% |
| AP2 (7/7%) | 0/0% | 1/14% | 6/86% |
| BC (10/9%) | 1/10% | 0/0% | 9/90% |
| CE (9/8%) | 1/11% | 3/33% | 5/56% |
| Imatinib vs 2nd gen TKI pre HSCT | 11 (52%)/10 | 17 (58%)/12 | 27 (50%)/26 |
| . | . | PFS . | OS . | ||||
|---|---|---|---|---|---|---|---|
| Disease Status Group . | n=104 . | HR at 3 yr . | 95% CI . | p . | HR at 3 yr . | 95% CI . | p . |
| CP1 | 23 | 0.03 | 0.004–0.2 | 0.001 | 0.04 | 0.006–0.33 | 0.003 |
| CP2/AP1/CE | 59 | 0.3 | 0.1–0.5 | <0.001 | 0.3 | 0.2–0.7 | 0.001 |
| AP2/≥CP3/BC | 22 | 1.0 | 1.0 | ||||
Multivariate Analysis adjusting for age & disease status
| . | n=104 . | 3 y % KM . | HR . | p . | 3 y % KM . | HR . | p . |
|---|---|---|---|---|---|---|---|
| CP1 | 23 | 95% | 0.1 | 0.02 | 95% | 0.07 | 0.01 |
| not CP1/≤50 yrs | 49 | 52% | Reference | Reference | 55% | Reference | Reference |
| not CP1/>50 yrs | 32 | 33% | 1.7 | 0.1 | 33% | 1.8 | 0.07 |
CP = Chronic phase; AP = Accelerated phase; BC= Blast crisis; CE = clonal evolution; HR= Hazard ratio; KM = Kaplan Meier.
No relevant conflicts of interest to declare.

This icon denotes a clinically relevant abstract
Author notes
Asterisk with author names denotes non-ASH members.


This feature is available to Subscribers Only
Sign In or Create an Account Close Modal