Abstract
Abstract  600
600
Both MM and AL are plasma cell neoplasms. The underlying clone in both diseases appears to be different not only in terms of “tumor burden” but also in terms of their underlying biology. The overall “fitness” of patients with these two diseases is also different, with AL patients having more major organ dysfunction. Therapy for both diseases is directed at killing the underlying clone. ASCT is one method of reducing the clone size and thereby improving overall survival. Post-ASCT outcomes between the two diseases have never been formally compared.
We compiled all patients with a diagnosis of AL or MM who received ASCT at the Mayo Clinic Rochester between June 1996 and January 2011 to compare outcomes. Patients were retrieved from two prospectively maintained clinical transplant data bases (M.A.G.). Differences between groups were compared using Fisher's exact and Wilcoxon tests. Survival was calculated using the method of Kaplan-Meier, and differences between survival outcomes were calculated by log rank. Cox regression modeling was done to determine how non-disease specific variables—i.e. age, time period of ASCT, number of prior regimens, time to ASCT from diagnosis and acquisition of complete response (CR)—affected outcomes. All statistical analyses were performed using JMP (SAS, NC) software. This study was approved by the Mayo IRB.
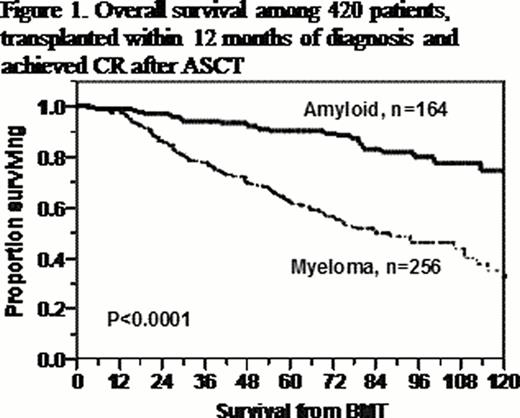
The data set was comprised of 454 patients with AL and 1116 patients with MM. There were significant differences between the two respective groups of patients in terms of number of prior regimens (0 vs 1, p<0.0001), time to ASCT (3.95 months vs 7.20 months, p<0.0001), intensity of conditioning regimen (non-attenuated in 69.4% vs 89.1%, p<0.0001), serum creatinine (1.1mg/dl vs 1mg/dl p<0.0001), creatinine clearance (72.5 ml/minute vs 80 ml/minute p<0.0001), albumin (2.61g/dl vs 3.50g/dl, p<0.0001) CRP (0.40mg/dl vs 0.63mg/dl p<0.0001), LDH (196 U/l vs 182U/l, p<0.0001), and bone marrow plasmacytosis at transplant (6% vs 9%, p<0.0001). Hematologic response rates were also significantly different between the groups, with higher overall hematologic response in the MM group (90.9% vs 79.5%, p<0.0001) and higher complete response (CR) rates (40.1% vs 29.4%, p<0.0001) in the AL group. With a median follow-up of surviving patients of 68 months, the respective median overall survival (OS) for the AL and MM patients was 113 and 59.5 months, p<0.0001. Notably, the 5-year OS of AL and MM patients achieving CR were 91.4% and 57.7%, respectively, p<0.0001. If only those patients who were transplanted within 1 year of their diagnosis are included in the analysis, the respective 5-year OS of AL and MM patients achieving CR were 90.4% and 61.3%, p<0.0001 (Figure 1). To correct for imbalances in non-disease specific parameters, 3 multivariate analyses were performed using: 1) all patients; 2) only those achieving CR; and 3) only those who achieved a CR and were transplanted within 12 months of their diagnosis (Table 1). Among those patients achieving CR, MM patients had nearly a 4-fold risk of death as compared to patients with AL.
Although ASCT is not available to all patients with either AL or MM, there is a significant difference in outcomes based on the diagnosis. Patients with AL who undergo ASCT enjoy a superior survival as compared MM patients undergoing the same procedure. This difference is most notable among those patients who achieve CR suggesting very different plasma cell biology between the two diseases.
Multivariate analyses
| Characteristic . | All pts (n=1570) . | CR pts, only (n=510) . | CR pts, ASCT within 12 mo. of Dx (n=420) . | |||
|---|---|---|---|---|---|---|
| RR (95%CI) . | p-value . | RR (95%CI) . | p-value . | RR (95%CI) . | p-value . | |
| No CR | 1.84 (1.55, 2.19) | <0.0001 | NA | NA | NA | NA |
| ASCT > 12 mo. from Dx | 1.20 (0.99, 1,45) | 0.06 | 1.74 (1.22, 2.44) | 0.003 | NA | NA |
| Age by decade | 1.17 (1.07, 1.27) | 0.0002 | 3.31 (1.42, 7.87) | 0.005 | 1.25 (1.03, 1.52) | 0.02 |
| MM vs AL | 1.38 (1.17, 1.64) | 0.02 | 3.98 (2.59, 6.39) | <0.0001 | 3.74 (2.38, 6.2) | <0.0001 |
| Number of prior regimens | 1.31 (1.19, 1.44) | <0.0001 | NS | NS | NS | NS |
| ASCT date range: 1996-2002; 2003-2006; 2007-2010 | 1.55 (1.20, 1.92) | <0.0001 | NS | NS | NS | NS |
No relevant conflicts of interest to declare.
Author notes
Asterisk with author names denotes non-ASH members.

This icon denotes a clinically relevant abstract


This feature is available to Subscribers Only
Sign In or Create an Account Close Modal