Abstract
Extranodal natural killer (NK)/T–cell lymphoma, nasal type (ENKTL) is an aggressive disease with a poor prognosis. A better risk stratification is beneficial for clinical management in affected patients. Our recent study has shown that fasting blood glucose (FBG) was a novel, prognostic factor, (Cai et al, British Journal of Cancer, 108: 380–386,2013). This finding has not been integrated in the previous prognostic models for ENKTL Therefore, we aimed to design a new prognostic model, including FBG, for ENKTL which supports to identify high–risk patients eligible for advanced or more aggressive therapy.
158 newly diagnosed patients with ENKTL were analyzed between January 2003 and January 2011 at Sun Yat–sen University Cancer Center, China. Overall survival (OS) and progression free survival (PFS) were estimated using the Kaplan–Meier method. The significance of differences between survival was tested using the Log–rank test. Significant variables in the univariate analysis were selected as variables for the multivariate analysis of survival. The latter was performed by the Cox regression mode. We constructed receiver operating characteristic (ROC) curves and compared the areas under the ROC curves of total protein (TP), FBG, Korean Prognostic Index (KPI) and their combinations in comparison to the survival outcome.
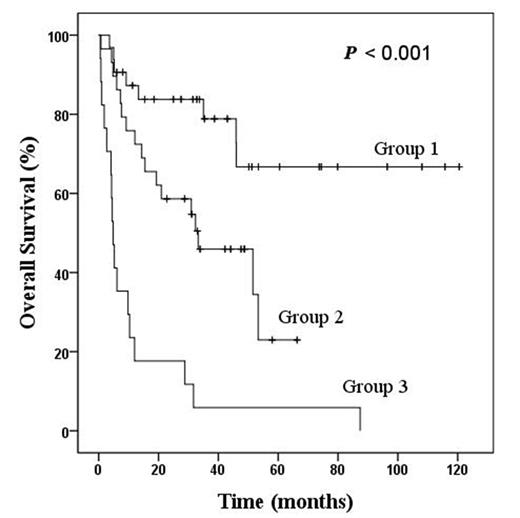
Of 158 patients, 156 patients had complete clinical information for the parameters of the International Prognostic Index (IPI) model and KPI model. The estimated 5–year overall survival rate in 158 patients was 59.2%. Independent prognostic factors included TP < 60 g/L, FBG > 100 mg/dL, KPI score ≥ 2. A new prognostic model was constructed by combining these prognostic factors: Group 1 (64 cases, 41.0%), no adverse factors; Group 2 (58 cases, 37.2%), one adverse factor; and Group 3 (34 cases, 21.8%), two or three adverse factors. The 5–year overall survival of these groups were 88.9%, 35.6% and 12.7%, respectively (p < 0.001). The survival curves according to the new prognostic model are shown in Fig. 1. The new model categorized three groups with significantly different survival outcomes. The new prognostic model was also efficient in discriminating the patients with low to low–intermediate risk IPI group and high–intermediate to high risk IPI group into three subgroups with different survival outcomes (p < 0.001). The KPI model balanced the distribution of patients into different risk groups better than IPI prognostic model (score 0: 12 cases, 7.7%; score 1: 38 cases, 24.4%; score 2: 42 cases, 26.9%; score 3–4: 64 cases, 41.0%), and it was able to differentiate patients with different survival outcomes (p < 0.001). In addition, the new prognostic model had a better prognostic value than did KPI model alone (p < 0.001), suggesting that TP and FBG reinforced the prognostic ability of KPI model (Table 1).
Overall survival based on the new prognostic index for patients with extranodal natural killer/T–cell lymphoma, nasal type.
Overall survival based on the new prognostic index for patients with extranodal natural killer/T–cell lymphoma, nasal type.
Comparison of area under the ROC, sensitivity and specificity by TP, FBG and KPI
| . | Sensitivity . | Specificity . | AUROCs . | p value . |
|---|---|---|---|---|
| New model | 40.5 (29.9–51.7) | 94.4 (86.4–98.5) | 0.75 (0.68–0.81) | |
| TP | 26.2 (17.2–36.9) | 100 (95.1–100) | 0.63 (0.58–0.68) | <0.001 |
| FBG | 38.1 (27.7–49.3) | 81.1 (70.3–89.3) | 0.59 (0.52–0.66 ) | <0.001 |
| KPI | 78.6 (68.3–86.8) | 44.4 (32.7–56.6) | 0.62 (0.54–0.69) | <0.001 |
ROC, receiver operating characteristic; AUROCs, areas under the ROC curves; TP, total protein; FBG, fasting blood glucose; KPI, Korean Prognostic Index.
The new prognostic model we proposed for ENKTL, including the new prognostic indicator total protein and FBG, demonstrated balanced distribution of patients into different risk groups with better prognostic discrimination as compared to KPI model alone.
No relevant conflicts of interest to declare.
Author notes
Asterisk with author names denotes non-ASH members.


This feature is available to Subscribers Only
Sign In or Create an Account Close Modal