Abstract
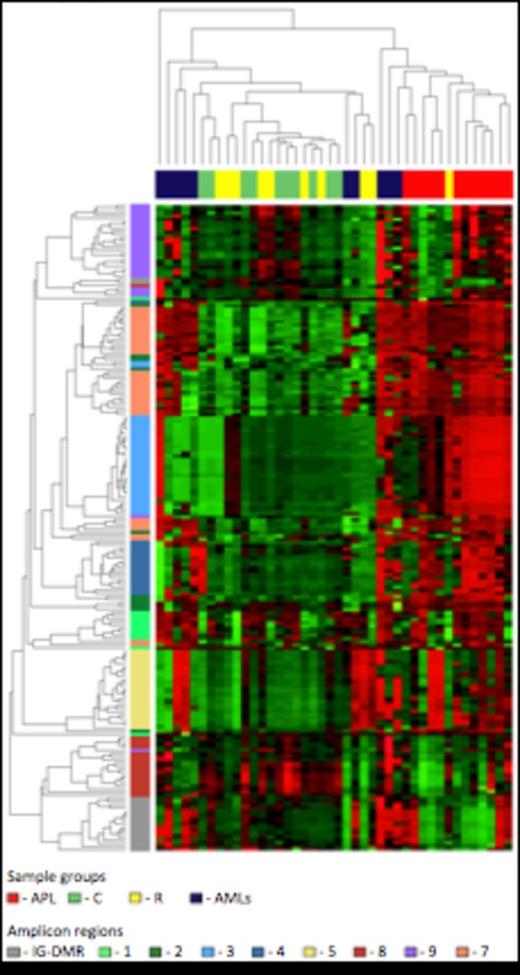
Unsupervised hierarchical cluster analysis of the CpG methylation levels. Each row represents a CpG site and each column a sample. The percentage of CpG methylation is depicted using color scales of red (CpG methylation > 50%) and green (CpG methylation < 50%). Sample group labels are indicated (APL; Control; Remission; AMLs).
Unsupervised hierarchical cluster analysis of the CpG methylation levels. Each row represents a CpG site and each column a sample. The percentage of CpG methylation is depicted using color scales of red (CpG methylation > 50%) and green (CpG methylation < 50%). Sample group labels are indicated (APL; Control; Remission; AMLs).
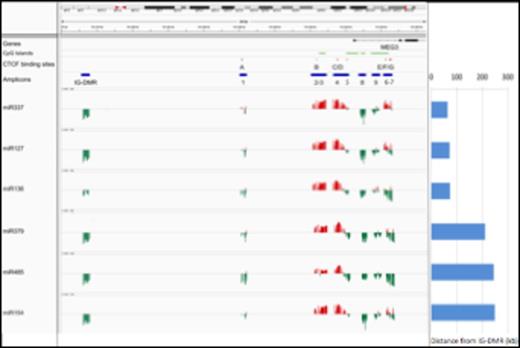
Correlation between DNA methylation levels and miRNAs expression. The expression of 14q32 miRNAs was correlated with the DNA methylation level at the DMRs. The position of CpG islands, CTCF binding sites (A-B-C-D-E-F-G) and amplicons is labeled with green, red and blue horizontal bars, respectively. Amplicons 1-9 reside in the MEG3-DMR. The correlation is represented with red and green vertical bars indicating positive and negative values, respectively.
Correlation between DNA methylation levels and miRNAs expression. The expression of 14q32 miRNAs was correlated with the DNA methylation level at the DMRs. The position of CpG islands, CTCF binding sites (A-B-C-D-E-F-G) and amplicons is labeled with green, red and blue horizontal bars, respectively. Amplicons 1-9 reside in the MEG3-DMR. The correlation is represented with red and green vertical bars indicating positive and negative values, respectively.
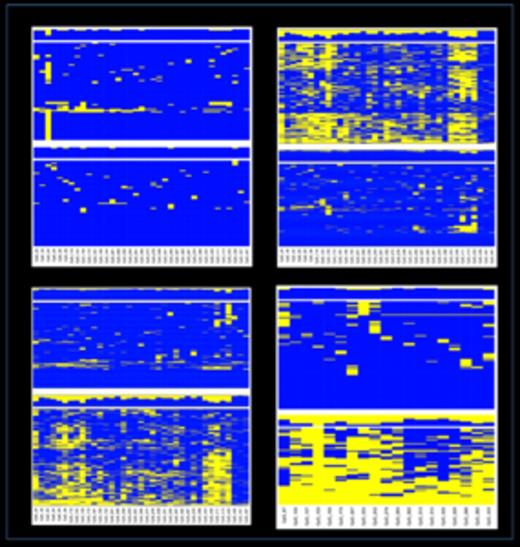
Haplotype analysis. The sequenced amplicons were interrogated using the available SNPs (UCSC database). When a heterozygous SNP was observed, sequence reads were separated accordingly to the SNP genotype and unsupervised cluster analysis performed on the allelic CpG methylation pattern. Allelic DNA methylation profiles at the MEG3-DMR: the diagnostic (A) and complete remission (B) stages of a patient with APL; (C) healthy donor. D) Allelic DNA-methylation profile at the IG-DMR, healthy donor. Each column represents a CpG site and each row the methylation pattern of a single sequence read. Blue, methylated; yellow not methylated.
Haplotype analysis. The sequenced amplicons were interrogated using the available SNPs (UCSC database). When a heterozygous SNP was observed, sequence reads were separated accordingly to the SNP genotype and unsupervised cluster analysis performed on the allelic CpG methylation pattern. Allelic DNA methylation profiles at the MEG3-DMR: the diagnostic (A) and complete remission (B) stages of a patient with APL; (C) healthy donor. D) Allelic DNA-methylation profile at the IG-DMR, healthy donor. Each column represents a CpG site and each row the methylation pattern of a single sequence read. Blue, methylated; yellow not methylated.
No relevant conflicts of interest to declare.
Author notes
Asterisk with author names denotes non-ASH members.


This feature is available to Subscribers Only
Sign In or Create an Account Close Modal