Abstract
The MLL5 gene encodes a histone methyltransferase implicated in positive control of several genes related to hematopoiesis. Its close relationship with retinoic acid–induced granulopoiesis suggests that the deregulated expression of MLL5 might lead acute promyelocytic leukemia (APL) blasts to become less susceptible to differentiation-inducing ATRA effects. Here, we retrospectively determined the MLL5 transcript levels in samples from APL patients enrolled in the International Consortium on Acute Promyelocytic Leukemia (IC-APL) trial and analyzed its relationship with clinical and laboratory features, hematologic recovery, relapse, and survival. The results of the IC-APL have been previously reported (Blood 2013, 121(11) pp: 1935). In brief, complete hematological remission (CR) was achieved by 153/180 patients enrolled in Brazil, Mexico, Chile and Uruguay and after a median follow up of 28 months, the 2-year cumulative incidence of relapse (CIR), overall survival (OS) and disease-free survival (DFS) were 4.5%, 80% and 91%, respectively.
Design and Methods
One hundred and twenty-one APL patients (age, 15-73y) from seven different Brazilian institutions and treated according to the IC-APL protocol were included. The treatment schedule was identical to that adopted in the PETHEMA/HOVON LPA2005 trial, except for the replacement of idarubicin by daunorubicin. ATRA treatment was initiated immediately in all cases in which the diagnosis of APL was suspected based on morphology. As normal controls, total bone marrow (BM, n=8) and peripheral blood (PB, n=101) cells from healthy donors (age, 18-60y) were collected and mononuclear cells were isolated by Ficoll-Hypaque density gradient centrifugation. Additionally, 28 CBF-leukemia samples were included. Gene expression profile was analyzed by real-time quantitative PCR using the ABL FusionQuant Standard Kit as an endogenous control. Based on the continuous distribution of MLL5/ABL expression on APL samples (Figure 1), we adopted the median value of MLL5/ABL expression as cut-off to dichotomize APL patients in “low” and “high” MLL5 transcript levels.
Results
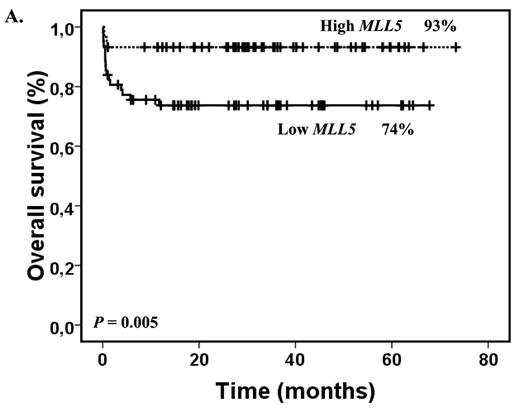
MLL5 expression was not different between APL, CBF-leukemia and healthy donors samples (Figure 1; P=0.19). There was no relevant difference between APL patients with low (n=62) and high (n=59) MLL5 transcript levels with respect to clinical and laboratory features, although high MLL5 transcript levels were more likely to be present in female gender (P=0.029). Overall, 102 (84%) achieved CR. Patients with low MLL5 transcript levels had significantly lower CR rate than patients with high MLL5 transcript levels (74% vs 95%; P=0.002). Twelve patients (10%) experienced early mortality (i.e., death during induction therapy) due to hemorrhage (n=6; 50%), disease progression (n=1; 8.3%), thrombosis (n=1; 8.3%), therapy-related infection (n=3; 25%) and differentiation syndrome (n=1; 8.3%); MLL5 transcript levels had no impact on early mortality (P=0.155). With a follow-up of 33 months among survivors (range, 1-72 months), patients with low MLL5 transcript levels had significantly lower 2-year OS (P=0.005) and 2-year DFS rate (P=0.037) than patients with high MLL5 transcript levels. Up to January 2013, a total of six relapses (5%) had been recorded. The 2-year CIR among patients with low and high MLL5 transcript levels was 14% (95%CI: 5% to 27%) and 2% (95%CI: 0.1% to 11%), respectively (P=0.04). We have further evaluated the prognostic impact of MLL5 transcript levels in those patients who remain alive after induction therapy (107 patients). Low MLL5 transcript levels were predictive of lower CR rate (P=0.042) and 2-year OS rate (P=0.009), but had no impact on DFS (P=0.106).
Conclusion
Our results show that MLL5 transcript levels may predict lower remission rate, short survival and higher risk of relapse in APL patients treated with ATRA and anthracycline-based chemotherapy. This is the first report describing the MLL5 expression as a prognostic factor in APL; nevertheless, our results should be confirmed in an independent cohort.
Quantitative analysis of MLL5 gene expression in samples from normal PB and BM, APL and CBF-leukemias. The horizontal bars represent the median value of MLL5 expression relative to ABL gene.
Quantitative analysis of MLL5 gene expression in samples from normal PB and BM, APL and CBF-leukemias. The horizontal bars represent the median value of MLL5 expression relative to ABL gene.
Overall survival (2A) and disease-free survival (2B) in APL patients according to MLL5 transcript levels.
Overall survival (2A) and disease-free survival (2B) in APL patients according to MLL5 transcript levels.
No relevant conflicts of interest to declare.
Author notes
Asterisk with author names denotes non-ASH members.


This feature is available to Subscribers Only
Sign In or Create an Account Close Modal