Abstract
The international prognostic score (IPS) (Hasenclever et al., NEJM 1988) uses 7 factors (age> 45, male sex, hemoglobin<10.5, stage IV, leukocytosis > 15,000, and lymphopenia< 600) to predict a 5 year freedom from progression (FFP) of 42%-84% and overall survival (OS) of 56%-89% for patients with advanced HL. Constructed from a retrospective analysis of patients treated before 1992, the IPS continues to be the most commonly used risk stratification index for advanced HL. Recent studies suggest that the predictive range of the IPS has narrowed due to improved outcomes of patients treated with current therapy (Moccia et al. JCO 2012). In this report we prospectively evaluated the ability of the individual components of the IPS to predict outcome in patients enrolled on the US Intergroup trial E2496.
All seven IPS (IPS-7) variables were recorded for all patients at study entry. FFP was defined as the time from study entry to disease progression or relapse; deaths that occurred during remission that were not preceded by disease progression/relapse were censored. OS was defined as the time from study entry to death from any cause. Kaplan-Meier methodology was used to construct survival curves. Univariate and multivariate analysis (MVA) was performed using Cox proportional-hazards models. We subsequently constructed an alternative prognostic score utilizing the factors which were significant on MVA (PS-3).
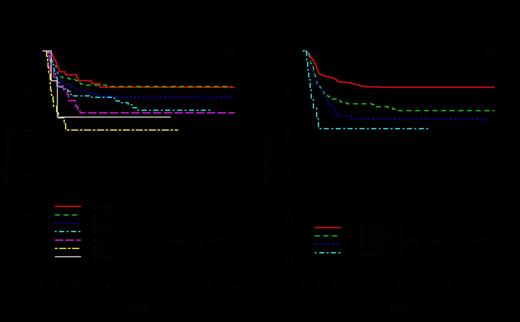
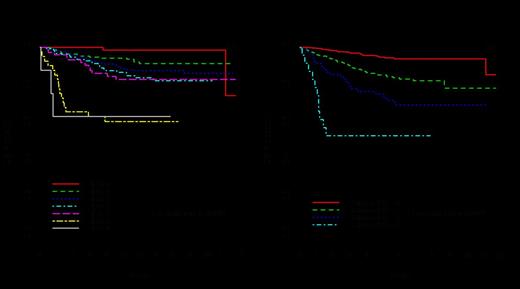
From 1996-2006, 854 patients with advanced HL, were randomized to treatment with either ABVD or Stanford V, with no significant differences in outcome (Gordon et al, JCO 2013). While the IPS-7 remained prognostic it did not stratify the lowest risk patients (0-1 risk factor) or patients with 3-5 risk factors, as its predictive range was narrowed due to improved clinical outcomes (Fig 1a and 2a). Table 1 shows the univariate and multivariate analysis for IPS-7 and outcomes. In contrast to the original IPS-7, on MVA, only two factors, hemoglobin and stage were significant for FFP, and three factors for OS: hemoglobin, stage, and age. We then evaluated a new 3 factor score (PS-3) utilizing variables significant on the MVA. The PS-3 was significant for both FFP (p=0.0001) and OS (p<.0001) and clearly separated patients into 4 distinct risk groups with either: 0, 1, 2 or 3 risk factors. The five year FFP was 83%, 74%, 68%, and 63% and OS was 95%, 85%, 75%, and 52% for patients with 0, 1, 2, and 3 risk factors, respectively (Table 2, Fig 1b and 2b).
5 Year FFP/OS by IPS-7
| . | . | FFP . | OS . | ||||||
|---|---|---|---|---|---|---|---|---|---|
| . | . | Univariate Analysis . | Multivariate Analysis . | Univariate Analysis . | Multivariate Analysis . | ||||
| IPS factor | Number of patients (%) | HR(95% CI) | p-value | HR(95% CI) | p-value | HR(95% CI) | p-value | HR(95% CI) | p-value |
| Age≥45 years | 157 (18%) | 1.3 (0.9-1.8) | 0.15 | 1.2 (0.9-1.8) | 0.27 | 4.0 (2.7-5.9) | <0.0001 | 3.7 (2.5-5.5) | <0.0001 |
| Albumin<4g/dl | 566 (66%) | 1.0 (0.7-1.4) | 0.92 | 0.8 (0.6-1.1) | 0.21 | 1.6 (1.0-2.5) | 0.04 | 1.3 (0.8-2.1) | 0.31 |
| WBC≥15,000 mm3 | 110 (13%) | 1.3 (0.9-2.0) | 0.20 | 1.3 (0.8-1.9) | 0.28 | 1.1 (0.7-2.0) | 0.64 | 1.2 (0.7-2.1) | 0.52 |
| Hgb<10.5g/dl | 145 (17%) | 1.8 (1.3-2.6) | 0.0003 | 1.7 (1.2-2.5) | 0.004 | 2.8 (1.9-4.2) | <0.0001 | 2.1 (1.3-3.3) | 0.002 |
| Lymph count<600 mm3 or<8% of WBC | 169 (20%) | 1.3 (1.0-1.9) | 0.08 | 1.2 (0.8-1.7) | 0.29 | 1.2 (0.7-1.9) | 0.48 | 1.0 (0.6-1.6) | 0.91 |
| Male | 444 (52%) | 1.1 (0.8-1.5) | 0.55 | 1.1 (0.8-1.5) | 0.55 | 1.1 (0.8-1.6) | 0.57 | 1.1 (0.7-1.6) | 0.68 |
| Stage IV | 206 (24%) | 1.7 (1.3-2.4) | 0.0005 | 1.5 (1.1-2.1) | 0.02 | 2.3 (1.6-3.4) | <0.0001 | 1.7 (1.1-2.5) | 0.02 |
5 Year FFP/OS by PS-3
| PS-3 . | # of patients . | % . | 5-year FFP . | 5-year OS . |
|---|---|---|---|---|
| 0 | 474 | 56 | 83 ± 2 | 95 ± 1 |
| 1 | 275 | 32 | 74 ± 3 | 85 ± 2 |
| 2 | 82 | 10 | 68 ± 5 | 75 ± 5 |
| 3 | 23 | 3 | 63 ± 10 | 52 ± 10 |
| Log rank test p-value | 0.0001 | <0.0001 |
| PS-3 . | # of patients . | % . | 5-year FFP . | 5-year OS . |
|---|---|---|---|---|
| 0 | 474 | 56 | 83 ± 2 | 95 ± 1 |
| 1 | 275 | 32 | 74 ± 3 | 85 ± 2 |
| 2 | 82 | 10 | 68 ± 5 | 75 ± 5 |
| 3 | 23 | 3 | 63 ± 10 | 52 ± 10 |
| Log rank test p-value | 0.0001 | <0.0001 |
In E2496, for patients with advanced HL, the PS-3 may stratify patients more clearly compared to IPS-7 and provide a simpler model to assess risk. Studies comparing PS-3 with IPS-7, and are ongoing. The incorporation of novel biomarkers and biologic factors into PS-3, as well as validation with other data sets is warranted.
No relevant conflicts of interest to declare.
Author notes
Asterisk with author names denotes non-ASH members.


This feature is available to Subscribers Only
Sign In or Create an Account Close Modal