Abstract
FLT3, PIM1, PIM2 and CXCR4 are proteins implicated in the signal transduction of the regulation of proliferation, differentiation and survival of hematopoietic stem cells, at different levels. The impairing of these three processes, regulated by these molecules, constitutes the main hallmark of Acute Myeloid Leukemia (AML).
The objectives of this work were to evaluate the expression level of the genes that codify such proteins in patients with AML; as well as correlate this level of expression with biological variables at diagnosis and survival.
peripheral blood or bone marrow samples from 31 healthy subject (HS) and 92 AML patients at diagnosis between 2004 and 2012 were studied. The median follow up was 14 months (69% of patients had died). We quantified the expression of FLT3, PIM1 and 2, and CXCR4 by real time PCR, employing primer pairs designed in our laboratory to amplify all known protein-coding transcripts; highlighting the presence of a 30.4% FLT3 ITD, 5.4% of other FLT3 mutations and 26% of NMP1 mutations. Results were then analyzed with the statistical package IBM“ SPSS” Statistics, v20 (IBM“, Nueva York).
FLT3 was overexpressed in AML patients (FLT3 expression: controls 0.99 vs patients 36.97; p<0.001). Table 1 summarizes gene expression level according to presence of FLT3-ITD and other FLT3 and NPM1 mutations. It was noted that NPM1 mutations were associated with lower expression of PIM1 (NPM1+: Log PIM1 1.09 vs NPM1-: Log PIM1 1.38; p=0.046) and PIM2 (NPM1+: PIM2 10.09 vs NPM1-: PIM2 24.48; p <0.01). No significant differences in gene expression level were seen in relation to the presence of FLT3-ITD, with the exception of lower expression of PIM2 (FLT3-ITD: PIM2 10.71 vs No FLT3-ITD: PIM2 24.47; p=0.001). But in the case of other FLT3 mutations, FLT3 expression was higher (FLT3 mutations: FLT3 expression 88.33 vs No FLT3 mutations: FLT3 expression 34.02; p=0.006) and PIM1 was lower (FLT3 mutations: LogPim1 0.79 vs No FLT3 mutations: LogPIM1 1.34; p=0.049). PIM1 was expressed as controls (90.25 controls vs 55.73 patients; p=0.26); however PIM2 and CXCR4 were underexpressed (PIM2 controls 110.19 vs patients 20.73; p<0.01), (CXCR4 controls 1251.54 vs. patients 99.03; p<0.01). We found a correlation between PIM2 and CXCR4(r=0.9; p<0.01) and the LogPIM1 and PIM2 (r=0.775; p<0.01).
We observed a higher expression of PIM2 in secondary AML (PIM2 35.17 vs. 17.8; p=0.01) and lower PIM2 expression in the intermediate genetic risk group (low risk 25.51, intermediate risk 14.7 and high risk 33.28; p=0.015). CXCR4 had lower expression in the intermediate cytogenetic risk group (low risk 113.31, intermediate risk 65.2, high risk 146.94; p=0.041) (Table 2). No differences in gene expression were noted in relation to chemotherapy response level. We studied differences in gene expression between granulocytes and blast cells from 19 samples, finding a marked tendency to higher FLT3 expression (FLT3 blasts 35.26 vs FLT3 granulocytes 17.98; p=0.062) and lower PIM1 (PIM1 blasts 69.14 vs PIM1 granulocytes 206.88; p=0.130), PIM2 (PIM2 blasts 26.25 vs PIM2 granulocytes 107.39; p=0.182) and CXCR4 (CXCR4 blasts 188.96 vs CXCR4 granulocytes 420.28; p=0.186) expression in blast cells. The gene expression was clearly different, but not statistically significant, probably due to the limited number of samples studied.
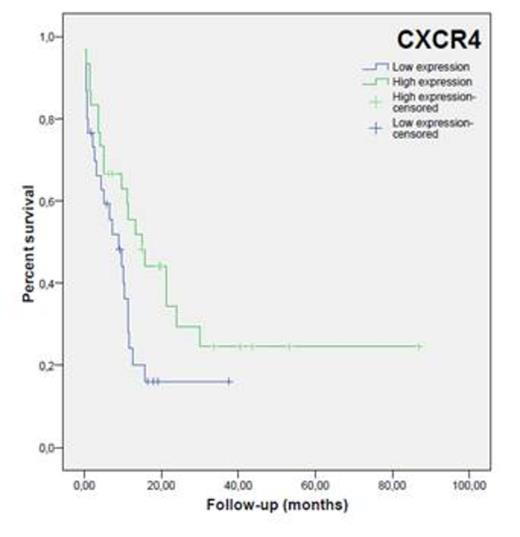
Gene expression variable was categorized as high expression above median and low expression below median. High expression of FLT3 was associated with a tendency to reach higher survival (p=0.146). Patients with CXCR4 low expression level had a lower survival (p= 0.045) (Fig.1). Also PIM2 overexpression –defined as a expression level over 75 percentile- was associated with a slightly lower survival.
The deregulated expression of FLT3, PIM1, PIM2 and CXCR4 relates to differential characteristics of certain AML groups and has prognostic implications. It is noteworthy that CXCR4 overexpression seems to be associated with higher survival in AML patients. All these results must be confirmed with future studies including a greater number of samples.
No relevant conflicts of interest to declare.
Author notes
Asterisk with author names denotes non-ASH members.


This feature is available to Subscribers Only
Sign In or Create an Account Close Modal