Key Points
Elavl1 is a protein that binds to the 3′-UTR of RNA encoding Gata1.
Elavl1 controls embryonic erythropoiesis by enhancing expression of Gata1.
Abstract
The RNA-binding protein Elavl1 (also known as HuR) regulates gene expression at the posttranscriptional level. Early embryonic lethality of the mouse knockout challenges investigation into hematopoietic functions for Elavl1. We identified 2 zebrafish elavl1 genes, designated elavl1a (the predominant isoform during embryogenesis) and elavl1b. Knockdown of Elavl1a using specific morpholinos resulted in a striking loss of primitive embryonic erythropoiesis. Transcript levels for early hematopoietic regulatory genes including lmo2 and scl are unaltered, but levels of gata1 transcripts, encoding a key erythroid transcription factor, are significantly reduced in elavl1a morphants. Other mesoderm markers are mostly unchanged by depletion of Elav1a. The 3′–untranslated region (UTR) of gata1 contains putative Elavl1a-binding sites that support robust expression levels when fused to a transfected luciferase reporter gene, and Elavl1a binds the gata1 3′-UTR sequences in a manner dependent on these sites. Moreover, expression of a transgenic reporter specifically in developing embryonic erythroid cells is enhanced by addition of the gata1 3′UTR with intact Elavl1-binding sites. Injection of gata1 messenger RNA partially rescues the erythropoiesis defect caused by Elavl1 knockdown. Our study reveals a posttranscriptional regulatory mechanism by which RNA-binding protein Elavl1a regulates embryonic erythropoiesis by maintaining appropriate levels of gata1 expression.
Introduction
During vertebrate embryogenesis, 2 sequential waves of hematopoiesis occur; they are termed primitive and definitive. In zebrafish, primitive erythropoiesis initiates in the intermediate cell mass in posterior lateral mesoderm, giving rise to erythrocytes and macrophages before 1 day postfertilization (dpf), followed by definitive hematopoiesis when stem/progenitors are produced from hemogenic endothelium in the ventral wall of the dorsal aorta. At the time of primitive erythroid cell generation, lymphocytes and granulocytes arise from an anterior lateral mesoderm domain. After 2 dpf, a major niche for hematopoiesis is present in caudal hematopoietic tissue in the tail. Eventually, the kidney serves as the major site of hematopoiesis through adulthood in the zebrafish.1
Gata1 is a key transcription factor that is essential for blood cell development. In addition to controlling cell survival and proliferation, Gata1 directly binds to and activates expression of erythroid-specific globin genes, the erythropoietin receptor, and its own promoter.2-4 Knockout of Gata1 in the mouse leads to embryonic lethality due to severe yolk sac anemia, consistent with a loss of primitive erythropoiesis.5 A zebrafish gata1 mutant has normal expression levels for markers of hematopoietic stem/progenitor, myeloid, and lymphoid cells, but a complete loss of erythroid gene expression through 24 hours postfertilization (hpf).6
RNA-binding proteins (RBPs) are recognized to play key regulatory roles in development, including hematopoiesis. Several RBPs bind AU-rich elements (AREs) in the 3′–untranslated region (UTR), which are present in ∼5% to 8% of mammalian transcripts.7 Several distinct RBPs have been identified, including ARE-binding factor-1 (AUF1), embryonic lethal and abnormal vision (ELAV) family members, ZFP36 family members, and KH-type splicing regulatory protein (KHRP). AUF1 has 4 distinct isoforms (p37, p40, p42, and p45) and regulates many genes that are involved in hematopoiesis, for example, Bcl2 and Il8.8,9 Knockout of all 4 AUF1 isoforms in mice leads to reduced numbers of splenic T and B cells, suggesting that AUF1 has an important role in lymphopoiesis.10 KSRP can also regulate many hematopoietic target genes, including Cxcl2,Cxcl3,Il6, and Tlr4.11 Recently, analysis of Zfp36L2 knockout mice showed the critical role of this RBP in self-renewal of erythroid progenitors.12 These studies indicate that posttranscriptional gene regulatory mechanisms are important in hematopoiesis.
The ELAV family contains 4 members, the ubiquitously expressed Elavl1 (HuR, HuA), and neuronal Elavl2 (HuB), Elavl3 (HuC), and Elavl4 (HuD). Recently, ELAVL4 was also shown to be expressed in pancreatic β cells and to regulate the translation of insulin.13 Elavl1 has been shown to play an essential role in embryonic development and stem/progenitor cell survival in adult mice.14,15 Hematopoietic and intestinal progenitors were significantly depleted in Elavl1−/− conditionally deleted mice due to a p53-dependent cell death program.14 During embryonic development, Elavl1−/− embryos appeared normal at day 8.5; however, embryos could not survive beyond embryonic day 14.5 (E14.5).15 At E10.5 to E12.5, knockout embryos exhibited defects in placental development. We showed recently that knockdown of elavl1 during zebrafish embryogenesis generates defects in angiogenesis of the subintestinal vein plexus, consistent with its role in regulation of vascular endothelial growth factor-A expression.16 However, the function of elavl1 in embryonic hematopoietic development has not been characterized, in part due to the early embryonic lethality of the mouse knockout. Here, we used the zebrafish model to evaluate functional roles of elavl1 during embryonic blood development. We report that elavl1 regulates gata1 expression at the posttranscriptional level and thereby promotes embryonic erythropoiesis.
Materials and methods
Zebrafish maintenance
Wild-type and p53−/− mutant zebrafish17 were maintained at 28.5°C. Embryos were collected from adult fish after natural matings and staged as described.18 All animal studies were approved by the Weill Cornell Medical College Animal Care and Use Committee. Morpholinos were injected at the 1-2 cell stage and were either translation-blocking (Mo1: 5′-TGTGGTCTTCGTAACCGTTCGACAT) or splice-blocking (Mo2: 5′-AGAGCACCTTATGTCACATTACCTT).
Whole-mount in situ hybridization
Whole-mount in situ hybridization was performed using single-stranded RNA probes labeled with digoxigenin-uridine 5-triphosphate (Roche) essentially as described.19 The gata1,lmo2,scl,myod,nkx2.5, and pax2a riboprobes were synthesized and hybridized as described.20 Briefly, fixed and staged embryos were washed in phosphate-buffered saline with Tween 20 for 5 minutes and prehybridized for 3 hours, followed by hybridization with the indicated probe overnight. After a series of stringent washes, embryos were blocked in 2% bovine serum albumin, 1% fetal bovine serum saline buffer, incubated with alkaline phosphatase-conjugated antibody overnight, and stained with BCIP/NBT (5-bromo-4-chloro-3-indolyl-phosphate/nitro blue tetrazolium) substrate (Roche).
Cell culture
The mouse erythroleukemia (MEL), HEK293, and HEK293T cell lines were maintained in Dulbecco modified Eagle growth medium containing high glucose (4.5 g/L) (Sigma-Aldrich), L-glutamine, 10% FBS, and 1× antibiotics (Invitrogen). Cells were cultured at 37°C in a humidified atmosphere containing 5% CO2.
RT-PCR and quantitative real-time PCR
First-strand complementary DNA (cDNA) synthesis was performed using the Omniscript Synthesis System for reverse transcription–polymerase chain reaction (RT-PCR) (Qiagen). Primers (forward: 5′-GAGTCTCTTCAGCAGCATTGG; reverse: 5′-CCTGATGCCTGATCAAC) were used for amplification of total elavl1a and elavl1b cDNA. For quantitative RT-PCR (qPCR), the cDNA was mixed with SYBR Green Mix (Quanta) and product measured using an ABI 7500 real-time PCR machine (Applied Biosystems). Each sample was prepared in triplicate, and all experiments were repeated 3 times. The cycle threshold values were determined using the 2ΔΔT method.21
Whole-mount immunohistochemistry
Zebrafish embryos were fixed overnight in 4% paraformaldehyde and processed for whole-mount immunohistochemistry with anti-ELAVL1 antibody (Clonegene), and then incubated with horseradish peroxidase–conjugated secondary antibody (KPL). Bright-field images were captured using a Zeiss Axioscope2 microscope with an AxioCam digital camera or with a dissecting microscope (Olympus).
Western blotting
Zebrafish embryos were deyolked or directly lysed in radioimmunoprecipitation assay buffer on ice for at least 30 minutes. Protein concentrations of each sample were measured using a BCA kit (Thermo Scientific). Protein (15 μg) was electrophoresed in a 10% sodium dodecyl sulfate–polyacrylamide gel electrophoresis gel. Protein was transferred to polyvinylidene diflouride membranes (Millipore) and immunoblotted with anti-human ELAVL1 monoclonal antibody (1:5000; Clonegene or Santa Cruz Biotechnology), anti-β-Actin monoclonal antibody (1:5000; Sigma-Aldrich), or anti-human GATA1 polyclonal antibody (1:5000; Abcam) for at least 1 hour at room temperature or 4°C overnight. Horseradish peroxidase–conjugated goat anti-mouse or anti-rabbit secondary antibody (KPL) was added and signal developed in enhanced chemiluminescence solution (Millipore).
Immunoprecipitation
Cell lysates were precleared with Sepharose beads (GE Healthcare) and incubated with anti-ELAVL1 antibody (Clonegene or Santa Cruz Biotechnology)–conjugated agarose beads overnight. The beads were washed twice with 0.1% Triton X-100 in phosphate-buffered saline, then boiled with sample loading buffer for western blotting. The binding of Elavl1 with gata1 messenger RNA (mRNA) was measured by immunoprecipitation followed by qPCR as described.22 Transfected HEK293 cells or MEL cells were lysed with polysome lysis buffer (100 mM KCl, 5 mM MgCl2, 10 mM HEPES (N-2-hydroxyethylpiperazine-N′-2-ethanesulfonic acid), 0.5% Nonidet P-40, 10 μM dithiothreitol) supplemented with RNase and protease inhibitors. The supernatant was incubated overnight at 4°C with no antibody, control immunoglobulin G (IgG), or anti-Elavl1 monoclonal antibody (Clonegene or Santa Cruz Biotechnology) and then incubated with protein G Dynabeads (25 μL) for 4 hours at 4°C. After washing 5 times, the pellet was treated with 10 units of DNAse I (Promega) in 100 μL of buffer for 10 minutes at 37°C, and then treated with 5 μg of proteinase K (Roche) in 100 μL of buffer for 30 minutes at 55°C. The supernatant was collected and RNA extracted using acid phenol chloroform (Ambion). Extracted RNA was subjected to qPCR analysis.
Luciferase reporter assays
PCR products of mouse Gata1 or zebrafish gata1 3′-UTR fragments were amplified from full-length cDNA constructs (OpenBiosystems) and then subcloned into the pmir-glo vector (Promega), a dual luciferase (Firefly and Renilla) reporter. Mutations were introduced in the predicted Elavl1-binding sites using the QuickChange II kit (Agilent) using the following primers: site I, 5′-GTAAATTATGTTGTACACACGCGCCGGCGCCCTCAATAAATGCATCC and 5′-GGATGCATTTATTGAGGGCGCCGGCGCGTGTGTACAACATAATTTAC; site II, 5′-CTCAATAAATGCATCCCGTCCTGCGCGCGTTGAAAGAGATGCATTAAAGC and 5′-GCTTTAATGCATCTCTTTCAACGCGCGCAGGACGGGATGCATTTATTGAG; site III, 5′-GAAACTGTGAGCTATATCGCGCGAATGTAAATATTGATG and 5′-CATCAATATTTACATTCGCGCGATATAGCTCACAGTTTC. Vectors, with or without elavl1a morpholino (MO), were injected into 1-cell stage embryos. For some experiments, the reporter was placed under regulation of the 5-kb upstream gata1 promoter sequence. After 24 hours, 10 to 20 embryos were collected as 1 sample and luciferase activity was measured in lysates using a luminometer (Promega). Firefly luciferase values were normalized with Renilla luciferase values and for each experiment “n” was at least 3 samples. At least 3 replicates were tested per experiment.
Statistics
Data are expressed as means ± SEM. Statistical significance was determined by the 2-tailed unpaired Student t test or χ2 test with Prism software. For the rescue experiment in Figure 2, the statistical analysis used each of the 4 criteria as a degree of freedom in χ2 analysis. Thus, we did not require an embryo to be fully rescued along all 4 characteristics, and an embryo rescued for even 1 of the characteristics was scored as a rescue.
Results
Elavl1a regulates zebrafish embryonic development
ELAVL1 is highly conserved in vertebrates, and by protein-homology comparison in the ENSEMBL database, 2 zebrafish Elavl1 orthologs were clearly identified (supplemental Figure 1, available on the Blood Web site), encoded by genes we designated elavl1a and elavl1b. Predicted protein sequence analysis showed that both orthologs are highly related, with Elavl1a and Elavl1b 85% and 82% similar to the human protein, respectively. Genomic structures of the zebrafish elavl1a and human ELAVL1 genes also show high conservation (supplemental Figure 2). Like the human gene, zebrafish elavl1a has 6 exons, with the coding region starting within exon 2, and lengths of exons 3 to 5 are identical (exon 3: 104 bp, exon 4: 154 bp, exon 5: 226 bp). In contrast, zebrafish elavl1b is encoded by 8 exons, with the open reading frame initiating from exon 4. Therefore, zebrafish elavl1a is more similar to human ELAVL1. The zebrafish genome contains distinct (single copy) genes for elavl2, elavl3, and elavl4 that are also highly conserved among vertebrates.
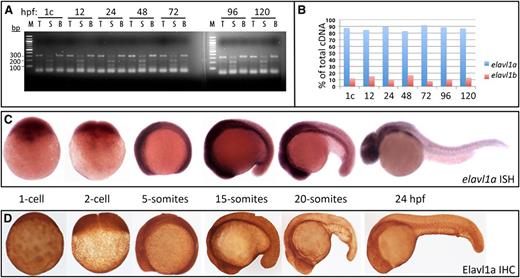
We quantified the relative transcript levels derived from each of the 2 zebrafish elavl1 genes during embryogenesis, by designing a single pair of PCR primers that amplify cDNA derived from both genes. Restriction enzyme polymorphisms were then used to distinguish the relative contribution of each gene to the total cDNA pool.23 Semiquantitative RT-PCR experiments demonstrated that elavl1a represents the major expressed isoform, constituting 80% to 90% of total elavl1 transcripts throughout early embryogenesis, from the 1-cell stage until 120 hpf (Figure 1A-B). Given that elavl1a has a more conserved genomic structure and predominates for expression during embryonic development, we focused our functional studies on this gene. In situ hybridization experiments confirmed that elavl1a transcripts are deposited maternally and expressed widely during early stages of embryogenesis (Figure 1C).
Elavl1a is the major isoform expressed during zebrafish embryogenesis. (A) A 322-bp fragment of cDNA derived from both elavl1a and elavl1b mRNA (total, T) was amplified from embryos harvested from the 1-cell (1c) stage to 120 hpf embryos, as indicated, and digested by Sca1 (S) or Bfa1 (B) restriction enzymes, which recognize polymorphisms specific to each gene. The elavl1a cDNA is cut into 120- and 200-bp fragments by Sca1, whereas elavl1b cDNA is cut into 100-bp and 220-bp fragments by Bfa1. (B) Quantification of elavl1a and elavl1b relative transcript abundance according to the data in panel A. (C) Representative embryos are shown at different embryonic stages as indicated, following in situ hybridization with the elavl1a antisense probe. No signal was detected using a control sense probe (not shown). (D) Representative embryos are shown following immunohistochemistry of Elavl1 protein at approximately the same stages. All are lateral views, other than 1- to 2-cell stages with anterior to the left. For both ISH and IHC, n > 20 embryos per sample. IHC, immunohistochemistry; ISH, in situ hybridization.
Elavl1a is the major isoform expressed during zebrafish embryogenesis. (A) A 322-bp fragment of cDNA derived from both elavl1a and elavl1b mRNA (total, T) was amplified from embryos harvested from the 1-cell (1c) stage to 120 hpf embryos, as indicated, and digested by Sca1 (S) or Bfa1 (B) restriction enzymes, which recognize polymorphisms specific to each gene. The elavl1a cDNA is cut into 120- and 200-bp fragments by Sca1, whereas elavl1b cDNA is cut into 100-bp and 220-bp fragments by Bfa1. (B) Quantification of elavl1a and elavl1b relative transcript abundance according to the data in panel A. (C) Representative embryos are shown at different embryonic stages as indicated, following in situ hybridization with the elavl1a antisense probe. No signal was detected using a control sense probe (not shown). (D) Representative embryos are shown following immunohistochemistry of Elavl1 protein at approximately the same stages. All are lateral views, other than 1- to 2-cell stages with anterior to the left. For both ISH and IHC, n > 20 embryos per sample. IHC, immunohistochemistry; ISH, in situ hybridization.
When the zebrafish protein was expressed in HEK293 cells, monoclonal anti-ELAVL1 antibodies generated against the human protein specifically cross-reacted with the zebrafish Elavl1a protein, according to western blotting analysis (supplemental Figure 3A). Using this antibody, whole-mount immunostaining was performed with zebrafish embryos, which confirmed that Elavl1 is expressed maternally and then ubiquitously through 120 hpf of development (Figure 1D). There was general concordance between RNA and protein expression patterns.
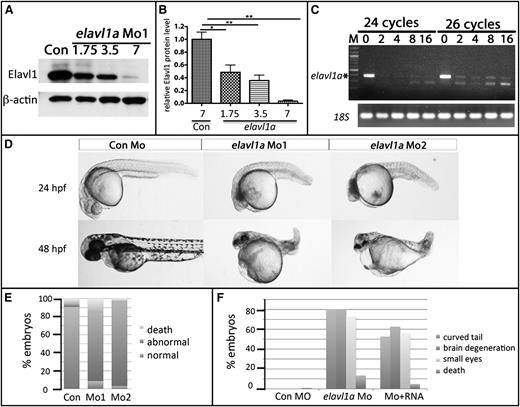
To determine whether elavl1a plays a role in zebrafish embryonic development, 2 MOs were designed and validated to specifically target the elavl1a gene including a translational blocking MO (Mo1) and a splice-blocking MO (Mo2), as indicated in supplemental Figure 2A. Using the cross-reacting antibody, we confirmed the efficacy of both Mo1 and Mo2, finding that 7 to 8 ng effectively eliminates the targeted protein expression, while 3.5 ng reduces expression levels to around 40% of controls (Figure 2A-B). Mo2 effectively blocked the generation of properly spliced RNA product (Figure 2C). To avoid potential off-targeting effects using higher concentrations, we used 4 ng of MO for subsequent experiments, which reproducibly achieves a knockdown of >50%. Our previous study16 reported angiogenesis phenotypes at 72 hpf. Here, we show that at 24 hpf, embryos injected with 4 ng of elavl1 Mo1 (373 of 408 embryos, 91%) or Mo2 (130 of 134 embryos, 97%) showed a general developmental delay, curved tails, neural defects including small eyes, and pericardial edema; the fish failed to survive beyond 5 dpf (Figure 2D-E). As a further test for whether these phenotypes were specifically induced by loss of Elavl1, mRNA encoding mouse ELAVL1, which does not contain the MO-binding site (75 pg per embryo), was coinjected with 4 ng of elavl1a Mo1, and this partially rescued defective development (χ2, P < .001, Figure 2F). The embryos were never rescued for all aspects of development, although this could be due to technical challenges in the rescue assay. These experiments indicate that elavl1a is essential for early zebrafish development.
Knockdown of Elavl1a disrupts normal embryonic development. (A) Representative western blotting analysis of lysates derived from zebrafish embryos injected with 7 ng of control MO (Con) or those injected with increasing doses of elavl1a Mo1. Cell lysates were prepared at 24 hpf. (B) Quantification of elavl1a Mo1 knockdown efficiency based on western blotting data; results were averaged from 3 independent experiments. Error bars represent SD. *P < .05; **P < .001. (C) Semiquantitative RT-PCR demonstrates efficacy of elavl1a splicing MO (Mo2) knockdown. Amplifications were for 24 or 26 cycles. 18S RNA was measured as control. (D) Embryos that had been injected at the 1-cell stage with 4 ng of control MO are normal, whereas those injected with either Mo1 or Mo2 are defective and grossly similar at 24 hpf and 48 hpf. (E) Quantification of embryos showing characteristic developmental defects (as in panel D) caused by either of the 2 MOs. (F) Quantification of embryonic defects in embryos injected with control (Con) MO, elavl1a MO, or coinjected with elavl1a MO and murine Elavl1 mRNA. (B-F) The results are compiled from several independent experiments with n > 150.
Knockdown of Elavl1a disrupts normal embryonic development. (A) Representative western blotting analysis of lysates derived from zebrafish embryos injected with 7 ng of control MO (Con) or those injected with increasing doses of elavl1a Mo1. Cell lysates were prepared at 24 hpf. (B) Quantification of elavl1a Mo1 knockdown efficiency based on western blotting data; results were averaged from 3 independent experiments. Error bars represent SD. *P < .05; **P < .001. (C) Semiquantitative RT-PCR demonstrates efficacy of elavl1a splicing MO (Mo2) knockdown. Amplifications were for 24 or 26 cycles. 18S RNA was measured as control. (D) Embryos that had been injected at the 1-cell stage with 4 ng of control MO are normal, whereas those injected with either Mo1 or Mo2 are defective and grossly similar at 24 hpf and 48 hpf. (E) Quantification of embryos showing characteristic developmental defects (as in panel D) caused by either of the 2 MOs. (F) Quantification of embryonic defects in embryos injected with control (Con) MO, elavl1a MO, or coinjected with elavl1a MO and murine Elavl1 mRNA. (B-F) The results are compiled from several independent experiments with n > 150.
Elavl1a regulates erythropoiesis
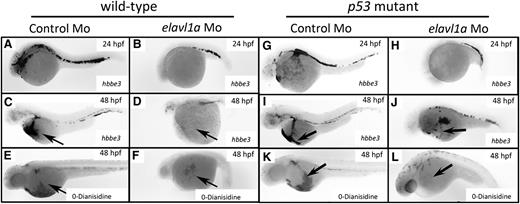
Visual inspection suggested that blood cells were markedly reduced or absent in the circulation of elavl1a morphants. We therefore evaluated hematopoiesis in these embryos. Indeed, the morphants had significantly decreased levels of globin transcripts and hemoglobin as shown by in situ hybridization for hbbe3 at 24 or 48 hpf and o-Dianisidine staining for hemoglobin at 48 hpf (Figure 3A-F). The difference was more pronounced at 48 hpf in the morphant, indicating that the defect in erythropoiesis was not due simply to developmental delay. Morphants coinjected with elavl1a mRNA were also stained for globin transcripts and hemoglobin at 48 hpf, as shown by representative samples in supplemental Figure 4. While few of the MO-injected embryos showed substantial staining, this was increased to 55% or 83% of the embryos (for hemoglobin or globin RNA, respectively) when elavl1a mRNA was coinjected. We used a gata1:dsRed transgenic line to purify erythroid cells by flow cytometry from batches of wild-type or morphant embryos, followed by cytospin to evaluate blood morphology. Erythroid cells, which are far fewer in the morphant embryos, appear relatively large and immature compared with wild type, as shown by representative images in supplemental Figure 5.
Erythropoiesis is defective in elavl1a morphants, regardless of p53 status. Whole-mount in situ hybridization was performed detecting hbbe3 transcripts at 24 hpf (A-B) or 48 hpf (C-D). Shown are representative embryos injected with elavl1a MO that displayed reduced hbbe3 transcript levels (27 of 33), compared with normal controls (38 of 40). (E-F) o-Dianisidine staining was used to detect hemoglobinized cells at 48 hpf. The representative elavl1a morphants show strikingly reduced hemoglobin staining (40 of 46), compared with normal embryos injected with control MO (60 of 60). (G-L) The same analyses were carried out using p53−/− embryos. All embryos are oriented lateral with anterior to the left.
Erythropoiesis is defective in elavl1a morphants, regardless of p53 status. Whole-mount in situ hybridization was performed detecting hbbe3 transcripts at 24 hpf (A-B) or 48 hpf (C-D). Shown are representative embryos injected with elavl1a MO that displayed reduced hbbe3 transcript levels (27 of 33), compared with normal controls (38 of 40). (E-F) o-Dianisidine staining was used to detect hemoglobinized cells at 48 hpf. The representative elavl1a morphants show strikingly reduced hemoglobin staining (40 of 46), compared with normal embryos injected with control MO (60 of 60). (G-L) The same analyses were carried out using p53−/− embryos. All embryos are oriented lateral with anterior to the left.
ELAVL1 can regulate p53 expression following UV irradiation by direct association with the p53 3′-UTR region, by regulating p-phosphorylated von Hippel-Lindau tumor suppressor protein, or indirectly by stabilizing MDM2, a p53 protein E3 ligase.14,24,25 Therefore, we tested whether the loss of hbbe3 signal was caused by p53-induced apoptosis. A similar loss in hbbe3 transcripts at 24 or 48 hpf, as well as the absence of o-Dianisidine staining at 48 hpf, was found following elavl1a knockdown in p53−/− mutant embryos, although brain degeneration and eye phenotypes were improved (Figure 3G-L). In addition to the erythroid deficit, the pericardial edema phenotype was not rescued in p53−/− mutants. Thus, the erythropoiesis defect occurs independently of p53, suggesting that elavl1a specifically regulates embryonic erythropoiesis during zebrafish development.
Elavl1a regulates gata1 expression
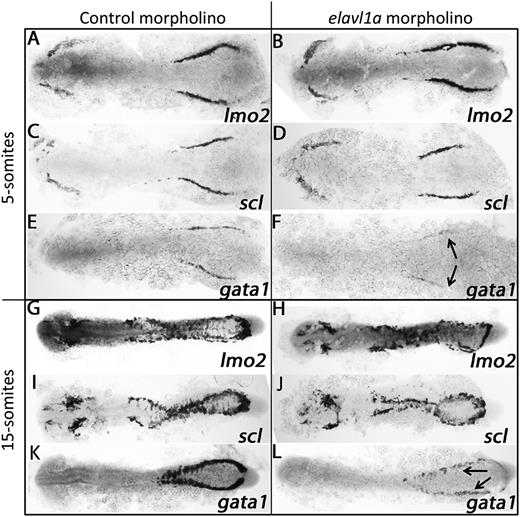
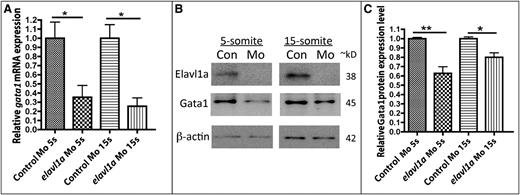
To investigate the molecular basis for the erythropoiesis defect following Elavl1a depletion, the expression of various hematopoietic regulatory genes was evaluated by in situ hybridization. At the 5-somite stage, expression of the stem/progenitor markers lmo2 and scl appear normal in control and elavl1a morphants (Figure 4A-D), whereas levels of the erythroid gata1 transcript are decreased (Figure 4E-F). This loss of gata1 transcript levels was still evident at the 15-somite stage, while transcripts for lmo2 and scl are similar in control and elavl1a morphants (Figure 4G-L). qPCR analysis confirmed the overall reduction in gata1 mRNA levels of elavl1 morphants at both 5- and 15-somite stages of development (Figure 5A). Therefore, gata1 mRNA levels are specifically decreased during stages of primitive erythropoiesis following depletion of Elavl1a, while other hematopoietic regulatory genes including lmo2 and scl are relatively unaffected. We also examined the expression levels of Gata1 protein. Anti-human GATA1 polyclonal antibody recognized zebrafish Gata1 protein expressed in HEK293 cells (supplemental Figure 3A). In elavl1a morphants, the Gata1 protein levels are reduced at both 5- and 15-somite stages, although less so than for the RNA, compared with control morphants (P < .05, Figure 5B-C). The western blots are less quantitative compared with qPCR data, and therefore might under-estimate the loss of Gata1 protein. However, if loss of Elavl1 leads primarily to a destabilization and loss of RNA (rather than deregulating translation) the Gata1 protein that is synthesized might be relatively stable up to these stages of development. These data indicate that elavl1a regulates the expression of gata1, an essential regulator of erythropoiesis during embryonic development.
Elavl1 regulates gata1 transcript levels. Shown are representative embryos following in situ hybridization for hematopoietic markers at the 5-somite (A-F) or 15-somite (G-L) stages in embryos that had been injected with 4 ng of control MO (left panels) or elavl1a Mo1 (right panels). Transcripts were analyzed for lmo2, scl, and gata1 as indicated, and embryos were flat-mounted, shown dorsal with anterior to the left. For each sample, n > 20, and the loss of gata1 transcripts (indicated by the arrows) was reproducible in independent experiments.
Elavl1 regulates gata1 transcript levels. Shown are representative embryos following in situ hybridization for hematopoietic markers at the 5-somite (A-F) or 15-somite (G-L) stages in embryos that had been injected with 4 ng of control MO (left panels) or elavl1a Mo1 (right panels). Transcripts were analyzed for lmo2, scl, and gata1 as indicated, and embryos were flat-mounted, shown dorsal with anterior to the left. For each sample, n > 20, and the loss of gata1 transcripts (indicated by the arrows) was reproducible in independent experiments.
Gata1 transcript and protein levels are reduced in elavl1a morphants. (A) qPCR analysis was performed on embryos at the 5-somite (5s) or 15-somite (15s) stages (N = 3 experiments, *P < .05). (B) Representative western blotting experiment. (C) Quantification of Gata1 protein levels, normalized to β-actin, following western blotting, averaged from n = 6 experiments. *P < .05; **P < .01. Error bars represent SD.
Gata1 transcript and protein levels are reduced in elavl1a morphants. (A) qPCR analysis was performed on embryos at the 5-somite (5s) or 15-somite (15s) stages (N = 3 experiments, *P < .05). (B) Representative western blotting experiment. (C) Quantification of Gata1 protein levels, normalized to β-actin, following western blotting, averaged from n = 6 experiments. *P < .05; **P < .01. Error bars represent SD.
Elavl1a function in mesoderm is relatively restricted
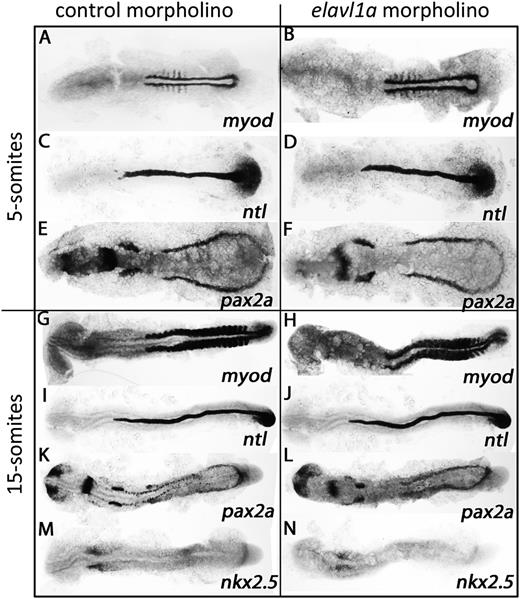
We next tested whether the phenotype described in elavl1a morphants is specific to blood cells, or represents a more general defect in mesoderm lineage differentiation. For this purpose, whole-mount in situ hybridization experiments evaluated transcript levels for myod (somitic mesoderm and muscle), ntl (axial mesoderm and notochord), pax2a (lateral mesoderm and pronephros), and nkx2.5 (anterior lateral mesoderm and cardiomyocytes). As shown in Figure 6A-L, elavl1a morphant embryos exhibit similar transcript patterns compared with the control embryos at the 5- or 15-somite stages for myod,ntl, and pax2a. Interestingly, nkx2.5 (the cardiac mesoderm marker) is relatively decreased in the elavl1a morphants at the 15-somite stage (Figure 6M-N). The results suggest that knockdown of elavl1a does not cause a general defect in mesoderm development, but causes specific defects in expression of gata1 and nkx2.5, which could explain phenotypes in erythropoiesis (gata1) and perhaps contribute to pericardial edema (nkx2.5).
Mesoderm is not generally disturbed in elavl1a morphants. (A-N) Shown are representative embryos following in situ hybridization for myod, ntl, pax2a, and nkx2.5 at 5- or 15-somite stages in control or morphant embryos, as indicated. Embryos are flat mounted, viewed dorsally, anterior to the left. For each representative sample, n > 20.
Mesoderm is not generally disturbed in elavl1a morphants. (A-N) Shown are representative embryos following in situ hybridization for myod, ntl, pax2a, and nkx2.5 at 5- or 15-somite stages in control or morphant embryos, as indicated. Embryos are flat mounted, viewed dorsally, anterior to the left. For each representative sample, n > 20.
Elavl1a binds gata1 mRNA and promotes expression
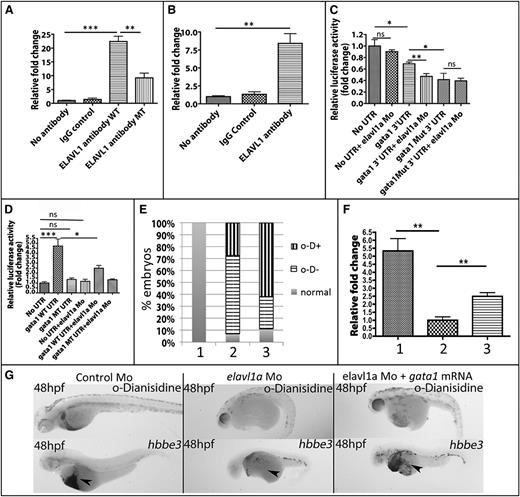
Elavl1 is known to positively regulate gene expression by binding to ARE elements in the 3′-UTR of target mRNAs.26 Because gata1 transcripts were significantly depleted in elavl1a morphant embryos, we analyzed the zebrafish gata1 untranslated region and found 3 potential Elavl1-binding sites (supplemental Figure 6). We hypothesized that by binding to these sites Elav1a could stabilize gata1 transcript levels. Therefore, we tested whether Elavl1 can bind directly gata1 3′-UTR sequences by performing immunoprecipitation assays. Using HEK293 cell lysates as a positive control, monoclonal antibodies were shown to precipitate both human and zebrafish versions of the Elavl1 protein (shown in supplemental Figure 3B). Therefore, the interaction between Elavl1 protein and gata1 transcript was tested by RNA immunoprecipitation. When zebrafish Elavl1a and a transcript containing the gata1 3′-UTR sequences were expressed in HEK293 cells, the Elavl1a-specific antibody showed a 20-fold increase in RNA pull-down compared with the controls using IgG or no antibody (Figure 7A), suggesting that Elavl1a binds directly to the 3′-UTR of the gata1 mRNA. The efficiency of pull-down was substantially decreased when the expressed RNA contained site-specific mutations in the putative Elavl1a-binding sites. These data indicate that Elavl1 binds to specific elements in the 3′-UTR of the gata1 mRNA. Sequence analysis suggested that the mouse Gata1 3′-UTR contains 2 predicted Elavl1 predicted binding sites, and sequence alignment suggests that in zebrafish and mouse Gata1 at least 1 of these 3′-UTR elements is conserved (supplemental Figure 4). Therefore, we hypothesized that murine Gata1 RNA is also a direct target of mouse ELAVL1 and performed RNA immunoprecipitation assays using lysates from the MEL cell line. We found a ninefold enhanced precipitation of Gata1 transcripts using anti-ELAVL1 antibody compared with controls using IgG or no antibody (Figure 7B).
Elavl1 binds to the gata1 transcript and Elavl1a-binding sites in the 3′-UTR affect gene expression. (A) Association of Elavl1 protein and gata1 transcript demonstrated by RNA immunoprecipitation. Transcripts including the gata1 3′-UTR (WT) or with the putative Elavl1a-binding sites mutated along with Elavl1a expression vectors were transfected into HEK293 cells. IP experiments used no antibody, IgG control antibody, or Elavl1a-specific antibodies, as indicated, to precipitate RNA, and relative levels of the gata1 3′-UTR in the precipitate were quantified by qPCR. Fold-change is shown normalized to the no-antibody control group. **P < .01; ***P < .001. (B) Lysates from MEL cells were likewise immunoprecipitated with ELAVL1-specific antibody and murine Gata1 RNA quantified in the pull-down. **P < .01. (C) Reporter gene assay in zebrafish embryos. Luciferase reporters contained no UTR, zebrafish gata1 3′-UTR, or the mutated isoform 3′-UTR. Relative firefly luciferase activity was normalized by Renilla luciferase activity. All data are averaged from at least 3 experiments. *P < .05; **P < .01. Error bars represent SD. (D) Erythroid lineage-specific reporter assay in zebrafish embryos. Embryos were injected with transgenes regulated by the gata1 erythroid-specific promoter. Relative firefly luciferase activity was normalized by Renilla mRNA luciferase activity. All data are averaged from at least 3 experiments. *P < .05; **P < .01. Error bars represent SD. (E) Quantification of phenotypes for embryos in each study group, including: lane 1, control embryos; lane 2, morphant embryos; or lane 3, morphant embryos, that were also injected with 12.5 ng of gata1 mRNA, which can partially rescue the blood cell phenotype. Embryos were scored as relatively normal, strongly positive for o-Dianisidine–stained cells, even though the cells fail to circulate (o-D+) or were negative for o-Dianisidine (o-D−). χ2, P < .001. (F) Results from qPCR experiments measuring hbbe3 transcripts (in lane 1, control Mo-injected; lane 2,elavl1a Mo-injected; or lane 3, elavl1a Mo-injected embryos) that were coinjected with gata1 mRNA. Transcript levels in control and RNA-injected morphants are plotted relative to those from elavl1a morphants; **P < .01. (G) Shown are representative 48 hpf embryos stained for hemoglobin (o-Dianisidine, top panels) or processed by in situ hybridization for globin transcripts (hbbe3, bottom panels). For each representative sample, n > 20. MT, mutated; ns, not significant.
Elavl1 binds to the gata1 transcript and Elavl1a-binding sites in the 3′-UTR affect gene expression. (A) Association of Elavl1 protein and gata1 transcript demonstrated by RNA immunoprecipitation. Transcripts including the gata1 3′-UTR (WT) or with the putative Elavl1a-binding sites mutated along with Elavl1a expression vectors were transfected into HEK293 cells. IP experiments used no antibody, IgG control antibody, or Elavl1a-specific antibodies, as indicated, to precipitate RNA, and relative levels of the gata1 3′-UTR in the precipitate were quantified by qPCR. Fold-change is shown normalized to the no-antibody control group. **P < .01; ***P < .001. (B) Lysates from MEL cells were likewise immunoprecipitated with ELAVL1-specific antibody and murine Gata1 RNA quantified in the pull-down. **P < .01. (C) Reporter gene assay in zebrafish embryos. Luciferase reporters contained no UTR, zebrafish gata1 3′-UTR, or the mutated isoform 3′-UTR. Relative firefly luciferase activity was normalized by Renilla luciferase activity. All data are averaged from at least 3 experiments. *P < .05; **P < .01. Error bars represent SD. (D) Erythroid lineage-specific reporter assay in zebrafish embryos. Embryos were injected with transgenes regulated by the gata1 erythroid-specific promoter. Relative firefly luciferase activity was normalized by Renilla mRNA luciferase activity. All data are averaged from at least 3 experiments. *P < .05; **P < .01. Error bars represent SD. (E) Quantification of phenotypes for embryos in each study group, including: lane 1, control embryos; lane 2, morphant embryos; or lane 3, morphant embryos, that were also injected with 12.5 ng of gata1 mRNA, which can partially rescue the blood cell phenotype. Embryos were scored as relatively normal, strongly positive for o-Dianisidine–stained cells, even though the cells fail to circulate (o-D+) or were negative for o-Dianisidine (o-D−). χ2, P < .001. (F) Results from qPCR experiments measuring hbbe3 transcripts (in lane 1, control Mo-injected; lane 2,elavl1a Mo-injected; or lane 3, elavl1a Mo-injected embryos) that were coinjected with gata1 mRNA. Transcript levels in control and RNA-injected morphants are plotted relative to those from elavl1a morphants; **P < .01. (G) Shown are representative 48 hpf embryos stained for hemoglobin (o-Dianisidine, top panels) or processed by in situ hybridization for globin transcripts (hbbe3, bottom panels). For each representative sample, n > 20. MT, mutated; ns, not significant.
We next tested directly whether cis elements that promote Elavl1a binding affect gata1 transcript function. For this purpose, wild-type or mutated versions of the zebrafish gata1 3′-UTR were fused downstream of a luciferase reporter gene and constructs were microinjected into developing embryos. Luciferase activity was quantified (normalized by activity of a control Renilla luciferase reporter in the same pmir-Glo vector) comparing control luciferase, the luciferase fused to wild-type gata1 3′-UTR, or the luciferase fused to the gata1 UTR with putative Elavl1-binding sites mutated. As shown in Figure 7C, elavl1 MOs strongly suppress gata1 3′-UTR–linked luciferase expression. Similar low levels of luciferase were found when the Elavl1-binding sites are mutated on the 3′-UTR (and are not further affected by inclusion of the MO). These data suggest that the binding of Elavl1a on the gata1 3′-UTR promotes the expression of this erythroid-specific transcription factor.
Elavl1a regulates gata1 expression and erythropoiesis in vivo
To confirm that Elavl1a regulates gata1 in erythroid progenitors, wild-type or mutated zebrafish gata1 3′-UTR sequences were fused downstream of the firefly luciferase reporter in transgenic constructs with the reporters placed under control of the erythroid-specific gata1 promoter, which restricts expression to the developing red cells in the embryonic intermediate cell mass.27-29 Constructs were injected into zebrafish embryos and reporter activity was quantified at 24 hpf. The transgenic embryos containing the wild-type gata1 3′-UTR expressed significantly higher levels of luciferase activity compared with transgenic embryos harboring the mutant construct. Furthermore, this increased luciferase activity was suppressed by knockdown of elavl1a by a coinjected MO (Figure 7D). To determine whether gata1 is a critical gene targeted by Elavl1 affecting erythropoiesis, gata1 mRNA was injected in elavl1a morphants. Indeed, 40% of the embryos showed a substantial increase in hemoglobin staining at 48 hpf compared with uninjected morphants, (χ2, P < .001), and a partial but significant rescue of embryonic globin RNA expression according to qPCR and in situ hybridization experiments (Figure 7E-G).
Discussion
Elavl1 is an RNA-binding protein that we find is well conserved between humans and zebrafish. Zebrafish Elavl1 is encoded by 2 genes, presumably duplicated and then retained in the fish genome. The predominant isoform expressed during embryogenesis is encoded by the elavl1a gene, with transcripts and protein found as maternal products and then widely throughout the developing embryo. We showed that knockdown of this gene has major effects on embryonic development, such that by 48 hpf, the body axis is much shorter and neural tissues are degenerated. The embryos also develop with a striking deficit of embryonic blood cells. While defects in hematopoiesis may be caused indirectly through early embryonic morphogenetic alterations, our data suggest phenotypes that are caused by direct deregulation of gata1, a key regulator of the erythroid lineage. In contrast to markers for other mesodermal derivatives, gata1 transcript levels are decreased even as early as the 5-somite stage, and coinjection of gata1 RNA is able to at least partially restore erythropoiesis to the elavl1a morphant embryos. The results indicate that altered gata1 transcript levels caused by knockdown of Elavl1a protein are sufficient to deregulate embryonic erythropoiesis. At least some activity for Elavl1 appears to function through binding sites present in the gata1 3′-UTR. We did not find a difference for rescue, comparing the gata1 mRNAs with wild-type or mutated 3′-UTR, but this might reflect technical challenges of the rescue assay, since overexpression with injected RNA could override the balance of regulatory mechanisms acting through the 3′-UTR.
In summary, the major finding of this study is that the Elavl1 RNA-binding protein can bind and stabilize gata1 transcripts during embryonic erythropoiesis, as a posttranscriptional mechanism to enhance Gata1 expression and regulate red cell development. Embryos depleted of Elavl1a, which is the predominant isoform in zebrafish embryos, had specific defects in gata1 transcript levels, Gata1 protein levels, and primitive embryonic erythropoiesis. Elavl1 can bind to the gata1 3′-UTR, dependent on AU-rich sites that match the Elavl1 consensus-binding sequence, and this feature appears to be conserved in the mouse gene. Our data show that posttranscriptional regulation of gata1, a key transcriptional regulatory factor for the erythroid lineage, provides a previously unrecognized posttranscriptional regulatory mechanism for embryonic erythropoiesis.
The online version of this article contains a data supplement.
The publication costs of this article were defrayed in part by page charge payment. Therefore, and solely to indicate this fact, this article is hereby marked “advertisement” in accordance with 18 USC section 1734.
Acknowledgments
We thank Yariv Hourvas for providing p53−/− mutant fish and Gabriel Rosenfeld for experimental advice.
This work was supported by National Institutes of Health (Heart, Lung and Blood Institute) grants HL49094 (T.H.) and HL56182 (T.E.).
Authorship
Contribution: X.L. conceived the study, carried out experiments, analyzed data, and wrote the manuscript; Y.-C.L. and K.D. performed experiments; I.T. provided expert consultation for experiments and reagents; and T.H. and T.E. conceived the study, analyzed data, and wrote the manuscript.
Conflict-of-interest disclosure: The authors declare no competing financial interests.
Correspondence: Todd Evans, Department of Surgery, Weill Cornell Medical College, Cornell University, 1300 York Ave, New York, NY 10065; e-mail: tre2003@med.cornell.edu; or Timothy Hla, Center for Vascular Biology, Department of Pathology and Laboratory Medicine, Weill Cornell Medical College, Cornell University, 1300 York Ave, New York, NY 10065; e-mail: tih2002@med.cornell.edu.

This feature is available to Subscribers Only
Sign In or Create an Account Close Modal