Abstract
Despite successful application of risk-adapted treatment for pediatric ALL, about 20% of patients still relapse. And a substantial portion of such patients lack any conventional high-risk (HR) feature. As contemporary chemotherapy involves multiple drugs, treatment failure may attribute to the genetic variations in genes responsible for drug metabolism and transport. In this study, we established a SNP-based predictor to prognosticate patients enrolled on Malaysia-Singapore ALL 2003 (MS2003) and 2010 (MS2010) Studies.
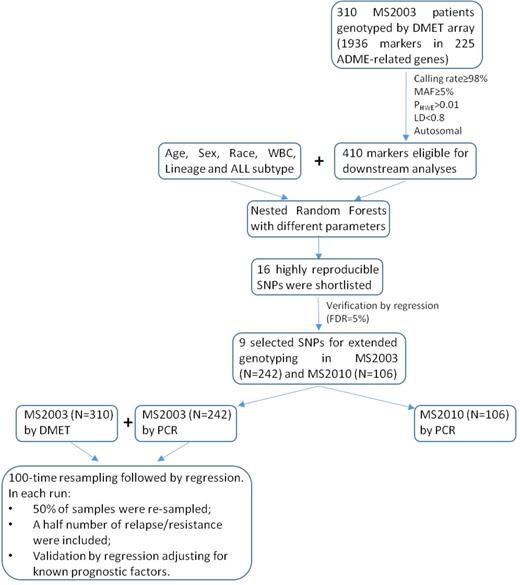
A cohort of 310 MS2003 patients was initially genotyped using Affymetrix DMET™ Plus Array. A nested Random Forests was designed to evaluate the association between the genotypes and cumulative incidence of relapse (CIR, including resistance). Shortlisted candidates were confirmed by competing risk regression adjusting for known prognostic factors. Such candidate SNPs were subsequently genotyped in additional 242 MS2003 patients and 106 MS2010 patients for further validation. A scoring metric indicating the number of relapse-associated genotypes in a patient was used to predict outcome. (Fig. 1)
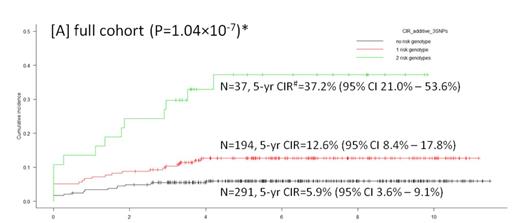
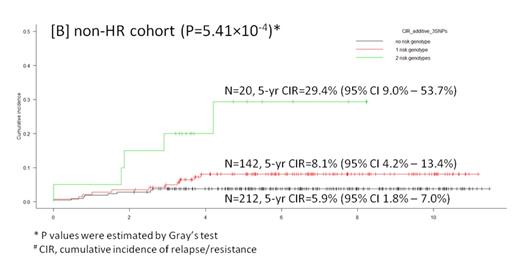
Of 1936 markers interrogated by DMET platform, 410 SNPs and InDels were eligible for downstream analyses after quality control. Random Forests identified 16 CIR-associated SNPs, 9 of which were verified in regression model and selected for further genotyping. Subsequent validation on all MS2003 patients (N=519) confirmed 3 risk genotypes that were associated with higher 5-yr CIR: A/A of rs4534 in CYP11B1 (P=3.10x10⁻³, HR=2.34 (95% CI 1.33-4.12)), C/T and T/T of rs1056837 in CYP1B1 (P=3.30x10⁻⁴, HR=2.66 (95% CI 1.56-4.53)), and T/T of rs3803390 in SLC28A1 (P=6.60x10⁻³, HR=2.18 (95% CI 1.24-3.82)). The number of risk genotypes was shown to strongly correlate with 5-yr CIR after adjusting presenting features including age, WBC and ALL subtype (P=6.70x10⁻⁸; Table 1). The risk was nearly 7-fold higher in patients with 2 risk genotypes compared to those without any risk genotype (P=2.00x10⁻⁸; Table 1 and Fig. 2a; there was no patient with all 3 risk genotypes). Further adjustment for Day 33 MRD did not alter the significance. Even in non-HR patients (without BCR-ABL1 fusion, MLL rearrangements, hypodiploidy, or Day 33 MRD>=1x10⁻²), this scoring metric remained significant (P=2.60x10⁻³ for incremental effect; P=1.20x10⁻³ for 2 risk genotypes vs. no risk genotype; Table 1 and Fig. 2b). Concordantly, increasing number of risk genotypes was also associated with a higher probability of Day 33 MRD-HR (i.e. MRD>=1x10⁻²; 6.5% of patients without any risk genotype vs. 9.8% of patients with 1 risk genotype vs. 29.0% of patients with 2 risk genotypes; P<0.001). In MS2010 patients, a similar trend was reproduced, showing a higher proportions of Day 33 MRD-HR (N=3, 33.3%) and adverse events (N=4, 44.4%) in patients with 2 risk genotypes (N=9). The 3-yr CIR was 22.2% (95% CI 2.8%-53.3%) in patients with 2 risk genotypes compared to 8.3% (95% CI 3.4%-16.0%) in others. Patients with 2 risk genotypes also had a significantly lower 3-yr EFS 55.6% (95% CI 20.4%-80.5%) compared to 90.6% (95% CI 81.5%-95.4%) in others (P=1.15x10⁻³).
Our results suggest that germline variations can complement existing prognostic factors to refine risk stratification.
Increasing number of risk genotypes was associated with 5-yr CIR in MS2003 cohort.
| . | Full cohort (N=519) . | Non-HR cohort (N=374) . | ||||||
|---|---|---|---|---|---|---|---|---|
| Frequency | HR (95% CI) | P | Reproducibility (out of 100)* | Frequency | HR (95% CI) | P | Reproducibility (out of 100)* | |
| no risk genotype | 290 | ref. | - | - | 212 | ref. | - | - |
| 1 risk genotype | 192 | 2.43 (1.29 - 4.58) | 5.90x10⁻³ | - | 142 | 2.19 (0.84 - 5.70) | 0.11 | - |
| 2 risk genotypes | 37 | 6.87 (3.50 - 13.46) | 2.00x10⁻⁸ | - | 20 | 6.51 (2.10 - 20.14) | 1.20x10⁻³ | - |
| Incremental effect | - | 2.61 (1.84 - 3.69) | 6.70x10⁻⁸ | 99 | - | 2.51 (1.38 - 4.55) | 2.60x10⁻³ | 47 |
* That adjusted significance (FDR=5%) is reproduced for more than 10 times is considered statistically significant according to binomial probability distribution (cumulative probability P(X¡Ý10)<0.05)
No relevant conflicts of interest to declare.
Author notes
Asterisk with author names denotes non-ASH members.


This feature is available to Subscribers Only
Sign In or Create an Account Close Modal