Abstract

Background
Ferritin is a ubiquitous protein involved in intracellular iron storage; however, there is growing evidence of its implication in immune suppression, given its overexpression in autoimmune diseases. Secondary Hemophagocytic Lymphohistiocytosis (HLH) typically presents in adults. In the clinical protocol HLH-04, the diagnosis of HLH is made by having either molecular testing representative of HLH or by having five or more of the following eight criteria: 1) fever, 2) splenomegaly, 3) cytopenias (affecting at least 2 cell lineages), 4) hypertriglyceridemia and/or hypofibrinogenemia, 5) hemophagocytosis in bone marrow, spleen, or lymph nodes, 6) diminished NK-cell activity, 7) elevated soluble CD25 (i.e. sIL-2 receptor), and 8) hyperferritinemia. An elevated ferritin level was defined as >500 ng/mL.
Ferritin levels in critically ill patients are poorly understood since levels are driven by multiple variables related to comorbidities and ferritin’s role as an acute phase reactant in the setting of an acute illness. Many conditions associated with critically ill patients can mimic HLH clinically, including malignancies (leukemia, lymphoma, and other solid tumors), infections (viral, bacterial, or parasitic), and rheumatoid disorders. Incidentally, these same conditions can lead to secondary HLH, making the discrimination between actual cases of HLH and clinically similar conditions quite difficult at times.
We hereby present the first retrospective review of hyperferritinimia in the critically ill adult patient population and its relation to HLH.
Methods
We performed a retrospective review of patients admitted to our academic medical center intensive care unit (MICU) between 2004 and 2014 with serum ferritin level measured during their hospital stay above 500 ng/mL. We then reviewed their discharge diagnosis (based upon the treating physicians’ diagnosis) to investigate the utility of defining a ferritin level, which would provide adequate specificity while maintaining a reasonable sensitivity in identifying those patients with HLH. Discharge diagnoses were then categorized into major groups such as sepsis/infection, hematological malignancy, HLH, respiratory disease, neurological disease, HIV, transplant complications, renal disease, or cardiac disease; median ferritin levels were calculated for each category.
Results
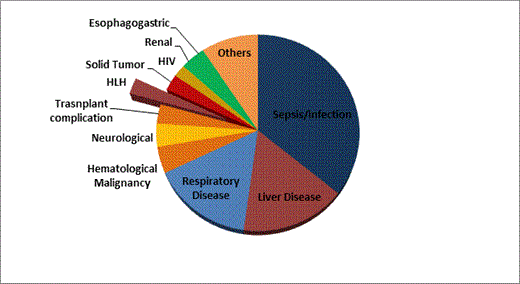
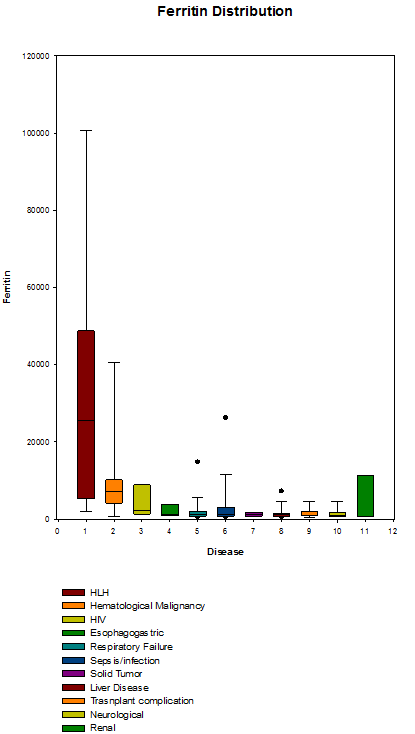
We found 343 patients with a serum ferritin level >500 ng/mL who were admitted to the MICU during their hospital stay. Median age of this patient group was 58 years with a range of 20 to 88 years; 209 were men and 136 were women. Caucasians represented 82%. Nine patients carried HLH as their discharge diagnosis, which represented 2.6% of all patients. The most common discharge diagnosis (35%) was sepsis/infection (Figure 1). HLH had the highest ferritin level with a median of 25,652 ng/mL (range 1,977 to 100,727 ng/mL). The closest second ferritin median was in hematological malignancies (7,154 ng/mL; range 561 to 60,774 ng/mL, Figure 2).
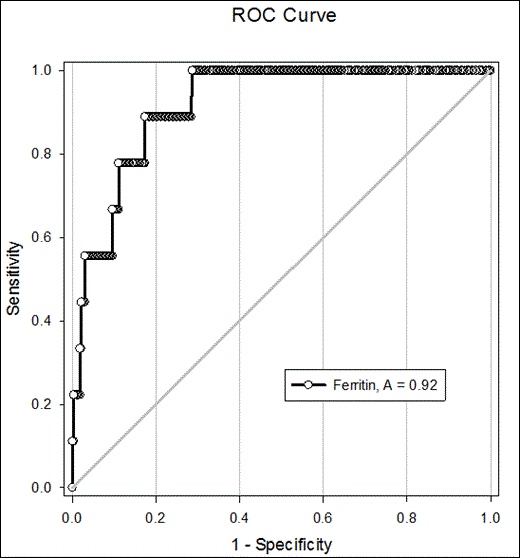
To obtain optimal sensitivity and specificity of different ferritin values (Table 1) in identifying HLH patients, an ROC curve, with a pretest probability of 50% and cost ratio of 1, showed the optimal ferritin cutoff to be 3,951 ng/mL which, in our population, would have a sensitivity of 88% (95% CI 51-99%) and specificity of 82% (95% CI 78-86%, Figures 3).
Conclusion
While ferritin is an integral test for the diagnosis of HLH, a value of >500 ng/mL lacks specificity in adults in the critical care setting. Increasing the diagnostic value to 3,900 ng/mL in this patient population improves specificity while maintaining an acceptable sensitivity to aid in the diagnosis of patients with HLH.
Ferritin distributions over the major 11 disease categories. Boxes represent the 25-75 percentiles. Dots represent the 5/95 outliers.
Ferritin distributions over the major 11 disease categories. Boxes represent the 25-75 percentiles. Dots represent the 5/95 outliers.
Different proposed cutoffs with their prospective sensitivity, specificity, and likelihood ratios (LR).
| Cutoff > . | Sensitivity % . | 95% CI . | Specificity % . | 95% CI . | LR + . | LR - . |
|---|---|---|---|---|---|---|
| 503.50 | 100.00 | 66.37% to 100.0% | 0.30 | 0.007557% to 1.652% | 1.00 | 0.00 |
| 2514.00 | 88.89 | 51.75% to 99.72% | 75.22 | 70.24% to 79.76% | 3.59 | 0.15 |
| 5020.00 | 77.78 | 39.99% to 97.19% | 85.67 | 81.46% to 89.24% | 5.43 | 0.26 |
Figure 4. Receiver operating characteristic (ROC) curve for maximum serum ferritin. (A) is Area under the curve.
Figure 4. Receiver operating characteristic (ROC) curve for maximum serum ferritin. (A) is Area under the curve.
No relevant conflicts of interest to declare.
Author notes
Asterisk with author names denotes non-ASH members.

This icon denotes a clinically relevant abstract


This feature is available to Subscribers Only
Sign In or Create an Account Close Modal