Abstract
BACKGROUND
ALL is the most common form of childhood cancer with >80% cured with contemporary treatment protocols. Accurate risk stratification in childhood ALL is essential to avoid under- and over-treatment. Currently, we use presenting clinical, biological features, and minimal residual disease (MRD) quantitation to risk stratify patients. Although whole genome gene expression profiling (GEP) can accurately classify patients with ALL into various WHO 2008 defined subgroups, its value in predicting relapse remained to be defined. We hypothesized that global time-series GEPs of bone marrow (BM) samples at diagnosis and specific points during initial remission-induction therapy can measure the success of cytoreduction and be used for relapse prediction.
METHODS
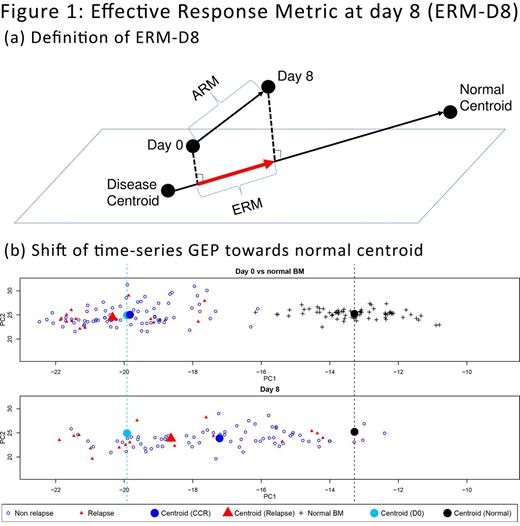
We generated time-series GEPs from 181 children with de novo ALL at diagnosis and Day 8 of remission-induction therapy. We computed the time-series changes from diagnosis to Day 8 of remission-induction, termed Effective Response Metric (ERM-D8; Fig 1), that measures both the magnitude and direction of time-series change in multi-dimensional gene space towards the normal centroid, and we compared its ability to predict relapse against contemporary risk assignment methods including NCI criteria, cytogenetics and MRD.
RESULTS
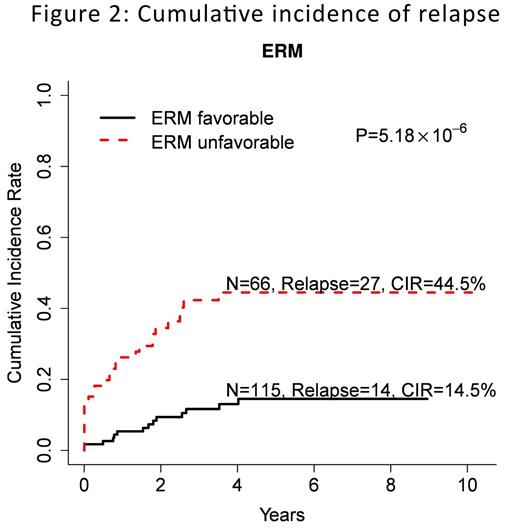
Unsupervised hierarchical clustering of the first 96 patients revealed that 30.3% (10 of 33) patients whose diagnosis and day 8 GEP pairs clustered together in the same branch suffered a relapse compared to 7.5% (4 of 53) who clustered to different branches. This suggests that patients with minimal changes in GEP after 8 days of remission-induction therapy have a 4-fold significantly higher risk of relapse (p=5.4x10⁻³). To test this observation, we extended the study to 181 ERM-D8 in 8 batches. Using leave-one-batch-out cross-validation, we found that ERM-D8 is predictive of relapse; patients with favorable ERM-D8 (n=115) had a significantly lower 14.5% 5-year cumulative risk of relapse (CIR) compared to 44.5% with unfavorable ERM-D8 (n=66; p= 5.1x10⁻⁶; Fig 2).
In multivariate analysis, ERM-D8 remained significant (Table 1; p=7.9x10⁻⁴, HR 3.19 [1.62-6.29]) after controlling for early clinical features of age (p= 0.37), WBC (p=0.05), cytogenetics (p=0.021) and Day 8 peripheral blast response (p=0.96).
Even after adjusting for Day 33 MRD (p=5.4x10⁻³), ERM-D8 remained independently predictive of relapse (Table 1; p=8.5x10⁻³, HR 2.63[1.28-5.42]). ERM-D8 helped further refine Day 33 MRD risk stratification. Day 33 MRD negative patients with unfavorable ERM-D8 (n=29) had a 5 fold higher risk of relapse compared to patients with favorable ERM-D8 (n=60; 5-year CIR 21.7% vs 4.4; p=0.021). Similarly Day 33 MRD positive patients with unfavorable ERM-D8 (n=33) have double the risk of relapse compared to those with favorable ERM-D8 (n=45; 5-year CIR 62.8% vs 29.2%; p=1.01x10⁻³). ERM-D8 also improved risk stratification in patients with favorable cytogenetics. Favorable cytogenetics patients with unfavorable ERM-D8 (n=31) do significantly poorer than those with favorable ERM-D8 (n=51; 5-year CIR 36.4% vs 2.4%; p=1.04x10⁻⁴).
CONCLUSION
We describe a novel metric based on time-series GEP during first 8 days of remission-induction therapy that is independently predictive of risk of relapse even after adjusting for age, WBC, NCI risk, cytogenetics and MRD.
Multivariate competing risk regression analyses comparing ERM-D8 against age, WBC count at presentation, cytogenetics, Day 8 peripheral response and Day 33 MRD.
| . | Without Day 33 MRD . | With Day 33 MRD . | ||||
|---|---|---|---|---|---|---|
| p-value | HR | 95% CI | p-value | HR | 95% CI | |
| ERM-D8 unfavorable vs favorable* | 7.9x10⁻⁴ | 3.19 | 1.62~6.29 | 8.5x10⁻³ | 2.63 | 1.28~5.42 |
| Cytogenetics unfavorable vs favorable and others** | 0.021 | 2.45 | 1.14~5.26 | 0.23 | 1.69 | 0.72~3.98 |
| Age, years <1 or >10 vs 1~10 | 0.37 | 1.39 | 0.67~2.89 | 0.43 | 1.35 | 0.64~2.84 |
| WBC, x109/L over 50 vs below 50 | 0.05 | 1.99 | 1.00~2.96 | 0.25 | 1.69 | 0.69~4.13 |
| Day 8 Response poor vs good | 0.96 | 1.02 | 0.40~2.59 | 0.65 | 0.81 | 0.32~2.06 |
| Day 33 MRD >=1.0x10⁻² vs <1.0x10⁻² | - | - | - | 5.4x10⁻³ | 3.37 | 1.43~7.92 |
| *ERM-D8 risk groups: favorable: high ERM-D8; unfavorable: low ERM-D8 **Cytogenetics risk groups: favorable: t(12; 21), t(1;19) and hyperdiploidy; unfavorable: t(9;22), t(11q23) and hypodiploidy | ||||||
No relevant conflicts of interest to declare.
Author notes
Asterisk with author names denotes non-ASH members.


This feature is available to Subscribers Only
Sign In or Create an Account Close Modal