Abstract

Hematopoietic stem cells (HSCs) present in the bone marrow (BM) are primarily responsible for maintaining peripheral blood (PB) cell counts at a steady state. These hematopoietic progenitors are mobilized and used to support high dose therapy in patients with hematological malignancies. There is considerable variability in the HSC yield in patients and normal donors with standard mobilizing regimens. Understanding the quantitative principles at work in hematopoiesis will allow optimization of mobilizing regimens and eventual prediction of secondary hematopoietic malignancies. We created a mathematical model to account for the dynamics of HSCs in the bone marrow (C) and periphery (P) in addition to progenitor, committed, and peripheral blood platelets (T), neutrophils (N), lymphocytes (L), and erythrocytes (R). We explicitly model the egress of progenitor and committed cells from the BM compartment to the PB. In addition to these dynamics, we model the movement of CD34+ cells (P) from the bone marrow into the blood and the collection of CD34+ cells while on filgrastim. We also model transplantation of these collected cells in patients following myeloablative chemotherapy.
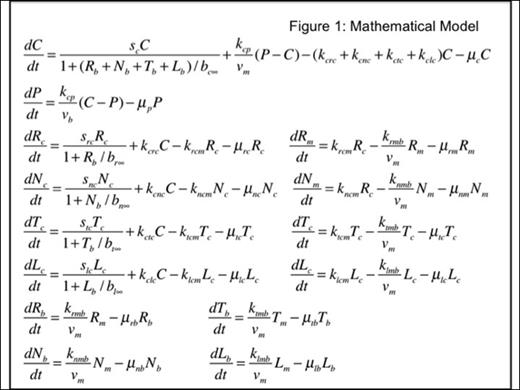
We create the model with parameters that govern the rate at which the interactions between these cells occur, in addition to the variables defined previously, see Fig. 1 for equations.
HSCs (C) and committed cells (Rc, Nc, Tc, and Lc) proliferate at rates sc, src, snc, stc, and slc, respectively. All source rates are inhibited by the concentration of their cell type in the blood, using a 1/(1+Xb/bxinf). Each cell type decays at a rate determined by the μx. HSCs differentiate into each subsequent committed cell type at the rates kcx and these committed cells differentiate into the progenitors of blood cells (Rm, Nm, Tm, and Lm) in the BM at the rates kxm. Progenitor cells move into PB (Rb, Nb, Tb, and Lb) at the rates kxb. Each parameter for movement from the BM to PB is scaled by the local volume to properly account for changes in concentrations.
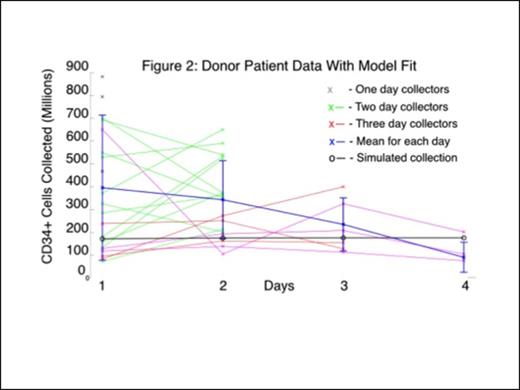
We begin by determining biologically relevant parameter values that correspond to homeostasis values for known cell concentrations in a normal person. The values for the blood are fit to normal blood cell count values, for example 3-4 million cells/μL for Rb. The range for P is broad (1-15 cells/μL) because there is variability in these levels in healthy individuals. Specific cell counts for the BM cells is not as well known, so we fit this compartment such that the dynamics and relative cell concentrations were reasonable and gave rise to correct concentrations in the PB, e.g. the ratio of Rc:Wc is about 1:5. Additionally, we treat this normal individual as a donor and simulate G-CSF treatment (which increases the rates of proliferation for C and NC and movement of CD34+ cells into the PB) and collection on this individual (black curve in Fig. 2). These results fit within the standard deviation bars for collection on each day from healthy donors.
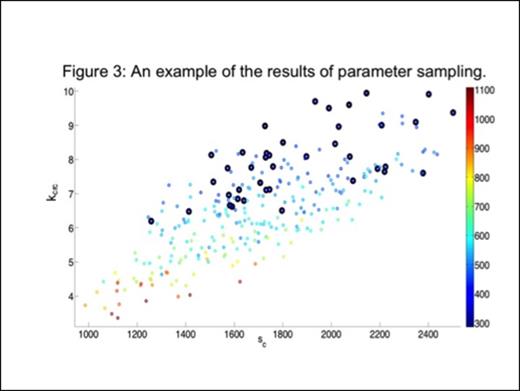
We then sample over a range parameter values to create a population of patients that have blood cell levels relevant to the disease and model collection for each of these individuals. Fig. 3 shows collection results from the simulated diseased population. A point is plotted for each patient at a sc versus kcrc values and colored by their total collection count. Poor collectors (<5,000,000 CD34+ cells/kg) are indicated as dark dots. Most poor collectors are seen when both parameter values are normal or elevated. Determining what drives poor collection for each simulated patients gives insight into which types of patient may benefit from additional drug treatments such as Plerixafor. For patients that self donate or use donor cells, we also simulate transplantation of the stem cells. Mathematical modeling such as this is useful in making predictions about physiological processes and can potentially aid in making decisions. Building validated models can lead to predictions about how patient will respond to a treatment and adapting alternative treatment.
No relevant conflicts of interest to declare.
Author notes
Asterisk with author names denotes non-ASH members.

This icon denotes a clinically relevant abstract


This feature is available to Subscribers Only
Sign In or Create an Account Close Modal