Abstract
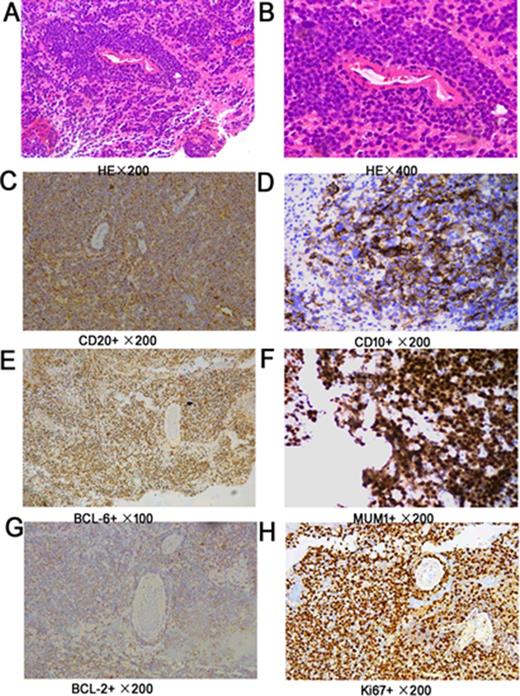
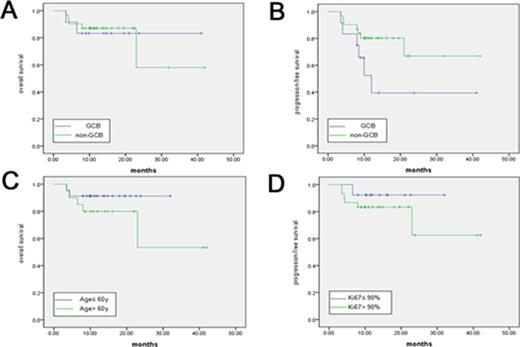
Primary central nervous system lymphoma (PCNSL) is aggressive and confined to the central nervous system, including the brain parenchyma, leptomeninges, spinal cord, eyes or cranial nervous. Morphologically, approximately 95% of these tumors are DLBCL according to the new World Health Organization (WHO) classification. However, PCNSL has treatment outcome distinct from those of systemic DLBCL, as well as dismal prognosis than systemic DLBCL. Our goal was to determine the immunohistochemical profile and prognostic significance for 132 Chinese PCNSL cases. The expression of CD20, CD10, BCL-6, MUM1, CD138, BCL-2, and Ki67 antigens were observed by immunohistochemical method. All cases expressed CD20. CD10, BCL-6, and MUM1 were positive in 15.2% (20/132), 86.4% (114/132), 90.2% (119/132). CD138 was negative in 100% (39/39). BCL-2 was positive in 89.3% (108/121). The Ki67 antigen, a proliferative index, ranging from 1% to 100% (median 85.3%) and 76.5% (101/132) PCNSLs showed Ki67 ≥ 90%. Among 132 cases, 25 (18.9%) were classified as germinal center B-cell-like (GCB); 107 (81.1%) were classified as activated B-cell-like (ABC). The Ki67 index in 25 GCB was similar to that in 107 ABC (p=0.663>0.05). No significant correlation was found between Ki67 index and BCL-2 (p=0.225>0.05). Significant positive correlation was found between Ki67 index and BCL-6 expression (p=.000<0.05). Among 132 cases, 43 had complete data of treatment that received chemotherapy regimens based on HD-MTX. GCB and ABC had similar OS (p=0.969) and PFS (p=0.070). These findings support that PCNSL predominantly express an ABC immunophenotype and express high Ki67 index, and suggest that the proliferative activity of GCB was similar to ABC and the expression of BCL-6 but not BCL-2 was positively correlated with the malignant degree of tumors.
Clinical characteristics.
| Characteristics . | Patients, n (%) . |
|---|---|
| Age (years); n=132 | ≥60 y, n=53; <60 y, n=79 |
| Median (range) | 57 (21-85) |
| Gender; n=132 | |
| Male | 69 (52.3) |
| Female | 63 (47.7) |
| ECOG; n=43 | |
| 0-1 | 8 (18.6) |
| 2-4 | 35 (81.4) |
| LDH; n=43 | |
| Normal | 25 (58.1) |
| Elevated | 18 (41.9) |
| Numbers of lesions; n=132 | |
| 1 | 48 (36.4) |
| >2 | 84 (63.6) |
| Involvement of deep structures; n=132 | |
| Absence | 43 (32.6) |
| Presence | 89 (67.4) |
Hans classification.
| CD10 . | BCL-6 . | MUM1 . | Immunoprofile . | PCNSL, n (%) . |
|---|---|---|---|---|
| + | + | + | GCB | 16 (12.1) |
| + | + | - | GCB | 3 (2.3) |
| + | - | + | GCB | 0 (0) |
| + | - | - | GCB | 1 (0.7) |
| - | + | - | GCB | 5 (3.8) |
| - | + | + | Non-GCB | 90 (68.2) |
| - | - | + | Non-GCB | 12 (9.1) |
| - | - | - | Non-GCB | 5 (3.8) |
Chang classification.
| CD10 . | BCL-6 . | MUM1 . | Immunoprofile . | PCNSL, n (%) . |
|---|---|---|---|---|
| + | + | - | GCB (Pattern A) | 3 (2.4) |
| + | - | - | GCB (Pattern A) | 1 (0.8) |
| - | + | - | GCB (Pattern A) | 5 (3.9) |
| + | + | + | activated GCB (Pattern B) | 16 (12.6) |
| + | - | + | activated GCB (Pattern B) | 0 (0) |
| - | + | + | activated GCB (Pattern B) | 90 (70.9) |
| - | - | + | activated non-GCB (Pattern C) | 12 (9.4) |
Kaplan-Meier curve shows clinical prognostic variables and their relationship to OS and/or PFS.
Kaplan-Meier curve shows clinical prognostic variables and their relationship to OS and/or PFS.
No relevant conflicts of interest to declare.
Author notes
Asterisk with author names denotes non-ASH members.


This feature is available to Subscribers Only
Sign In or Create an Account Close Modal