Key Points
Thrombin and fibrinogen γ′ regulate protofibril packing within fibrin fibers and thereby influence clot stiffness.
Fibrin analysis after dehydration (e.g. electron microscopy) overestimates changes in fiber size due to effects on protofibril packing.
Abstract
Previous studies have shown effects of thrombin and fibrinogen γ′ on clot structure. However, structural information was obtained using electron microscopy, which requires sample dehydration. Our aim was to investigate the role of thrombin and fibrinogen γ′ in modulating fibrin structure under fully hydrated conditions. Fibrin fibers were studied using turbidimetry, atomic force microscopy, electron microscopy, and magnetic tweezers in purified and plasma solutions. Increased thrombin induced a pronounced decrease in average protofibril content per fiber, with a relatively minor decrease in fiber size, leading to the formation of less compact fiber structures. Atomic force microscopy under fully hydrated conditions confirmed that fiber diameter was only marginally decreased. Decreased protofibril content of the fibers produced by high thrombin resulted in weakened clot architecture as analyzed by magnetic tweezers in purified systems and by thromboelastometry in plasma and whole blood. Fibers produced with fibrinogen γ′ showed reduced protofibril packing over a range of thrombin concentrations. High-magnification electron microscopy demonstrated reduced protofibril packing in γ′ fibers and unraveling of fibers into separate protofibrils. Decreased protofibril packing was confirmed in plasma for high thrombin concentrations and fibrinogen-deficient plasma reconstituted with γ′ fibrinogen. These findings demonstrate that, in fully hydrated conditions, thrombin and fibrinogen γ′ have dramatic effects on protofibril content and that protein density within fibers correlates with strength of the fibrin network. We conclude that regulation of protofibril content of fibers is an important mechanism by which thrombin and fibrinogen γ′ modulate fibrin clot structure and strength.
Introduction
Coagulation culminates in the production of thrombin, which converts fibrinogen into fibrin, forming the blood clot, to stop bleeding.1,2 Fibrinogen is a 340-kDa homodimeric plasma protein consisting of 6 polypeptide chains (2Aα, 2Bβ, and 2γ) linked together by disulphide bonds.3-5 A common variant of fibrinogen, fibrinogen γ′ (γA/γ′), is produced by alternative splicing of the γ-chain mRNA.6,7 This alternative chain has the final 4 C-terminal residues replaced with 20 different residues, with a high proportion of negatively charged residues. Fibrinogen γ′ has an average plasma concentration of 8% to 15%.6,8 The γA/γ′ sequence contains a thrombin binding site, which reduces thrombin inhibition by antithrombin and heparin cofactor II.9 On the other hand, binding to fibrinogen γA/γ′ reduces the availability of thrombin in the circulation, an effect previously described as antithrombin I.10 We previously found reduced fibrinopeptide (Fp)B but normal FpA release from γA/γ′ compared with γA/γA fibrin, leading to γA/γ′ fibrin networks made of thinner fibers and increased branching.11 Increased plasma concentrations of this variant have been associated with cardiovascular conditions such as ischemic stroke,12 coronary artery disease,13 and myocardial infarction.14 Conversely, reduced concentrations have been associated with microangiopathy syndrome15 and deep vein thrombosis.16
Fibrinogen shows a trinodular structure with distal D regions on both ends consisting of the Bβ- and γ-chain C-terminal domains, whereas the central E region comprises the N-terminal sequences of all polypeptide chains.3,4 Transmission electron microscopy shows that the αC-terminal regions fold back and interact with the E region.17 Thrombin interacts with the E region to release FpA and FpB, likely disrupting the interaction of the αC terminus with the E region.18 In addition, release of the fibrinopeptides exposes knobs A and B in the E region, which interact with their specific binding pockets in the D regions of another fibrin molecule leading to protofibril formation. Lateral aggregation occurs between the protofibrils, which leads to fiber thickening.19 Variables such as pH, ionic strength,20 fibrinogen,21 factor XIII,22-24 and calcium25 affect clot structure. High concentrations of thrombin2,26,27 and prothrombin28 have been reported to lead to thinner and more densely packed fibers, which associate with thrombosis risk.29,30
Although previous studies have investigated the effects of thrombin and fibrinogen γ′ on the overall network structure of the clot,26,31,32 the intrafibrillar structure remains unexplored, and there is little information on the effects of these structural changes on the mechanical properties of fibrin. Therefore, our aim was to investigate the intrafibrillar structure of fibrin under fully hydrated conditions and understand the effects of changes in fiber structure on clot mechanical properties. We found that increasing thrombin concentrations lead to a considerable reduction in the number of protofibrils packed within the fibers, which is associated with reduced clot stiffness in purified systems, plasma, and whole blood. We also demonstrate that γA/γ′ decreases protofibril packing over a range of thrombin concentrations. These data indicate that protofibril packing is a major determinant of clot structure/stiffness and is regulated by both thrombin and fibrinogen γ′.
Methods
Fibrin preparations
In purified systems, clots were prepared in Tris-buffer saline (TBS; 50 mM Tris-HCl, 100 mM NaCl, pH 7.4) with 1 mg/mL (0.5 mg/mL for viscoelasticity measurements) fibrinogen (Merck Millipore, Darmstadt, Germany), 2.5 or 10 mM CaCl2, and 0.005 to 10 U/mL human α-thrombin (Sigma-Aldrich, St Louis, MO). This range was based on thrombin concentrations responsible for key substrate interactions in tissue factor-triggered whole blood.33 Normal pooled plasma was diluted 1/10 in TBS (0.3 mg/mL fibrinogen, measured by enzyme-linked immunosorbent assay [ELISA]) and supplemented with 10 mM CaCl2 and 0.1 and 1 U/mL human α-thrombin. Fibrinogen-deficient plasma (Merck Millipore) was diluted 1/10, supplemented with different fibrinogen mixtures (100% γA/γA; 60% γA/γA:40% γA/γ′; 91% γA/γA:9% γA/γ′; 100% γA/γ′) at a final concentration of 0.3 mg/mL, and the fibrin clot was formed by addition of 0.1 and 1 U/mL α-thrombin and 10 mM CaCl2.
Turbidimetric analysis of fibrin ultrastructure
Supplemental Methods, available on the Blood Web site, provides a detailed description of the turbidimetric analysis. In brief, clots were formed in 1-cm polystyrene cuvettes with a final volume of 300 μL and closed with parafilm to avoid dehydration. The clots were left to form for 24 hours at room temperature before scanning over 500 < λ< 780 nm (supplemental Figure 1) in a Λ 35 UV-Vis spectrophotometer (Perkin-Elmer, Cambridge, UK). Measurements were performed in triplicate.
Fibrin viscoelasticity
An in-house magnetic tweezers device was used to examine microrheology of fibrin as previously described.34,35 Super paramagnetic beads at 1:250 (v/v) (Dynabeads M-450 Epoxy; Invitrogen, Paisley, UK) were trapped by the forming fibrin network in a capillary tube (VitroCom), and their displacement was measured after 24 hours of clot formation (supplemental Movie 1). Both elastic and viscous shear moduli were calculated from the time-dependent compliance to obtain frequency-dependent moduli.36 Compliance was calculated from the ratio of the time-dependent shear strain (bead displacement) to the magnitude of the force applied. The elastic modulus or clot stiffness, G′, provides information about the energy stored during deformation. The loss modulus or viscous component, G″, provides information about energy loss during deformation. The loss tangent ( ) was calculated to evaluate the relative ratio between viscous and elastic properties. For a viscous material, tanδ >> 0 ie, G″ >> G′, whereas for an elastic solid, tanδ << 0, ie, G′ >> G″ . For a viscoelastic material with tanδ = 1, the amounts of energy dissipated and stored are equal. The values for both G′ and G″ were obtained at a frequency of 0.1 Hz. The displacement of 10 random particles was measured per sample, and each sample was studied in triplicate.
Atomic force microscopy
Atomic force microscopy was used to measure fiber diameters in fully hydrated conditions. Samples were prepared as described by Blinc et al.37 Fibrinogen and calcium chloride were premixed in a final volume of 20 μL and transferred to freshly cleaved mica, treated with 2 mM NiCl2. After addition of human α-thrombin, the solution was mixed and spread on the surface. The sample was allowed to polymerize for >90 minutes in a humidity chamber to prevent dehydration. After the clot was fully formed, the sample was rinsed with MilliQ water and washed five times with TBS. The clot was immersed in buffer and imaged in fluid Peak-Force tapping mode with a Nanoscope V MultiMode 8 (Bruker, Coventry, UK). The images were obtained using a NP-D cantilever (k = 0.06 N/m; Bruker) with a peak force frequency of 1 kHz, ∼200 pN, and peak force amplitude of ∼60 nm. Image processing and analysis were performed using Nanoscope Analysis v1.5 (Bruker). The radius of each fiber was determined by averaging 5 cross sections at half height of the fiber to minimize tip broadening effects (supplemental Figure 2). We also analyzed fiber diameter by average height, but due to softness of the fibers, they were somewhat compressed on the surface. For these reasons, we used half height measurements of the fibers as a more accurate representation of fiber diameter. Each clotting condition was prepared ≥3 times, and for each clot, a total of 25 random fibers were measured.
For details regarding normal pooled plasma, whole blood experiments, fibrinogen purification, fibrinogen γA/γ′ and γA/γA purification, total fibrinogen ELISA, fibrinogen γ′ ELISA, thromboelastometry analysis, transmission electron microscopy, scanning electron microscopy, and statistical analysis, see supplemental Methods.
Results
Thrombin reduces fiber radius under dried conditions
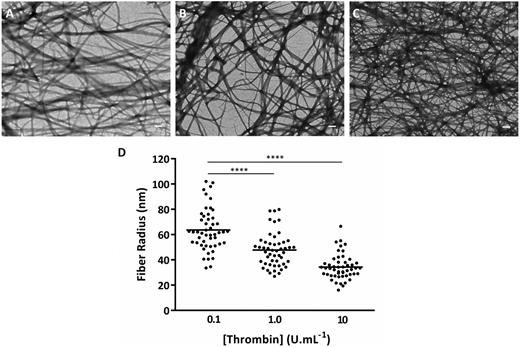
The effects of increasing thrombin concentration on fibrin made from human plasminogen-depleted IF-1 purified (which contains both γA/γA and γA/γ′) fibrinogen by transmission electron microscopy in dried conditions are shown in Figure 1. Increasing thrombin concentrations led to increased clot network density (Figure 1A) and decreased fiber radius (Figure 1B). The fiber radius decreased by 1.9-fold (from 63.6 ± 16.7 to 34.3 ± 9.9 nm; P < .001) for thrombin concentrations between 0.1 and 10 U/mL.
Thrombin effects on fibrin clot network and fibrin fiber size. Transmission electron microscopy images under dried conditions of fibrin clots made with human plasminogen-depleted IF-1 purified fibrinogen (1 mg/mL), CaCl2 (2.5 mM), and thrombin at concentrations of (A) 0.1, (B) 1.0, and (C) 10 U/mL. Scale bars, 500 nm. (D) Fibrin fiber radius obtained by measurement of n = 50 fibrin fibers at 0.1, 1.0, and 10 U/mL thrombin. The individually plotted data represent the dispersion of the fiber size within the clot, and the bar represents the mean value. Statistical significance, using a 1-way analysis of variance (ANOVA), is denoted with ****P < .001 for comparison between 0.1 U/mL and the remaining thrombin concentrations.
Thrombin effects on fibrin clot network and fibrin fiber size. Transmission electron microscopy images under dried conditions of fibrin clots made with human plasminogen-depleted IF-1 purified fibrinogen (1 mg/mL), CaCl2 (2.5 mM), and thrombin at concentrations of (A) 0.1, (B) 1.0, and (C) 10 U/mL. Scale bars, 500 nm. (D) Fibrin fiber radius obtained by measurement of n = 50 fibrin fibers at 0.1, 1.0, and 10 U/mL thrombin. The individually plotted data represent the dispersion of the fiber size within the clot, and the bar represents the mean value. Statistical significance, using a 1-way analysis of variance (ANOVA), is denoted with ****P < .001 for comparison between 0.1 U/mL and the remaining thrombin concentrations.
Thrombin reduces protofibril packing under wet conditions
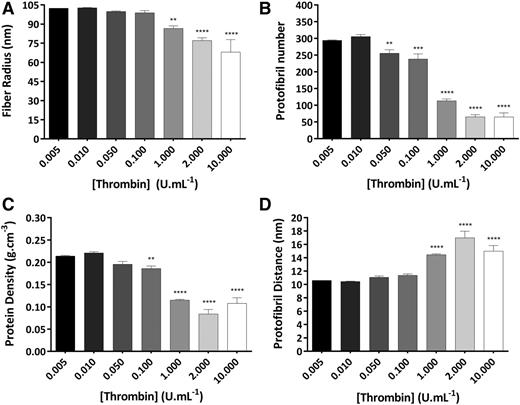
The effects of thrombin concentration on protofibril packing in wet conditions by turbidimetry are shown in Figure 2. Increasing thrombin concentrations led to decreased fiber radius (Figure 2A) and protofibril number per fiber (Figure 2B). Average fiber radius decreased 1.5-fold (from 102.4 ± 0.1 to 68.0 ± 9.8 nm; P < .001), whereas the number of protofibrils packed per fiber cross section decreased much more and by 4.5-fold (from 294.0 ± 1.4 to 64.9 ± 12.4; P < .001). Because the radius did not decrease to the same extent as the protofibril number, the protein density of the fibers decreased 2.0-fold (Figure 2C). The protofibril distance within fibers increased 1.4-fold at higher compared with lower thrombin (Figure 2D).
Thrombin effects on molecular structure of fibrin fibers in purified systems. Clots were made with human plasminogen-depleted IF-1 purified fibrinogen (1 mg/mL), thrombin (0.005-10 U/mL), and CaCl2 (2.5 mM) and analyzed by turbidimetry. (A) Fibrin fiber radius. (B) Number of protofibrils within fibrin fiber. (C) Protein density of fibrin fibers. (D) Distance between protofibrils inside of fibrin fibers. The results represent the mean values ± standard deviation (SD); n = 3. Statistical significance, using a 1-way ANOVA, is denoted with **P < .01, ***P < .005, and ****P < .001 for comparison between 0.005 U/mL and the remaining thrombin concentrations.
Thrombin effects on molecular structure of fibrin fibers in purified systems. Clots were made with human plasminogen-depleted IF-1 purified fibrinogen (1 mg/mL), thrombin (0.005-10 U/mL), and CaCl2 (2.5 mM) and analyzed by turbidimetry. (A) Fibrin fiber radius. (B) Number of protofibrils within fibrin fiber. (C) Protein density of fibrin fibers. (D) Distance between protofibrils inside of fibrin fibers. The results represent the mean values ± standard deviation (SD); n = 3. Statistical significance, using a 1-way ANOVA, is denoted with **P < .01, ***P < .005, and ****P < .001 for comparison between 0.005 U/mL and the remaining thrombin concentrations.
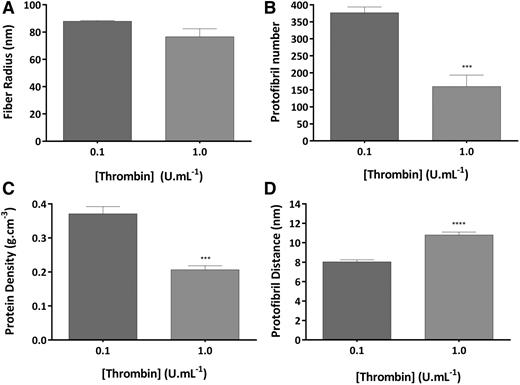
We also studied the effects of thrombin on fibrin intrafibrillar structure by turbidimetry in clots produced with plasma (Figure 3). Higher thrombin (1.0 U/mL) induced a decrease in the fiber radius of 1.2-fold compared with 0.1 U/mL thrombin (from 88.0 ± 0.5 to 76.5 ± 6.0 nm; Figure 3A), whereas the number of protofibrils packed per fiber was decreased by as much as 2.4-fold (from 376.9 ± 17.0 to 160.0 ± 33.4; P < .005; Figure 3B). The larger decrease in protofibril number relative to radius led to a 1.8-fold decrease in protein density at 1.0 compared with 0.1 U/mL thrombin (P < .005; Figure 3C). As per corollary, protofibril distance was increased 1.4-fold (P < .001; Figure 3D).
Thrombin effects on molecular structure of fibrin fibers in plasma. Clots were made with normal pooled human plasma (0.3 mg/mL), thrombin (0.1 and 1.0 U/mL), and CaCl2 (10 mM) and analyzed by turbidimetry. (A) Fibrin fiber radius. (B) Number of protofibrils within the fibrin fiber. (C) Protein density of fibrin fibers. (D) Distance between protofibrils inside the fibrin fibers. The results represent the mean values ± SD; n = 3. Statistical significance, using an unpaired t test, is denoted with ***P < .005 and ****P < .001 for comparison.
Thrombin effects on molecular structure of fibrin fibers in plasma. Clots were made with normal pooled human plasma (0.3 mg/mL), thrombin (0.1 and 1.0 U/mL), and CaCl2 (10 mM) and analyzed by turbidimetry. (A) Fibrin fiber radius. (B) Number of protofibrils within the fibrin fiber. (C) Protein density of fibrin fibers. (D) Distance between protofibrils inside the fibrin fibers. The results represent the mean values ± SD; n = 3. Statistical significance, using an unpaired t test, is denoted with ***P < .005 and ****P < .001 for comparison.
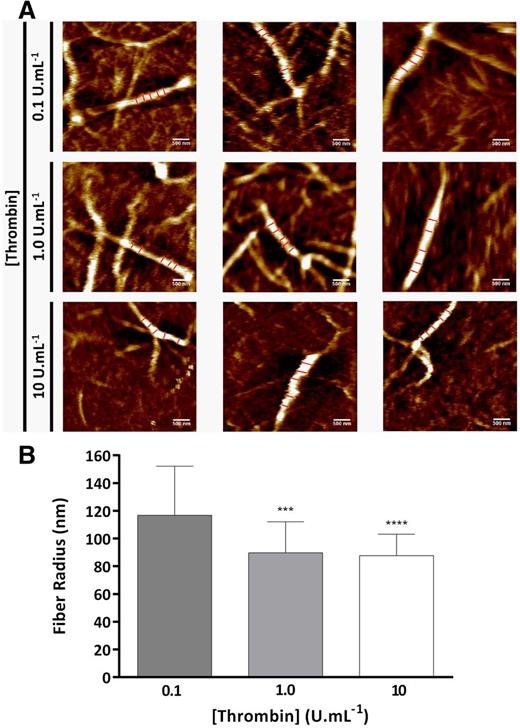
Atomic force microscopy was used to further investigate the effect of thrombin on fiber size under fully hydrated conditions (Figure 4A). Increasing thrombin decreased the fiber radius to a similar extent as observed by turbidimetry (1.3-fold decrease from 116.9 ± 35.3 to 87.7 ± 15.4 nm; P < .001; Figure 4B). The minimum thrombin concentration of 0.1 U/mL used in these experiments was chosen as this concentration did not differ from the lowest thrombin concentration (0.005 U/mL) when comparing fiber radius by turbidimetry (Figure 2A).
Thrombin effects on fibrin fiber size by atomic force microscopy. (A) Three representative atomic force microscopy images of fibrin fibers formed with human plasminogen-depleted IF-1 purified fibrinogen (1 mg/mL), 2.5 mM CaCl2, and 0.1, 1.0, and 10 U/mL thrombin. (B) Fibrin fiber radius obtained by atomic force microscopy in liquid at 0.1, 1.0, and 10 U/mL thrombin. Each image is 4 × 4 μm, the scale bar indicates 500 nm, and 5 cross sections along the fibrin fiber are shown that were used in fiber diameter calculations. The results represent the mean values ± SD; n = 25 fibers. Statistical significance, using a 1-way ANOVA, is denoted with ***P < .005 and ****P < .001 for comparison between 0.1 U/mL and the remaining thrombin concentrations.
Thrombin effects on fibrin fiber size by atomic force microscopy. (A) Three representative atomic force microscopy images of fibrin fibers formed with human plasminogen-depleted IF-1 purified fibrinogen (1 mg/mL), 2.5 mM CaCl2, and 0.1, 1.0, and 10 U/mL thrombin. (B) Fibrin fiber radius obtained by atomic force microscopy in liquid at 0.1, 1.0, and 10 U/mL thrombin. Each image is 4 × 4 μm, the scale bar indicates 500 nm, and 5 cross sections along the fibrin fiber are shown that were used in fiber diameter calculations. The results represent the mean values ± SD; n = 25 fibers. Statistical significance, using a 1-way ANOVA, is denoted with ***P < .005 and ****P < .001 for comparison between 0.1 U/mL and the remaining thrombin concentrations.
Protofibril packing and clot stiffness
We next investigated the effects of the protofibril packing on clot viscoelastic properties using magnetic tweezers and thromboelastometry. There was a clear tendency toward fibrin clots that were less stiff with increasing thrombin concentrations in purified systems. At 5.0 U/mL thrombin, clot stiffness decreased 2.6-fold compared with 0.1 U/mL, as shown by the decrease in storage modulus G′ (Table 1). Thrombin did not affect the energy dissipated within the clot, measured by the loss modulus G″. The relationship between loss modulus G″ and storage modulus G′ was calculated as the loss tangent, tanδ, which increased at higher thrombin concentrations. We also performed experiments in the absence of calcium, which showed that G′ decreased 1.8-fold, whereas G″ decreased 1.9-fold, with a minor, but not significant, decrease of tanδ at higher thrombin concentrations (supplemental Table 1).
Viscoelastic properties of fibrin clots produced with human plasminogen-depleted IF-1 purified fibrinogen analyzed with magnetic tweezers
| Thrombin, U/mL . | G′, Pa . | G″, Pa . | tan δ . |
|---|---|---|---|
| 0.1 | 0.677 ± 0.046 | 0.164 ± 0.010 | 0.242 ± 0.022 |
| 1.0 | 0.360 ± 0.051** | 0.255 ± 0.021 | 0.708 ± 0.116* |
| 5.0 | 0.259 ± 0.034**** | 0.126 ± 0.072 | 0.486 ± 0.285 |
| Thrombin, U/mL . | G′, Pa . | G″, Pa . | tan δ . |
|---|---|---|---|
| 0.1 | 0.677 ± 0.046 | 0.164 ± 0.010 | 0.242 ± 0.022 |
| 1.0 | 0.360 ± 0.051** | 0.255 ± 0.021 | 0.708 ± 0.116* |
| 5.0 | 0.259 ± 0.034**** | 0.126 ± 0.072 | 0.486 ± 0.285 |
Data represented as mean ± SD; n = 3. Statistical significance is denoted with *P < .05, **P < .01, and ****P < .001 for comparison between 0.1 U/mL and the remaining thrombin concentrations. G′, storage modulus; G″, loss modulus.
Effects of thrombin on the elastic properties of clots made with plasma and whole blood were studied using thromboelastometry. Although clot formation time was shorter, maximum clot firmness and consequently storage moduli were reduced in clots produced with high compared with low thrombin concentrations (Table 2; supplemental Figure 5). There were no major differences in clot formation rates between the thrombin concentrations (Table 2). Note that thrombin concentrations in these experiments were higher than in turbidimetric analysis of plasma (Figure 3), because plasma (which contains antithrombin, α2-macroglobulin, and other inhibitors) was diluted 10-fold for turbidimetry but used undiluted for thromboelastometry.
Thromboelastometric properties of fibrin clots produced with whole blood, normal pooled plasma, and fibrinogen-deficient plasma supplemented with γA/γA and γA/γ′ fibrinogen
| . | Whole blood . | Normal pooled plasma . | Fibrinogen-deficient plasma . | |||||
|---|---|---|---|---|---|---|---|---|
| γA/γA . | γA/γ′ . | |||||||
| Thrombin, U/mL | 1.0 | 10.0 | 1.0 | 10.0 | 1.0 | 10.0 | 1.0 | 10.0 |
| MC, mm | 60.0 ± 3.6 | 36.0 ± 11.1* | 25.7 ± 3.0 | 11.2 ± 3.3* | 20.5 ± 1.3 | 13.7 ± 4.2* | 12.7 ± 0.6# | 11.3 ± 2.1 |
| G, ×103, dyne/cm2 | 7.7 ± 1.1 | 3.0 ± 1.3* | 1.7 ± 0.3 | 0.6 ± 0.2* | 1.3 ± 0.1 | 0.8 ± 0.3* | 0.7 ± 0.0# | 0.6 ± 0.1 |
| CT, s | 81.5 ± 27.6 | 46.0 ± 27.7 | 76.7 ± 23.9 | 19.8 ± 10.5* | 131.3 ± 29.3 | 11.7 ± 5.9* | 204.3 ± 8.7# | 13.7 ± 5.5* |
| CFR, ° | 65.0 ± 5.6 | 59.7 ± 6.4 | 53.3 ± 8.0 | 58.3 ± 4.1 | 58.5 ± 1.7 | 71.0 ± 10.4 | 44.0 ± 5.3 | 59.3 ± 6.5 |
Data represented as mean ± SD; n = 3. Statistical significance is denoted with *P < .05 for differences between 1.0 and 10.0 U/mL thrombin and #P < .05 for comparison between γA/γA and γA/γ′ supplemented fibrinogen-deficient plasmas with the same thrombin concentration. CFR, clot formation rate; CT, clot formation time; G, storage modulus; MCF, maximum clot firmness.
γA/γ′ fibrin decreases protofibril packing
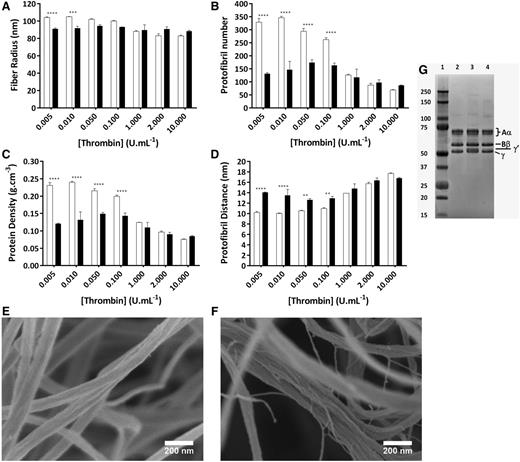
We also investigated the effects of thrombin on protofibril packing in clots produced with purified γA/γA and γA/γ′ fibrinogen (Figure 5). Increasing thrombin led to a modest decrease in the radius of γA/γA fibers by 1.3-fold (from 104.1 ± 0.4 to 83.0 ± 0.5 nm), whereas for γA/γ′ fibers, the radius remained unchanged (Figure 5A). At thrombin concentrations below 0.1 U/mL, the radius of γA/γA fibers was significantly higher than those produced with γA/γ′. At 2 U/mL thrombin, the radius of γA/γ′ fibers was slightly larger than that of γA/γA. This tendency was maintained for higher thrombin concentrations due to a continued decrease of radius for γA/γA fibers and the unchanged radius of γA/γ′ fibers. When we analyzed protofibril number per fiber, there was a marked difference between γA/γ′ and γA/γA at low thrombin concentrations. At thrombin concentrations <1 U/mL, γA/γ′ fibers showed a markedly reduced number of protofibrils (Figure 5B) and protein density (Figure 5C), whereas the distance between protofibrils was increased (Figure 5D) compared with γA/γA fibers. At high thrombin concentrations, these differences between γA/γ′ and γA/γA fibers largely disappeared.
Effect of γ′ on the molecular structure of fibrin fibers over a range of thrombin concentrations. Fibrin was made with 1 mg/mL purified γA/γA (white bars) or γA/γ′ (black bars) fibrinogen, 2.5 mM CaCl2, and a range of thrombin concentrations. (A) Fibrin fiber radius. (B) Number of protofibrils within fibrin fibers. (C) Protein density of fibrin fibers. (D) Distance between protofibrils inside the fibrin fibers. (E) Cold field scanning electron images of γA/γA and (F) γA/γ′ fibrin fibers both produced with 1 mg/mL fibrinogen, 0.1 U/mL thrombin, and 10 mM CaCl2 (scale bars, 200 nm). (G) Polyacrylamide gel electrophoresis of fibrinogen. Lane 1, molecular marker (kDa); lane 2, γA/γA fibrinogen; lane 3, γA/γ′ fibrinogen; lane 4, human plasminogen-depleted IF-1 purified fibrinogen. The results represent the mean values ± SD, n = 3. Statistical significance, using a 2-way ANOVA, is denoted with ***P < .005 and ****P < .001 for comparison between γA/γA and γA/γ′ at each thrombin concentrations.
Effect of γ′ on the molecular structure of fibrin fibers over a range of thrombin concentrations. Fibrin was made with 1 mg/mL purified γA/γA (white bars) or γA/γ′ (black bars) fibrinogen, 2.5 mM CaCl2, and a range of thrombin concentrations. (A) Fibrin fiber radius. (B) Number of protofibrils within fibrin fibers. (C) Protein density of fibrin fibers. (D) Distance between protofibrils inside the fibrin fibers. (E) Cold field scanning electron images of γA/γA and (F) γA/γ′ fibrin fibers both produced with 1 mg/mL fibrinogen, 0.1 U/mL thrombin, and 10 mM CaCl2 (scale bars, 200 nm). (G) Polyacrylamide gel electrophoresis of fibrinogen. Lane 1, molecular marker (kDa); lane 2, γA/γA fibrinogen; lane 3, γA/γ′ fibrinogen; lane 4, human plasminogen-depleted IF-1 purified fibrinogen. The results represent the mean values ± SD, n = 3. Statistical significance, using a 2-way ANOVA, is denoted with ***P < .005 and ****P < .001 for comparison between γA/γA and γA/γ′ at each thrombin concentrations.
Using high-magnification scanning electron microscopy, we observed a clear difference between γA/γ′ and γA/γA fibers. Fibers formed with γA/γA fibrinogen (Figure 5E; supplemental Figure 3) show a more rounded, compacted, and robust structure compared with γA/γ′ (Figure 5F; supplemental Figure 3) at 0.1 U/mL thrombin. Furthermore, γA/γ′ fibers unraveled into loose fibrils (Figure 5F; supplemental Figure 3). The thin fibrillar structures observed in γA/γ′ fibers demonstrate a diameter of <10 nm, which is consistent with the diameter of individual protofibrils. These data confirm the data obtained by turbidimetric analysis and show that γA/γ′ fibers are composed of loosely packed protofibrils that unravel into separate protofibrils at low thrombin concentrations.
γA/γ′ fibrin decreases protofibril packing in plasma
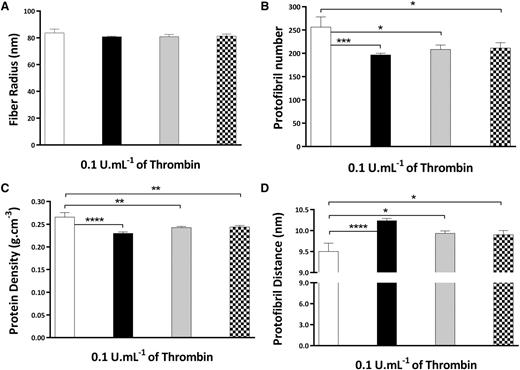
To test the effect of γA/γ′ on protofibril packing in plasma, we used fibrinogen-deficient plasma supplemented with purified γA/γA fibrinogen, γA/γ′ fibrinogen, and different ratios of γA/γA:γA/γ′ fibrinogen; 60%:40% (these relatively high ratios of γA/γ′ have previously been observed in healthy subjects38 ) and 91%:9% (normal ratio and that observed in human plasminogen-depleted IF-1 purified fibrinogen; supplemental Methods). When adding these fibrinogen mixtures to fibrinogen-deficient plasma, we found that for systems supplemented with different ratios of γA/γA and γA/γ′ fibrinogen, the radius remained largely similar at each of the thrombin concentrations tested (83.6 ± 2.9 nm for γA/γA and 80.8 ± 0.5 nm for γA/γ′ at 0.1 U/mL; Figure 6A), in agreement with the data in purified systems (Figure 5A). However, protofibril numbers in γA/γ′ fibrin produced in plasma were decreased to a similar degree (from 256.5 ± 21.6 to 196.7 ± 3.5; P < .05; Figure 6B), as those of γA/γ′ fibrin in a purified system at the same thrombin concentration (Figure 5B). Moreover, when we studied fibrinogen mixtures of different γA/γA:γA/γ′ ratios, significantly decreased protofibril numbers were observed at lower physiological ratios of 40% and 9% γA/γ′ (Figure 6B). As expected, these changes were associated with lower protein density in γA/γ′ fibers (Figure 6C) and increased space between protofibrils (Figure 6D). At higher thrombin, like in the purified system, protofibril composition was similar between γA/γA and γA/γ′ (supplemental Table 2; supplemental Figure 4).
Effect of γ′ on the molecular structure of fibrin fibers in plasma. Fibrinogen-deficient plasma was diluted 1/10 and supplemented with 0.3 mg/mL purified γA/γA (white bars), γA/γ′ (black bars), γA/γA:γA/γ′ 60%:40% (gray bars), and γA/γA:γA/γ′ 91%:9% (square patterned bars) fibrinogen, 10 mM CaCl2, and thrombin concentration of 0.1 U/mL. (A) Fibrin fiber radius. (B) Number of protofibrils within fibrin fibers. (C) Protein density of fibrin fibers. (D) Distance between protofibrils inside the fibrin fibers. The results represent the mean values ± SD; n = 3. Statistical significance, using a 1-way ANOVA, is denoted with *P < .05, **P < .01, ***P < .005, and ****P < .001 for comparison between γA/γA and the other fibrinogen systems. The quantitative data are presented in supplemental Table 2.
Effect of γ′ on the molecular structure of fibrin fibers in plasma. Fibrinogen-deficient plasma was diluted 1/10 and supplemented with 0.3 mg/mL purified γA/γA (white bars), γA/γ′ (black bars), γA/γA:γA/γ′ 60%:40% (gray bars), and γA/γA:γA/γ′ 91%:9% (square patterned bars) fibrinogen, 10 mM CaCl2, and thrombin concentration of 0.1 U/mL. (A) Fibrin fiber radius. (B) Number of protofibrils within fibrin fibers. (C) Protein density of fibrin fibers. (D) Distance between protofibrils inside the fibrin fibers. The results represent the mean values ± SD; n = 3. Statistical significance, using a 1-way ANOVA, is denoted with *P < .05, **P < .01, ***P < .005, and ****P < .001 for comparison between γA/γA and the other fibrinogen systems. The quantitative data are presented in supplemental Table 2.
γA/γ′ fibrin and clot stiffness
Finally, we studied the effects of γA/γ′ fibrinogen on plasma clot stiffness using thromboelastometry. Clots produced with fibrinogen-deficient plasma supplemented with γA/γ′ fibrinogen showed reduced maximum clot firmness and storage modulus, whereas clotting times were increased, compared with γA/γA at low thrombin concentration (Table 2; supplemental Figure 5). Interestingly, whereas for γA/γA fibrinogen we found similar effects of increasing thrombin on reducing clot stiffness as in whole blood and normal plasma, increasing thrombin concentrations did not significantly reduce clot stiffness in clots produced with γA/γ′ fibrinogen. This is in agreement with a major effect of increasing thrombin on reducing protofibril packing in clots produced with γA/γA fibrinogen, whereas the number of protofibrils packed per fibrin fiber is lower and generally remains low with increasing thrombin in clots produced with γA/γ′ fibrinogen (Figure 5).
Discussion
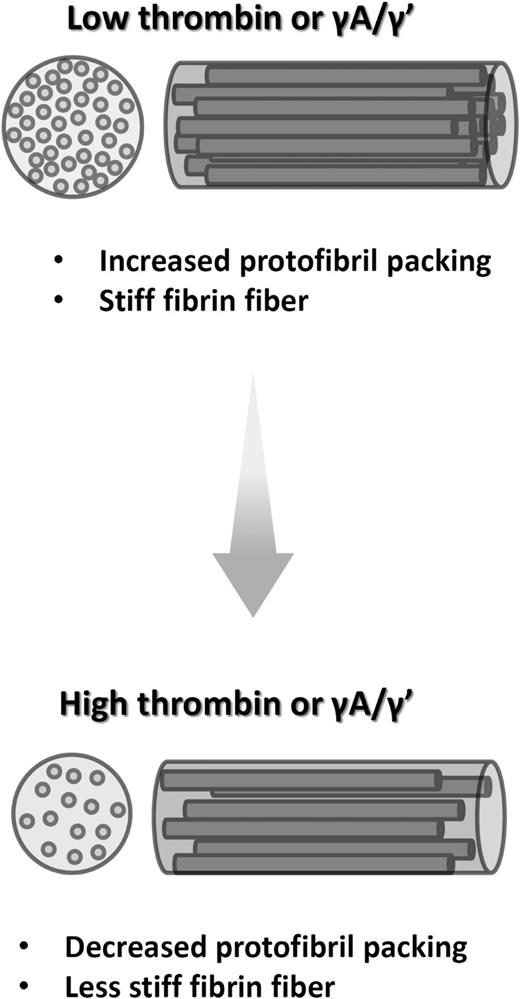
The intrafibrillar structure of fibrin was hitherto poorly understood. Our study shows that high thrombin concentrations lead to reduced protofibril packing in plasma and purified systems. We show that reduced protofibril packing contributes to a reduction in fiber radius after dehydration. Despite the well-characterized inhibitory effect of fibrinogen γA/γ′ on thrombin and thrombin generation,10,39,40 we find that γA/γ′ also reduces protofibril packing. Finally, we find that reduced protofibril packing is associated with clots that are less stiff. These data indicate that protofibril arrangements represent a major mechanism by which both thrombin and fibrinogen γA/γ′ regulate clot structure and function (Figure 7).
Schematic representation of the effects of thrombin and γ′ on hydrated fibrin fibers. Increased thrombin concentration, as well as replacement of γA/γA by γA/γ′, leads to formation of less compact fibrin fibers with lower protein density. This is associated with mechanical weakness of fibrin fibers under bloodstream shear.
Schematic representation of the effects of thrombin and γ′ on hydrated fibrin fibers. Increased thrombin concentration, as well as replacement of γA/γA by γA/γ′, leads to formation of less compact fibrin fibers with lower protein density. This is associated with mechanical weakness of fibrin fibers under bloodstream shear.
Electron microscopy has been widely used for measuring fiber diameter due to its high resolution compared with light microscopy.11,41-44 However, sample preparation for electron microscopy incurs potential structural modifications. Samples for transmission electron microscopy undergo drying or embedding in epoxy resins, which have a high viscosity and hygroscopicity, followed by preparation of a thin sample using, for example, a microtome and staining. It has been reported that fibrin fibers are composed of ∼20% protein and 80% water.45 Therefore, the dehydration procedure could lead to contraction of protofibrils, reducing fiber diameter. Samples for scanning electron microscopy are fixed and subjected to critical point drying to minimize artifacts; however, effects of dehydration on the sample cannot be excluded.
Optical turbidimetry represents the best method to analyze fibrin fiber diameter in physiologic conditions,46 and this method was recently optimized by Yeromonahos et al.47 Although the method was previously corroborated with x-ray scattering,47 it has not yet been validated by microscopy. We used turbidity alongside transmission electron, scanning electron, and atomic force microscopy to analyze fiber diameters and find that size measurements by turbidimetry are on average 2 times larger than diameters observed with electron microscopy. Low thrombin concentrations result in higher protein density, decreased distance between protofibrils, and less solvent content. Therefore, smaller contraction occurs during the dehydration procedure for electron microscopy, leading to the apparent formation of thicker fibers. As per corollary, high thrombin leads to more aqueous fibers and higher contraction during sample preparation, forming thinner fibers. We also performed atomic force microscopy under fully hydrated conditions, which confirmed the diameter measurements by turbidimetry. However, atomic force microscopy has its own limitations: clots are formed in a thin layer on the mica surface and hence potentially different from clots used in other measurements. Another limitation is that the atomic force microscope tip may move the fibers during measurements. However, major movements are visible as shifts/line-breaks in the images, and these moving fibers were excluded from the analysis. Notwithstanding these limitations, the similarities between fiber measurements obtained by atomic force microscopy and turbidimetry strongly support the aqueous nature of fibrin fibers.
High thrombin concentrations have previously been associated with highly branched fibrin network structures with small pores.2,26,27 The effects of thrombin concentration on protofibril packing may contribute to changes in fibrin network structure. A decrease in protofibril packing per fiber will lead to availability of “unused” protofibrils for the generation of additional fibers that branch and interweave to form the network. Therefore, reduced protofibril packing at high thrombin contributes to increased network complexity and reduced average pore size. Complex fibrin network structures as those produced with elevated thrombin are more resistant to fibrinolysis and thereby increase the risk for thrombosis.2,28,29
When coagulation is triggered with tissue factor, thrombin formation follows after a brief lagphase, exponentially increasing until it reaches a peak and then slowly decaying as thrombin is inhibited by its natural inhibitors in plasma.48 At its peak, thrombin reaches several hundred nanomolar (tens of units per milliliter).49 However, clot formation already occurs at <0.2 U/mL thrombin, and the vast majority of thrombin is produced after clotting takes place.33 Only 0.088 U/mL (0.84 nM) thrombin is required for factor XIII activation, 0.135 U/mL for fibrinopeptide A, and 0.177 U/mL for fibrinopeptide B release, 2 to 3 minutes after initiation of clotting in whole blood.33 We analyzed thrombin at 0.005 to 10 U/mL (0.048-96 nM), in close agreement with the range of thrombin concentrations responsible for the conversion of key substrates in tissue factor triggered blood coagulation.33 However, although in blood clotting, thrombin concentrations start around 0.001 U/mL and increase over time, we added fixed thrombin concentrations at the start of each experiment and incubated for 24 hours to allow for clot formation. This is a potential limitation of our method but represents the closest resemblance to the physiologic situation achievable with our setup.
A major feature of fibrin fibers is strain hardening on extension, thought to be important in resisting blood shear forces.50,51 The elastic behavior of fibrin has been attributed to conversion of the coiled coil α-helices to β-strands and partial unfolding of the γ-chain C-terminal domain.45,52,53 However, the physical properties that form the basis of fibrin mechanics remain largely unknown. Piechocka et al54 reported that the bundle-like structure of fibrin fibers is responsible for strain hardening properties of clots. Ryan et al43 proposed that the balance between fiber size and clot branching determines clot stiffness. We find that in addition to these mechanisms, the protofibril content within fibrin fibers is a possible major novel mechanism that regulates clot viscoelastic properties. Our data on the effect of thrombin on fibrin clot stiffness are in agreement with those reported by Ryan et al,43 who also found that increasing thrombin leads to decreased clot stiffness (G′). We now find similar effects of high thrombin on clot stiffness in purified systems, plasma, and whole blood.
The loss modulus G″ in our magnetic tweezers experiments remained similar with increasing thrombin resulting in an increase of loss tangent (G″/G′). This shows that the balance between viscous and elastic nature shifts toward viscous behavior with increasing thrombin, whereas overall behavior remains elastic. Ryan et al43 previously reported that increased thrombin concentration decreased the loss tangent. However, these studies were performed in the absence of calcium. When repeated in the absence of calcium, our experiments showed a minor, but not significant, decrease in loss tangent with increasing thrombin concentrations (supplemental Table 1). It is presently unclear how calcium influences the loss tangent, but our findings are based on physiologic calcium concentrations. Fibrin fibers extend to 300%,50 and a similar extension is also possible in whole clots.53 It has been suggested that fibrin extensibility is caused by protofibrils sliding relative to each other.54,55 Our data indicate that increased protofibril packing at low thrombin increases resistance to protofibril sliding and clot rigidity. A recent report showed that individual fibrin fibers produced with low thrombin were less likely to break when lysed with plasmin compared with fibers produced with high thrombin.56 Our findings of increased protofibril packing at low thrombin also provide a possible explanation for the fact that those fibers are less likely to lyse to the breakage point.
Physiologic γ-chain splice variation is a major source for fibrinogen heterogeneity.8 We find that γA/γ′ shows lower protofibril packing than γA/γA fibrin at thrombin concentrations ≤0.1 U/mL in purified and plasma solutions. Previous studies reported effects of γA/γ′ fibrinogen on overall clot structure also at higher thrombin concentrations.11,31,32,34 These studies focused on the early stages of fibrin formation and higher thrombin concentrations were required to allow for timely fibrin formation. In contrast, the effects of γA/γ′ on protofibril packing were demonstrated after 24 hours, therefore requiring lower thrombin concentrations. Interestingly, although γA/γ′ has been reported to inhibit thrombin and reduce thrombin generation,10,39,40 the effect of γA/γ′ on protofibril packing is similar to that of increasing thrombin concentration, ie, a lowering of the number of protofibrils packed per fiber. This indicates that the effects of γA/γ′ on fiber structure are not caused by thrombin inhibition but due to other mechanisms. It has been reported that the γ′-chain disrupts polymerization due to electrostatic or steric interference.31,34 Repulsive forces disrupting polymerization may reduce protofibril packing and increase intra-protofibrillar space. The average γA/γ′ concentration is ∼8% to 15% of total fibrinogen in normal plasma, and this may reach 40%.6,8,38 If we reconstitute fibrinogen-deficient plasma with fibrinogen mixtures, physiologic γA/γA:γA/γ′ ratios also decrease protofibril packing. Therefore, intrafibrillar protofibril arrangements likely play a role in the pathophysiologic effects of fibrinogen γA/γ′. Furthermore, we show that the intrafibrillar arrangements in γA/γ′ reconstituted plasma lead to less stiff clots compared with γA/γA. This occurs at thrombin concentrations where significant differences in protofibril number between the 2 systems exist.
In conclusion, we demonstrate that protofibril content of fibrin fibers is determined by thrombin concentration and fibrinogen γ′. Protofibril packing is closely associated with clot mechanical properties, whereby fibrin rigidity is increased with higher protofibril content, leading to enhanced fiber compactness. These findings show a major role for protofibril packing in the regulation of clot structure and fibrin elastic properties, thereby influencing clot strength and potentially the risk for thrombosis or thrombus embolization.
The online version of this article contains a data supplement.
The publication costs of this article were defrayed in part by page charge payment. Therefore, and solely to indicate this fact, this article is hereby marked “advertisement” in accordance with 18 USC section 1734.
Acknowledgments
This study was supported by the British Heart Foundation (RG/13/3/30104).
Authorship
Contribution: M.M.D., C.D., and F.L.M. performed experiments; M.M.D., C.D., F.L.M., S.D.C., and R.A.S.A. analyzed the results and made the figures; H.R.M., K.I.B., R.A.A., V.C.R., and H.P. contributed to discussion and interpretation of the data; all authors read and approved the final manuscript; and M.M.D., S.D.C., and R.A.S.A. designed the research and wrote the paper.
Conflict-of-interest disclosure: The authors declare no competing financial interests.
Correspondence: Robert Ariëns, Thrombosis and Tissue Repair Group, University of Leeds, LIGHT Laboratories, Clarendon Way, Leeds LS2 9JT, United Kingdom; e-mail: r.a.s.ariens@leeds.ac.uk.

This feature is available to Subscribers Only
Sign In or Create an Account Close Modal