Abstract
Introduction
Studies of patients with ischemic stroke and silent cerebral infarcts from sickle cell anemia (SCA) have revealed abnormalities of both large and small vessels. Cerebral blood flow (CBF), a measure of the microvascular perfusion of the brain, has been recognized as a potentially sensitive and specific indicator of early cerebrovascular impairment in both children and adults with SCA. Arterial spin labeling (ASL) MRI is a non-invasive technique to acquire perfusion-weighted signal. This is typically at a single post-labeling delay (PLD) and provides only CBF measurement. The addition of multiple PLDs also permits the measurement of arterial transit time (ATT), the transit time from the labeled plane to the imaging voxels. ATT is prolonged with stenosis and/or occlusion of large vessels. In order to allow detection of both small and large vessel disease simultaneously for SCA, we employed a 4D whole-brain ASL protocol to measure CBF and ATT concurrently.
Methods
Experiments were performed on a 3T Philips Achieva scanner using a 32-channel head coil for reception. Seven healthy volunteers (age 36 ± 8 yrs; 3M / 4F) and 5 SCA patients with no history of stroke, recent transfusion, or renal impairment (21 ± 3 yrs; 3M / 2F) were enrolled after informed consent. The clinical laboratory performed complete blood counts on venous blood obtained the same day.
The Pseudo continuous ASL (PCASL) sequence was implemented with 1000ms labeling duration and 12 PLDs (from 500 ms to 2700 ms in 200 ms intervals). A 3D acquisition scheme was employed with a field of view of 240 x 240 x 140 mm3 and acquisition resolution = 6.7 x 7.4 x 7 mm3. Total scan time was about 5 min. Fitting was performed per voxel using nonlinear-least-squares algorithm (Matlab) and maps of CBF and ATT were extracted concurrently. For each subject, five ROIs in the gray matter (frontal lobe, temporal lobe, parietal lobe, occipital lobe, and cerebellum) were manually drawn bilaterally from the corresponding anatomical image.
Results
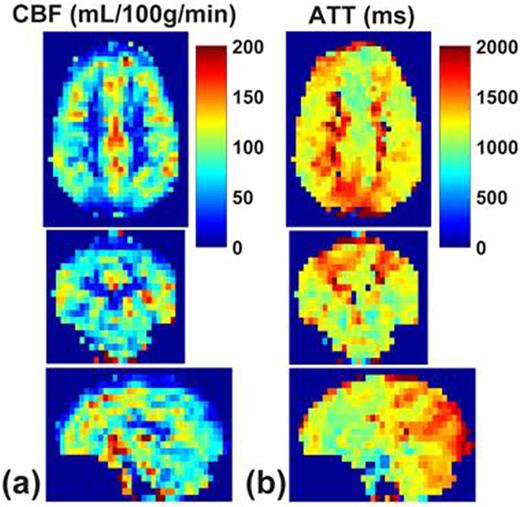
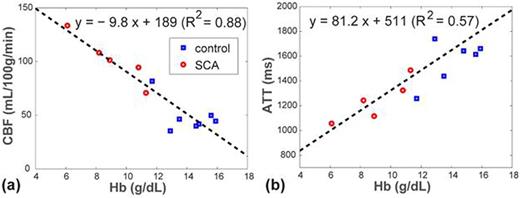
Figure 1 display representative CBF and ATT maps of a participant with SCA estimated from the multi-delay PCASL scans. CBF maps (Figure 1a) were found to be uniform within the gray matter. White matter has lower CBF than gray matter and shows a longer transit time as expected. ATT maps (Figure 1b) reflected the heterogeneity between different brain regions. ATT values were about 200-400 ms shorter in the temporal lobe and medial frontal lobe, compared to the parietal/occipital lobes and cerebellum. Averaged CBF values from the five ROIs of all the subjects were calculated. For the control group (Hb = 14.1 ± 1.5 g/dL) and SCA group (Hb = 9.1 ± 2.1 g/dL), the mean CBF values were 49 ± 15 mL/100g/min vs 102 ± 23 mL/100g/min, and the mean ATT values were 1662 ± 317 ms vs 1245 ± 171 ms, respectively. Linear regression identified significant correlations between mean CBF and hemoglobin: CBF = - 9.8 Hb + 189 (r = -0.94; p < 0.001) and ATT = 81.2 Hb + 511 (r = 0.76; p = 0.004) (Figure 2).
Discussion
We have successfully implemented a fast and non-invasive MRI technique to measure two perfusion metrics (CBF and ATT) with a whole-brain coverage on SCA patients. It was well established only using other perfusion imaging modalities that CBF, among subjects with normal hemodynamic regulation and without neurovascular impairment, is inversely correlated with hemoglobin concentration. Conversely, a linear correlation between ATT and Hb is expected as a result of adaptive vasodilatation and lower blood viscosity. Our study's cross-subject validation of this relationship using the multi-delay PCASL method with 3D acquisition shows the potential of this technique to accurately define blood flow from both small and large vessels. This may be useful to identify people with SCA at increased risk of brain injury from silent cerebral infarct and stroke.
Representative CBF (a) and ATT (b) maps acquired with 3D whole-brain coverage in axial, coronal and sagittal planes.
Representative CBF (a) and ATT (b) maps acquired with 3D whole-brain coverage in axial, coronal and sagittal planes.
No relevant conflicts of interest to declare.
Author notes
Asterisk with author names denotes non-ASH members.


This feature is available to Subscribers Only
Sign In or Create an Account Close Modal