Abstract
Risk stratification tools in multiple myeloma (MM), such as the International Staging System (ISS) and the revised-ISS (R-ISS), have improved understanding of survival expectations using the strongest known predictors at time of diagnosis. Given their value at diagnosis, these have been used to define risk after first relapse in clinical trials and standard practice. Although these tools have not been validated in this setting, their use arises because of the need to better characterize patients in order to define survival expectations and treatment decisions. Once the patient has relapsed, there are additional variables that may need to be considered in order to systematically assess patient risk, understand drivers of disease progression and ensure that treatment strategies are aligned with patient risk. Using data from the Czech Registry of Monoclonal Gammopathies (RMG), this study assessed predictors of overall survival (OS) and developed a new Risk Stratification Tool (RST) to predict OS at time of treatment decision after first relapse (TTD1).
The RST was developed by estimating the strongest predictors of OS at both diagnosis and TTD1 to define the final parameters for inclusion. The cut-offs for each parameter reflect conventional cut-offs used in clinical practice and some were supported by evidence using a K-adaptive Partitioning for Survival (KAPS) approach, which stratified data based on distinct survival expectations. The hazard ratio (HR) of the selected predictors was used to assign a score per parameter at a patient level where missing data were entered with a contribution equal to 1. Using the full RMG data set at TTD1 (N=1418) the (KAPS) method was run to define 4 distinct group of patients based on survival expectations.
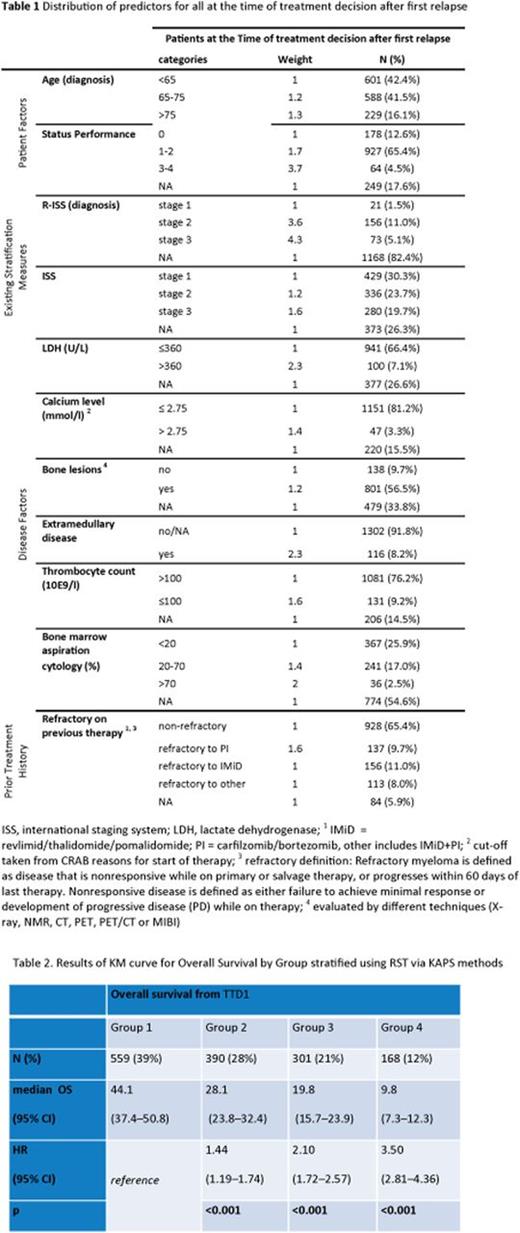
The RST consists of 4 dimensions and 12 item questions based on the strongest predictors of survival at TTD1, "Patient Factors" (age and Eastern Cooperative Oncology Group (ECOG) performance status), "Existing Stratification Factors (R-ISS at diagnosis and ISS at TTD1), "Disease Factors" (calcium level, number of bone lesions, extramedullary disease, thrombocyte count, clonal cells in bone marrow aspiration cytology, lactate dehydrogenase [LDH]) and "Treatment history" (refractory to prior therapy, time-to-next-treatment [from initiation of treatment of first anti-myeloma drug to initiation of treatment at first relapse]) (Table 1). Subsequently, we explored each group based on distribution of frailty-driven measures (age and ECOG) and aggressiveness of the disease (rest of parameters) to understand what is driving stratification.
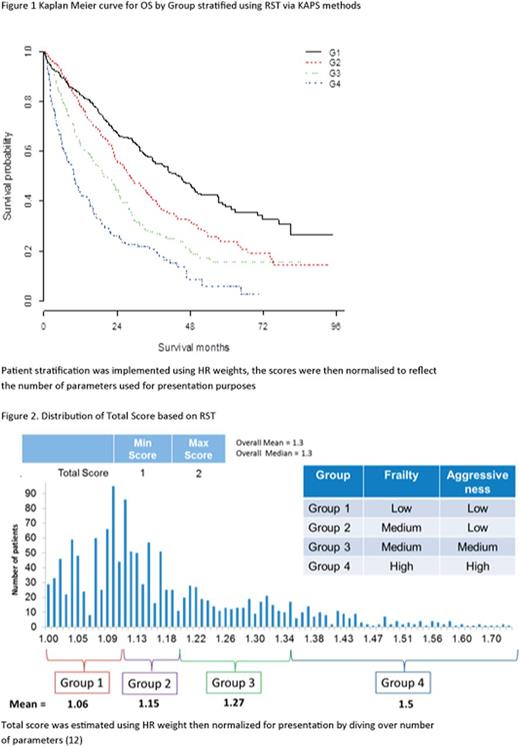
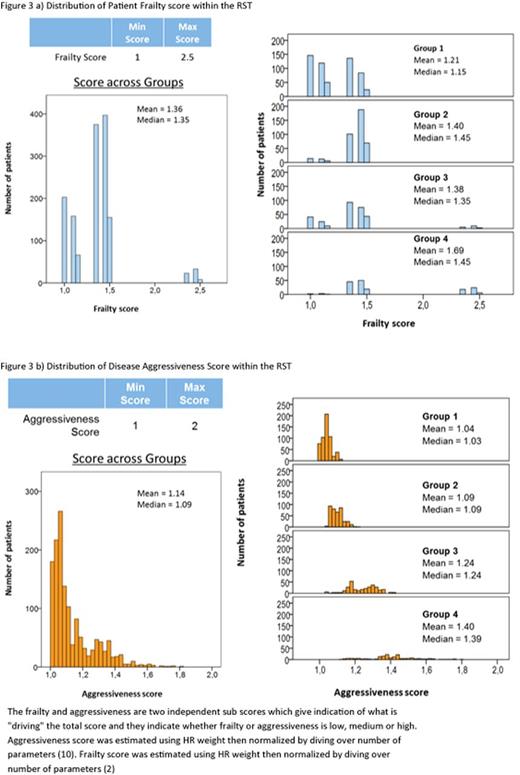
Figure 1 shows the KM curve of survival after TTD1 for each of the 4 groups estimated by KAPS. The new analysis shows strong differentiation in survival expectations between the 4 groups (Table 2), showing significantly different OS for all groups compared with reference. The median OS and Confidence Intervals per group did not overlap, supported by the positive association of HR across groups. The distribution of the Total Score (Figure 2) is between 1 and 2, which shows sufficient sensitivity to differentiate these groups by survival expectations. The RST can then be split into Frailty Score and Aggressiveness Score (Figure 3a & b) to understand what is driving disease severity. The distribution of these two scores shows that group 1 consists of low patient frailty and low disease aggressiveness, whereas group 4 shows high on both elements. Group 2 has an increased score for frailty and marginal increase in aggressiveness compared with group 1, and group 3 stratification is driven by an increase in aggressiveness over group 2.
The analysis showed that predictors, patient's experience of prior treatment and level of disease impact at the point of treatment decision after first relapse provided an initial framework to demonstrate strong differentiation between groups based on patient severity and what is driving patient risk (patient frailty vs aggressiveness of disease). The RST has shown promising results when applied to the RMG, however further validation of this work is required using other real-world and clinical trials data. Nevertheless, this analysis is a first step in systematically assessing patient risk to improve the selection of treatments based on improved understanding of patient profiles.
Hájek:Amgen: Consultancy, Honoraria, Research Funding; Janssen: Honoraria; BMS: Honoraria; Takeda: Consultancy; Celgene: Consultancy, Research Funding. Bouwmeester:Amgen: Consultancy. Treur:Amgen: Consultancy. DeCosta:Amgen: Employment, Other: Holds Amgen Stock. Campioni:Amgen: Employment, Other: Holds Amgen Stock. Delforge:Janssen: Honoraria; Celgene: Honoraria; Amgen: Honoraria. Raab:BMS: Consultancy; Celgene: Membership on an entity's Board of Directors or advisory committees; Janssen: Membership on an entity's Board of Directors or advisory committees, Speakers Bureau; Novartis: Consultancy, Research Funding; Amgen: Consultancy, Research Funding. Schoen:Amgen: Employment, Other: Holds Amgen Stock. Szabo:Amgen: Employment, Other: Holds Amgen Stock. Lucie:Amgen: Consultancy. Gonzalez-McQuire:Amgen: Employment, Other: Holds Amgen Stock.
Author notes
Asterisk with author names denotes non-ASH members.


This feature is available to Subscribers Only
Sign In or Create an Account Close Modal