Abstract
Background: Novel therapies and novel treatment paradigms such as post-transplant consolidation and/or maintenance therapies within the last decade have led to remarkable improvement in the survival of multiple myeloma (MM), the second most common hematologic malignancy seen in adults. Upfront autologous hematopoietic cell transplantation (AHCT) remains the standard of care in transplant-eligible patients. We analyzed trends in pre- and post-transplant therapies among patients undergoing AHCT for MM in the United States (US) using the Center for International Blood and Marrow Transplant Research (CIBMTR) database.
Methods: All first AHCT in the US (n=37705) using high dose melphalan for MM reported to the CIBMTR between 2004 and 2014 were included and a representative subset (n=5077) were included in subanalyses. During this period, the CIBMTR captured 60-80% of AHCT activity for MM in the US. Demographic, disease-related and treatment-related data were analyzed for trends. Data on use of individual chemotherapies for induction and post-transplant consolidation/maintenance were obtained (thalidomide, T; lenalidomide, R; bortezomib, V; cyclophosphamide, C; dexamethasone, D). Post-transplant therapies were available in the 2008-2014 cohort. Kaplan-Meier method was used to conduct survival analysis; PFS and OS analysis were compared 2004/05, 2006/07, 2008/09, 2010/11 and 2012/13 so that at least 3 years of actual follow up was available for all patients.
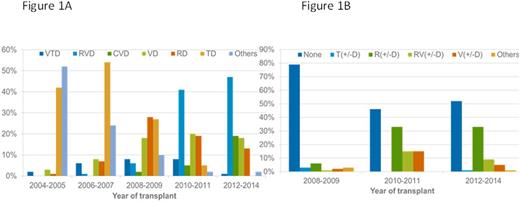
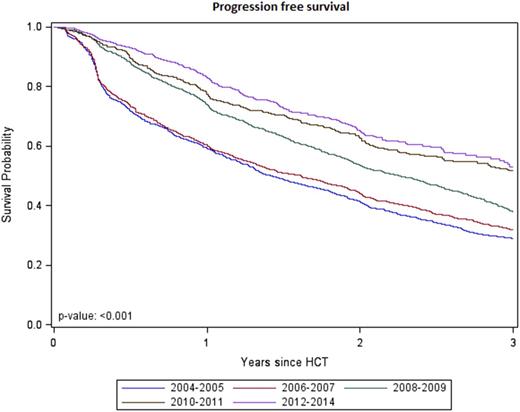
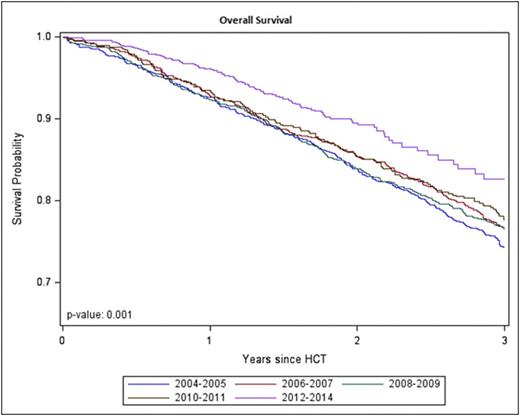
Results: The baseline demographic data for the 5077 patients (2004/05, N =1062, 2006/07, N=972, 2008/09, N=1156, 2010/11, N=566, 2012/14, N=1321) showed a median (range) age was 59 (20-82) years, with 58% males, 23% African Americans, 42% KPS <90%. International Staging System, ISS stage III was seen in 33%. 76% of patients underwent first AHCT in <12 months from diagnosis. 88% had chemosensitive disease (i.e. pre-AHCT response partial response or better), 85% of patients had melphalan dose 200 mg/m2. 27% had AHCT in <6 months of diagnosis, 49% 6-12 months, 14% 12-24 months and 9% >24 months. The median follow up of survivors was 68 months (1-135). Figure 1A shows the various induction regimen trends over the period. RVD is the most frequent pre-transplant induction regimen and used in 44% of induction regimens since 2010, followed by VD, CVD and RD. Planned post-transplant treatments (consolidation or maintenance) at day 100 were more frequent after 2010 (Figure 1B) with R being the most frequent maintenance agent. The frequency of maintenance utilization did not go up significantly from 2010 to 2014, and 51% of patients received post-transplant therapies during this period. Among the patients who died, myeloma remained the most common cause of death: 2004-2005, 70%; 2006-2007, 74%; 2008-2009, 76%; 2010-2011, 79% and 2012-2014, 75%. Survival data showed improvement in PFS over the study period with 3-year median PFS improving from 29 (26-32) months in 2004/05 to 32 (29-35) months in 2006/07 to 38 (35-41) months in 2008/09 to 52 (48-56) months in 2010/11 to 56 (50-61) months in 2012/13 (p-value <0.001) (Figure 2). Similarly, 3 year median OS also showed improvement in successive time periods; 74 (72-77) months in 2004/05 to 77 (74-79) months in 2006/07, 77 (74-79) months in 2008/09, 78 (74-81) months in 2010/11 to 83 (79-87) months in 2012/13 (p-value <0.001) (Figure 3).
Conclusions: This analysis shows that outcomes of upfront AHCT recipients for MM have improved in the last 10 years at a steady pace with a substantial improvement in the most recent cohort (Fig 3). RVD is currently the most common pre-transplant induction regimen since 2010. Approximately half of patients are placed on maintenance treatment after AHCT, with R as the most frequently used maintenance agent. Despite these impressive gains in the field, progression of MM remains the most frequent cause of death.
Induction regimens (A) and day-100 post-transplant maintenance (B) trends, 2004-2014
Induction regimens (A) and day-100 post-transplant maintenance (B) trends, 2004-2014
No relevant conflicts of interest to declare.
Author notes
Asterisk with author names denotes non-ASH members.


This feature is available to Subscribers Only
Sign In or Create an Account Close Modal