Abstract
Introduction. Targeting antigen-driven B-cell receptor (BCR) signaling with the BTK inhibitor ibrutinib is clinically effective against most B-cell lymphomas, including activated B-cell diffuse large B-cell lymphoma (ABC-DLBCL), but not germinal center B-cell (GCB) DLBCL. We have formally confirmed that GCB-DLBCL cell lines utilize tonic BCR signaling, by showing: 1) sensitivity (variable) to knockout (KO) of the BCR, SYK, and CD19; 2) dependence on CD79A ITAM phosphorylation; and 3) independence from BCR antigen specificity. However, uncertainty remains about molecular events in upstream parts of tonic BCR signaling, why dependence of GCB-DLBCL cells on tonic BCR signaling is variable, and their clinical relevance.
Methods. We used CRISPR/Cas9 methods to modify selected genes by KO and/or knock-in (KI) of the cDNA of a fluorescent protein (FP; e.g., GFP), with the FP serving as a marker of cells with gene KO or modification, or as a gene-fused tag for localization or quantitation. Cells expressing a membrane-targeted Forster resonance energy transfer (FRET) based AKT activity reporter (Lyn-AktAR2) were used to measure AKT activity directly by flow cytometry (FCM).
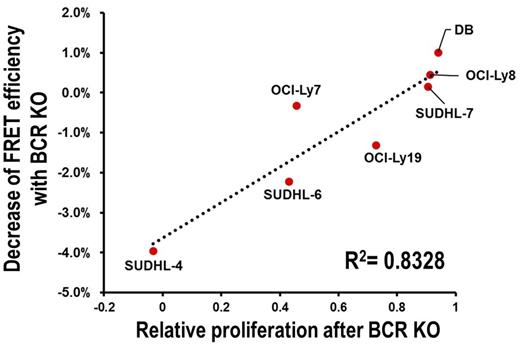
Results. The effect of KI of CD79A Y188F mutation alone was similar to complete BCR KO, implying that CD79A Y188 phosphorylation is essential for tonic BCR signal transduction. Western blot analysis of GCB-DLBCL cell lines after BCR KO showed variable decreases of AKT S473 phosphorylation (frequently used as surrogate measure of AKT activity), but these did not correlate well with the variable decreases in proliferation of GCB-DLBCL cell lines caused by BCR KO. Measuring AKT activity directly (Fig. 1), or by another indirect approach (surface expression of CXCR4, a target gene of FOXO1 inhibited by AKT activity), showed high correlation between decreases in AKT activity and proliferation after BCR KO. In contrast to the variable effect of BCR KO on growth, pan-AKT KO was uniformly growth-slowing in GCB-DLBCL lines (Fig. 2). Interestingly, baseline surface density of BCR units in GCB lines, quantified by FCM using CD79A-GFP KI cells or anti-CD79B staining, correlated highly with reduction in growth or AKT activity caused by BCR KO (Fig. 3). These findings lead us to conclude that the BCR contributes to AKT activation in GCB-DLBCL cell lines, to a variable degree determined by BCR surface density. We also conclude that BCR surface density is determined by cell line-specific factors, as well as immunoglobulin heavy (IgH) and light (IgL) hypervariable region (HVR) sequences, based on measurements of BCR surface levels after exchanging endogenous HVR sequences in OCI-Ly19 and OCI-Ly7 cell lines for HVRs derived from other GCB and ABC-DLBCL cell lines.
Reduction of AKT activity after BCR KO (measured by FRET reporter) and baseline BCR surface density in GCB-DLBCL cell lines also correlated well with the sensitivity of GCB-DLBCL lines to the clinically-tested SYK inhibitor (P505-15, PRT062607) or FDA-approved PI3K p110d isoform specific inhibitor (idelalisib). Interestingly, isogenic GCB-DLBCL cell lines with KO of PTEN, a negative regulator of AKT activation, were substantially more resistant to both inhibitors. A crucial role of PTEN deletion in overcoming dependence on tonic BCR signaling in GCB-DLBCL is supported by evidence from two naturally PTEN-deficient cell lines: SUDHL10, which adjusts to BCR KO and resumes normal growth, and HT, which lacks BCR expression, due to a frameshifting deletion in its IgH HVR. Re-expression of the BCR in HT, by KI to correct the IgH sequence, does not affect HT cell line growth.
Conclusion. Our findings suggest a biomarker-guided therapeutic strategy in GCB-DLBCL: targeting tonic BCR signaling in BCR-high patients, by inhibiting CD79A phosphorylation, SYK, or PI3K, and downstream targeting of AKT in BCR-low and/or PTEN-deficient patients.
Correlation of relative proliferation after BCR KO with decrease of AKT activity (as measured by FRET efficiency of AKT activity reporter) in GCB-DLBCL cell lines.
Correlation of relative proliferation after BCR KO with decrease of AKT activity (as measured by FRET efficiency of AKT activity reporter) in GCB-DLBCL cell lines.
Correlation of relative proliferation after BCR KO with baseline BCR surface density (as measured by flow cytometry of cells with CD79A-GFP fusion) in GCB-DLBCL cell lines.
Correlation of relative proliferation after BCR KO with baseline BCR surface density (as measured by flow cytometry of cells with CD79A-GFP fusion) in GCB-DLBCL cell lines.
Burger:Pharmacyclics: Research Funding. Westin:Chugai: Membership on an entity's Board of Directors or advisory committees; Spectrum: Membership on an entity's Board of Directors or advisory committees; Celgene: Membership on an entity's Board of Directors or advisory committees; ProNAi: Membership on an entity's Board of Directors or advisory committees.
Author notes
Asterisk with author names denotes non-ASH members.


This feature is available to Subscribers Only
Sign In or Create an Account Close Modal