Abstract
Introduction
The development of mass cytometry (CyTOF), using up to 40 concomitant tags for a given sample, has led to the generation of large databases. In order to properly analyze these extensive files, new software solutions have been devised using either mathematical reduction of multidimensional spaces or clustering methods allowing for two-dimensional representations. Such tools as SPADE (SPanning-tree progression Analysis of Density-Normalized events), t-SNE (t-Stochastic Neighborhood Embedding) and FlowSOM (Flow Self Organizing Map) therefore were published with CyTOF data. They have however seldom been used to analyze classical flow cytometry (FCM) data, although current instruments generate 10-12 parameters analyzes that would be good candidates for such analyzes. Here we report on the new paradigm of using such tools to interpret harmonized classical FCM data in particular for minimal residual disease (MRD).
Materials and Methods
Multiparametric FCM was performed using panels and recommendations proposed by the Harmonemia group (Lacombe F et al. Leukemia 2016), on a Navios® instrument (Beckman Coulter, Miami, FL) since 2013, yielding a cohort of diagnosis (D) and follow-up (FU) samples of 460 AML (160 D, 300 FU), 695 ALL (129 D, 566 FU), and 150 MDS (100 D, 50 FU). In parallel, 45 normal bone marrow (NBM) samples (respectively 22 for AML and MDS cases and 23 for ALL cases) were processed in the same conditions as pathological samples with the relevant immunophenotyping panels (three combinations for AML/MDS and 3 others for ALL). All files were first processed using specific R-software scripts and Bioconduct or CRAN packages to normalize fluorescence and light diffusion intensity including shift intensity, compensation and biexponential/logical adjustment. Harmonized flow cytometry files (HF) ([1305 pathological + 45 NBM files] x 3 panels corresponding to a total of 4050 HF files) were then generated and used for further analysis.
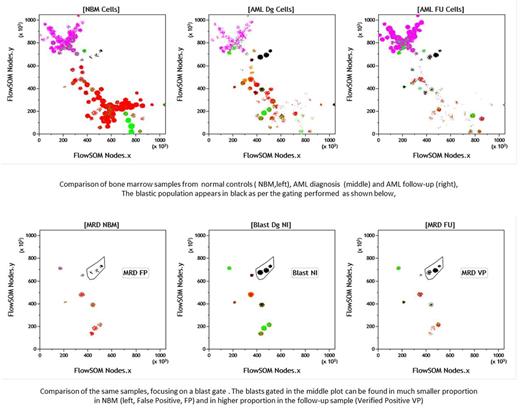
NBM files were adjusted and merged in a single, events-adjusted, representative file of NBM (R-NBM). For each case, merges of this R-NBM, D and FU files were processed using 3 different analysis ways 1) principal component analysis (PCA), 2) t-SNE and 3) FlowSOM. New resulting parameters were generated for each combination of R-NBM, D and FU merged files, i.e. PCA, t-SNE and FlowSOM. These parameters could then be analyzed using the Kaluza® software (Beckman Coulter). Graphical representations of all analyses were then performed in an automated unsupervised manner with Kaluza®, allowing for a direct comparison of NBM and pathological samples for each case. Interestingly, HF files generated by the R software, being integrated in the system, could also be classically analyzed by Kaluza®, in a supervised manner, by drawing gates around PCA/t-SNE clusters or FlowSOM nodes of interest. Such gates allowed to further analyze data by backgating on classical biparametric representations of antibody combinations as well as on the classical CD45/SSC bone marrow cartography.
Results
Both t-SNE and FlowSOM provide a clear identification of normal and abnormal subsets, while PCA is less discriminative. Comparative simultaneous representations of the three types of samples - (D), (FU) and (NBM)- allow for both a rapid visualization and accurate quantification of normal and abnormal cell subpopulations. The FlowSOM solution further allows to identify and visually characterize specific subsets both within the diagnostic clone and along normal hematopoietic differentiation. FU samples can then be easily analyzed for the persistence of abnormal immunophenotypic characteristics, both in AML and ALL. Even unsupervised results allow for a rapid appreciation and quantification of MRD. Besides, such comparisons, between NBM and D samples provide a new approach of the complexity of MDS. Moreover, both supervised and unsupervised results were comparable.
Conclusion
The combination of automated sophisticated multidimensional representation of numerous subsets and their in-depth analysis by classical manual tools of FCM analysis is a truly revolutionary approach. The strength of FCM, which retains and analyses morphological characteristics of the cells, is thus combined to the precision of mathematical analyzes developed for CyTOF. These versatile new tools open the way for a new era of classical FCM analysis in hematological malignancies.
Dupont: Beckman Coulter: Employment.
Author notes
Asterisk with author names denotes non-ASH members.


This feature is available to Subscribers Only
Sign In or Create an Account Close Modal