Key Points
MH on 18FDG-PET/CT may be a prognostic tool for PMBCL.
High TLG combined with high MH at presentation identifies patients at high risk for progression after conventional therapy.
Abstract
An important unmet need in the management of primary mediastinal B-cell lymphoma (PMBCL) is to identify the patients for whom first-line therapy will fail to intervene before the lymphoma becomes refractory. High heterogeneity of intratumoral 18F-fluorodeoxyglucose (18FDG) uptake distribution on positron emission tomography/computed tomography (PET/CT) scans has been suggested as a possible marker of chemoresistance in solid tumors. In the present study, we investigated the prognostic value of metabolic heterogeneity (MH) in 103 patients with PMBCL prospectively enrolled in the International Extranodal Lymphoma Study Group (IELSG) 26 study, aimed at clarifying the role of PET in this lymphoma subtype. MH was estimated using the area under curve of cumulative standardized uptake value-volume histogram (AUC-CSH) method. Progression-free survival at 5 years was 94% vs 73% in low- and high-MH groups, respectively (P = .0001). In a Cox model of progression-free survival including dichotomized MH, metabolic tumor volume, total lesion glycolysis (TLG), international prognostic index, and tumor bulk (mediastinal mass > 10 cm), as well as age as a continuous variable, only TLG (P < .001) and MH (P < .001) retained statistical significance. Using these 2 features to construct a simple prognostic model resulted in early and accurate (positive predictive value, 89%; negative predictive value, ≥90%) identification of patients at high risk for progression at a point that would allow the use of risk-adapted treatments. This may provide an important opportunity for the design of future trials aimed at helping the minority of patients who harbor chemorefractory PMBCL. The study is registered at ClinicalTrials.gov as NCT00944567.
Introduction
Tumor heterogeneity describes the observation that cancer cells can show variable phenotype profiles, including cell morphology, gene expression, metabolism, motility, proliferation, and metastatic potential; this complex phenomenon also reflects genome instability and epigenetic variation and has been associated with differences in outcome across several cancer types.1-3 Because malignant tumors comprise a heterogeneous mixture of functionally distinct cells that may differ widely in their responses to therapy, it is possible that high heterogeneity may correspond to acquired and innate resistance, leading to incomplete responses and treatment failure.4
Positron emission tomography/computed tomography (PET/CT) with 18-fluorodeoxyglucose (18FDG) is emerging as a means to characterize the metabolic patterns of intratumoral heterogeneity.5,6 The intratumoral distribution of 18FDG uptake reflects the glucose metabolism of both tumor and microenvironment, as well as other processes including necrosis, apoptosis, proliferation, and angiogenesis.5,7,8 Increased metabolic heterogeneity (MH) has been correlated with treatment failure and poor prognosis in several solid tumors and in sarcoma,6,9-14 but very few data are available concerning MH in lymphomas.15,16
The International Extranodal Lymphoma Study Group (IELSG) 26 study was designed to evaluate the role of PET/CT in the treatment of primary mediastinal large B-cell lymphoma (PMBCL), a distinct clinicopathological and molecular subtype of diffuse large B-cell lymphoma arising from the B cells in the thymus. It is characterized by a rapidly progressive anterior mediastinal bulky mass, often with local invasion and compressive syndromes.17 PMBCL commonly affects young adults and is highly curable with aggressive immunochemotherapy regimens with or without radiotherapy, with 5-year survival rates higher than 90% in recent studies.18,19 However, it is crucial to maximize cure rates with initial therapy, as salvage treatment of the few patients failed by front-line therapy has extremely poor results.20,21 If it were possible to identify this important minority early, it would allow the development of risk-stratified approaches, but the International Prognostic Index (IPI) has limited utility in PMBCL22 because most patients present when the disease is localized, leaving an unmet need for reliable prognostic markers.
The IELSG26 study demonstrated that visual assessment of posttreatment PET/CT scans using a 5-point scale (Deauville score) can identify the patients who will be likely cured,19,23 and that baseline quantitative 18FDG-PET/CT parameters, the maximum standardized uptake value (SUVmax), the metabolic tumor volume (MTV), and the total lesion glycolysis (TLG) can be powerful predictors of PMBCL outcomes.24,25
The IELSG26 study also showed that PMBCL, generally limited to a single bulky lesion, has distinctive metabolic characteristics that may make MH more reproducible and more easily studied than in other lymphomas. As a consequence, we characterized the MH patterns in the IELSG26 cohort of PMBCL and examined the prognostic value of MH alone or combined with other functional PET parameters. Here we report the results of this assessment.
Methods
Patient population
MH was estimated on baseline 18FDG-PET/CT in 103 of 125 patients with histologically proven PMBCL prospectively enrolled in the IELSG26 study (ClinicalTrials.gov identifier: NCT00944567). All were treated according to local policy with rituximab and doxorubicin-based immunochemotherapy regimens comprising either R-CHOP (rituximab plus cyclophosphamide, doxorubicin, vincristine, and prednisone) or R-CHOP-like, R-VACOP-B (rituximab plus etoposide, leucovorin, doxorubicin, cyclophosphamide, vincristine, prednisone, and bleomycin), or R-MACOP-B (rituximab plus methotrexate, leucovorin, doxorubicin, cyclophosphamide, vincristine, prednisone, and bleomycin) regimens. Infusional chemotherapy regimens were not used. Ninety-three patients also had consolidation mediastinal involved-field radiotherapy. Treatment details have been reported previously.19,23
The study was conducted in accordance with the precepts of the Helsinki declaration and received approval from the local research ethical committee of each participating center. All patients gave their written consent.
18FDG-PET/CT imaging procedures
PET/CT studies were performed following standard technical procedures for the acquisition and elaboration of PET imaging, according to guidelines at the time when the study was planned.26
Baseline PET scans were performed within 14 days before commencing immunochemotherapy. In cases in which urgent treatment was required and the PET scan could not be performed before therapy started, the baseline scan was omitted after discussion with the clinical coordinators; these cases were excluded from this analysis.
PET/CT imaging was performed on full-ring integrated PET/CT systems. Each center was required to follow an active quality control and quality assessment protocol.26 PET and CT images were acquired in the same session. CT scans obtained with a low-dose protocol were used for attenuation-correction of the PET images. All patients were fasted for at least 6 hours before the injection of 250 to 370 MBq (4.5 MBq/Kg) 18FDG. Blood glucose measured before injection of the radiotracer was less than 160 mg/dL in all patients. PET data were acquired in 2- or 3-dimensional mode from the midthigh toward the base of the skull after a standardized uptake time of 60 minutes (±5 minutes). The PET acquisition time was at least 3 minutes per bed position. Images were reconstructed with validated and commercially available iterative algorithms according to the local protocols, and SUVs were automatically calculated. For each examination, the PET/CT image data were sent to the core laboratory, where central review was performed.19,24
18FDG-PET/CT parameters
The 18FDG-PET/CT images obtained at baseline for initial staging were analyzed following a standard protocol on a dedicated workstation (Siemens SyngoMMWP Workstation VE36A; Siemens, Erlangen, Germany). Dedicated software (Syngo TrueD) automatically estimated the average and maximum SUV (SUVmean and SUVmax) and MTV of the entire mediastinal lesion, using an isocontour fixed threshold method based on 25% of the SUVmax, as previously described.24 The TLG, which represents the sum of the SUV of the different voxels included in the segmented volume, was calculated as the product of SUVmean and MTV.27
MH was assessed using the CSH method,13 as applied in previous studies in solid tumors.14-16,28-30 In CSH, the percentage of tumor volume (derived from PET-based tumor delineation methods31 ) with SUV above a certain threshold is plotted against that threshold value, which is varied from 0% to 100% of SUVmax (in this study, from 25% to 100%, according to the fixed threshold used for the MTV segmentation, therefore excluding intratumoral areas with absent or very low FDG uptake, mostly because of tumor necrosis). The area under the curve of CSH (AUC-CSH) is a quantitative index of tracer uptake heterogeneity in which lower values correspond to increased heterogeneity.32 MH value distribution in the study population was also evaluated by estimating the coefficient of variation of the intratumoral FDG uptake, which was calculated as the standard deviation of the SUV divided by the SUVmean of the segmented mediastinal lesion.5,16
The data were expressed as median and interquartile range (IQR). The PET-associated functional parameters were dichotomized using receiver-operating characteristic analysis to identify the optimal cutoff point.33 Progression-free survival (PFS) was defined according to the revised National Cancer Institute criteria34 and estimated using the Kaplan-Meier or life-table method, as appropriate.35 Follow-up was calculated as the median time to censoring, using a reverse Kaplan-Meier analysis.36 Differences between survival curves were analyzed by using the log-rank test.37 For multivariable analysis, Cox regression with a stepwise backward selection process was performed on dichotomized variables to estimate the hazard ratio (HR) and its confidence interval (CI).38 The exact 95% CIs were calculated for incidence percentages. Negative predictive values (NPVs) and positive predictive values (PPVs) were calculated according to standard definitions.39 Mann-Whitney U test was used to test differences between variables in 2 groups of patients.40 Association between 2 variables was investigated through regression and correlation analysis (Pearson’s coefficient). P values of .05 or less (2-sided test) were considered to indicate statistical significance. Statistical analysis was conducted using the STATA 11 software package (Stata: Release 11 Statistical Software; College Station, TX).
Results
Detailed clinical features and outcomes of the patients enrolled in the IELSG26 study have been published previously.19,23,24 Baseline PET/CT scans were available in 103 of 125 patients, having been omitted in 20 patients because of the urgency of treatment and excluded in 2 cases (after central control) for technical reasons. All patients were treated with rituximab and doxorubicin-based immunochemotherapy regimens comprising R-CHOP either every 14 or 21 days or at intensified doses (n = 16) or R-VACOP-B or R-MACOP-B regimen (n = 87). There was no difference in outcomes between the different chemotherapy regimens. Consolidation radiotherapy was considered standard policy in nearly all centers and was given to 93 patients. At a median follow-up of 62 months (IQR, 56-71 months), 12 patients had local progression during initial immunochemotherapy or within 3 months of its completion, and 1 relapsed (also in the mediastinum) 17 months after the treatment start. Six had died, with an estimated 5-year PFS rate of 87% (95% CI, 79%-92%).24
The main clinical characteristics of the 103 patients included in the present analysis and the description of the baseline functional PET parameters are summarized in Table 1.
Main clinical characteristics and functional PET parameters at presentation in the studied cohort (n = 103)
| Characteristics . | No. of patients (%) . | Median (IQR) . |
|---|---|---|
| Age, years | ||
| ≤60 y | 97 (94) | |
| ≤40 y | 75 (73) | |
| Female sex | 63 (61) | |
| ECOG Performance Status >1 | 15 (15) | |
| Mediastinal bulky disease >10 cm | 54 (52) | |
| Ann Arbor stage I-II | 97 (94) | |
| LDH > normal upper value | 77 (75) | |
| Low and low-intermediate IPI risk | 99 (96) | |
| Low and low-intermediate aaIPI risk | 82 (85) | |
| Front-line treatment | ||
| R-CHOP or R-CHOP like regimen* | 16 (16) | |
| R-VACOP-B or R-MACOP-B regimen* | 87 (84) | |
| With RT | 93 (90) | |
| SUVmax | 18.8 (15.5-23) | |
| Elevated (>22.2)† | 30 (29) | |
| MTV | 406 (267-641) | |
| Elevated (>703, PFS cut-point)† | 20 (19) | |
| TLG | 4261 (2363-6398) | |
| Elevated (>5814, PFS cut-point)† | 33 (32) |
aaIPI, age-adjusted IPI; LDH, serum lactate dehydrogenase; RT, consolidation mediastinal radiotherapy.
Details on the immunochemotherapy regimens and radiotherapy plans have been previously reported.19
Dichotomized using receiver operating characteristics analysis to identify the optimal cut point, as previously reported.24
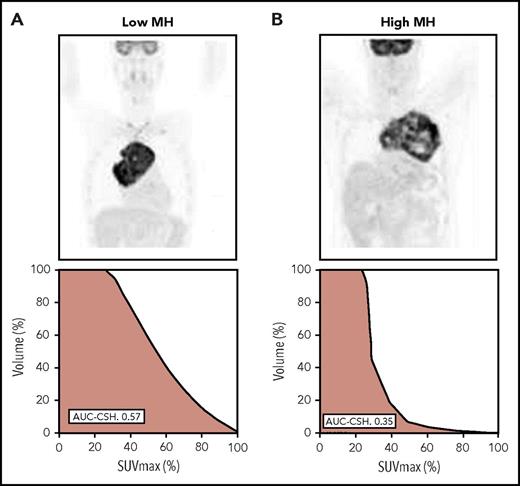
AUC-CSH in the whole population ranged between 0.32 and 0.65 (median, 0.49; IQR, 0.43-0.54). Figure 1 provides an example of patients showing different degrees of MH. The AUC-CSH and coefficient of variation methodologies provided a similar MH value distribution (see supplemental Data, available on the Blood Web site).
Examples of the various degrees of MH in primary mediastinal B-cell lymphoma. (A) PET imaging and the corresponding CSH histogram in a patients with low heterogeneity (AUC-CSH, 0.57). (B) PET imaging and the corresponding CSH histogram in a patient with high heterogeneity (AUC-CSH, 0.35). Lower AUC-CSH values correspond to higher metabolic heterogeneity.
Examples of the various degrees of MH in primary mediastinal B-cell lymphoma. (A) PET imaging and the corresponding CSH histogram in a patients with low heterogeneity (AUC-CSH, 0.57). (B) PET imaging and the corresponding CSH histogram in a patient with high heterogeneity (AUC-CSH, 0.35). Lower AUC-CSH values correspond to higher metabolic heterogeneity.
The values of MH, irrespective of the methodology used, did not show a significant relationship with other baseline quantitative PET-derived parameters, namely, SUVmax, MTV, and TLG (see supplemental Data), the only exception being a weak (r = −0.2) association with MTV when MH was measured using the AUC-CSH, which was not confirmed in multivariable analysis (data not shown).
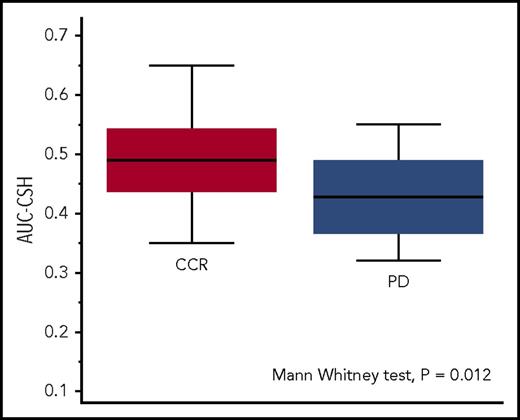
The receiver-operating characteristic analysis of the AUC-CSH values identified an optimal cutoff point of 0.45 to discriminate (P = .011) patients experiencing disease progression or relapse with sensitivity of 69% (95% CI, 39%-91%) and specificity of 72% (95% CI, 62%-81%). Patients with progression or relapse had significantly lower AUC-CSH (corresponding to higher MH) than those remaining in continuous remission (AUC-CSH, 0.43 [IQR, 0.37-0.47] vs 0.49 [IQR, 0.44-0.54]; Mann-Whitney U test P = .012; Figure 2).
MH in the patients with continuous complete remission (CCR, red box) and in those with lymphoma relapse or progression (PD, blue box). Lower AUC-CSH values correspond to higher metabolic heterogeneity.
MH in the patients with continuous complete remission (CCR, red box) and in those with lymphoma relapse or progression (PD, blue box). Lower AUC-CSH values correspond to higher metabolic heterogeneity.
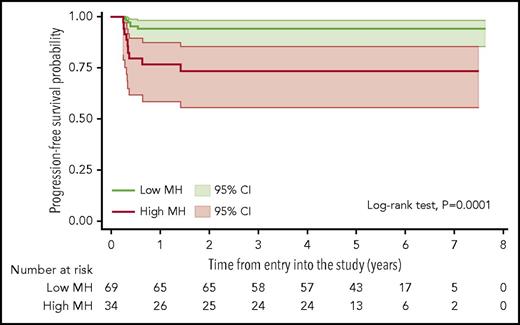
In univariate analysis of dichotomized parameters, PFS at 5 years was 94% (95% CI, 85%-98%) for patients with low MH and 73% (95% CI, 55%-85%) for those with high MH (log-rank test, P = .0001; Figure 3). MH showed no significant correlation to other baseline prognostic factors including individual IPI factors, the presence of bulky disease, or B-symptoms (data not shown). Patients with high MH had also a significantly worse overall survival (results shown in the supplemental Data).
Kaplan-Meier estimate of PFS according to the MH of the mediastinal lymphomatous mass in the baseline PET scans. Lower AUC-CSH values correspond to higher metabolic heterogeneity; shadows indicate 95% CIs.
Kaplan-Meier estimate of PFS according to the MH of the mediastinal lymphomatous mass in the baseline PET scans. Lower AUC-CSH values correspond to higher metabolic heterogeneity; shadows indicate 95% CIs.
In stepwise Cox models (see supplemental Data) including dichotomized MH, TLG, SUVmax, MTV, bulky disease (>10 cm), IPI, or aaIPI, as well as age as a continuous variable, only elevated MH (HR, 12.8; 95% CI, 3.3-49.9; P < .001) and elevated TLG (HR, 46.5; 95% CI, 5.8-373.8; P < .001) remained independently associated with significantly shorter PFS.
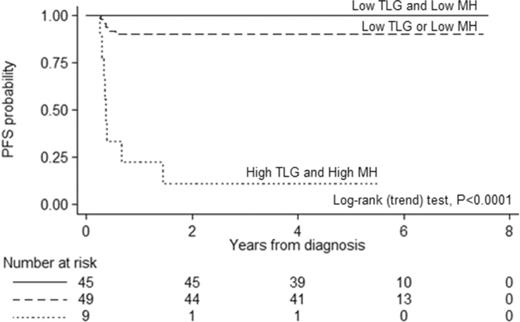
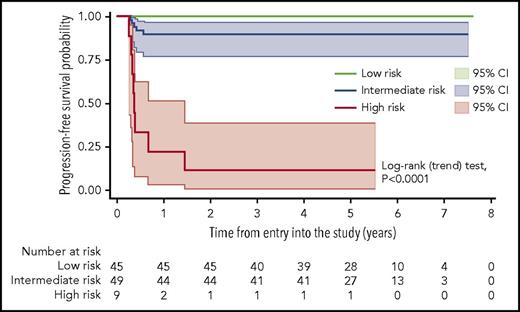
A prognostic model for PFS based on the combination of MH and TLG at baseline was then built and tested. It identified patients with significantly different outcomes (Table 2). In comparison with either MH or TLG alone, this model resulted in a much higher PPV without a detrimental effect on the NPV (Table 3) and confirmed a significantly poorer outcome in patients with both high TLG and high MH (HR, 31.2; 95% CI, 9.9-97.8; P < .001), whereas no treatment failure was seen in the group of patients with low TLG and low MH at baseline (Figure 4). These risk groups showed no association with conventional prognostic indices such as IPI/aaIPI or with specific clinical features in univariate analysis. Among the 9 patients with high TLG and high MH, only 2 had stage III disease and unfavorable IPI or aaIPI.
PFS survival according to risk groups defined by the model built on baseline TLG and MH
| Risk group and parameter . | N . | PD/relapse . | Median PFS . | 5-year PFS . | 95% CI . |
|---|---|---|---|---|---|
| Low risk | |||||
| Low TLG + Low MH | 45 | 0 | n.r. | 100% | __ |
| Intermediate risk | 49 | 5 | n.r. | 90% | 77-96% |
| Low TLG + High MH | 25 | 1 | n.r. | 96% | 75-99% |
| High TLG + Low MH | 24 | 4 | n.r. | 83% | 61-93% |
| High risk | |||||
| High TLG + High MH | 9 | 8 | 4.3 mo | 11% | 1-39% |
mo, months; n.r., not reached; PD, disease progression.
Comparison of the prognostic power of the model combining baseline TLG and MH vs either TLG alone or MH alone
| Parameter . | PPV (N) . | NPV (N) . |
|---|---|---|
| High MH | 26% (9/34) | 94% (65/69) |
| High TLG | 36% (12/33) | 99% (69/70) |
| High TLG + high MH | 89% (8/9) | 95% (89/94) |
| Low TLG + low MH, 100% (45/45) | ||
| High TLG or high MH, 90% (44/49) |
| Parameter . | PPV (N) . | NPV (N) . |
|---|---|---|
| High MH | 26% (9/34) | 94% (65/69) |
| High TLG | 36% (12/33) | 99% (69/70) |
| High TLG + high MH | 89% (8/9) | 95% (89/94) |
| Low TLG + low MH, 100% (45/45) | ||
| High TLG or high MH, 90% (44/49) |
Kaplan-Meier estimate of PFS according to a prognostic score based on the combination of MH and TLG at baseline, with shadows indicating 95% CIs. Low-risk patients are defined by the presence of both low MH and low TLG at presentation. The intermediate-risk group comprises the patients with either low MH and high TLG or high MH and low TLG. High-risk patients are defined by the presence of both high MH and high TLG. The trend test for the overall model was statistically significant, as well as the comparison (log-rank test) of the individual curves (low risk vs intermediate risk, P = .0286; low risk vs high risk, P < .0001; intermediate risk vs high risk, P < .0001).
Kaplan-Meier estimate of PFS according to a prognostic score based on the combination of MH and TLG at baseline, with shadows indicating 95% CIs. Low-risk patients are defined by the presence of both low MH and low TLG at presentation. The intermediate-risk group comprises the patients with either low MH and high TLG or high MH and low TLG. High-risk patients are defined by the presence of both high MH and high TLG. The trend test for the overall model was statistically significant, as well as the comparison (log-rank test) of the individual curves (low risk vs intermediate risk, P = .0286; low risk vs high risk, P < .0001; intermediate risk vs high risk, P < .0001).
Discussion
Although treatment outcomes of PMBCL are generally favorable, there remains an important minority in whom the initial treatment fails, usually as a result of rapidly emerging chemorefractory disease, for which salvage treatments are often unsuccessful.20,21 The present study was aimed at the early identification of these patients. In a retrospective Italian series of 138 consecutive patients treated with CHOP or MACOP-B/VACOP-B (with radiotherapy in 75% of the cases, but without rituximab), all the patients with stable disease or progression during initial chemotherapy and all those relapsing after initial remission died of lymphoma, irrespective of first-line and salvage treatment type.21 Another retrospective study from the Princess Margaret Hospital in Toronto, Ontario, Canada, showed significantly inferior overall response to salvage chemotherapy (25% vs 48%) and overall survival rates after progression (15% vs 34% at 2 years) in 37 patients with relapsing or refractory PMBCL compared with a control group of 143 relapsing patients with other diffuse large B-cell lymphomas.20 Some studies have reported favorable outcomes in small groups of patients with chemosensitive relapse treated with autologous transplantation,41 and chemosensitivity before high-dose therapy emerged as the strongest predictor of survival in these patients.20,41 However, this can only be assessed when relapse has already occurred, and overall, the prognosis after recurrence is very poor.
Malignant tumor cells are heterogeneous in various respects; the factors contributing to cancer MH have mainly been studied in solid tumors and reflect cell metabolism, proliferation, blood flow, and hypoxia.5 There is increasing evidence that quantifiable imaging parameters can be used in vivo to provide valid and reproducible estimates of cancer heterogeneity.42 Increased MH on PET scans has been correlated with worse response to treatment in several solid tumors and may be an indicator of resistance to therapy.6,9-14 We have previously shown the prognostic effect of functional (quantitative) PET parameters such as SUVmax, MTV, and TLG in PMBCL at diagnosis.24 Given that 18FDG uptake is not homogeneous within the large mediastinal lesions that characterize PMBCL, we investigated the hypothesis that the degree of MH in PMBCL may have prognostic value and examined the relationship between baseline MH and other functional PET parameters.
There are no data on reproducibility of visual estimation of MH; several computational methods have been proposed for its calculation, and none has been clearly shown to be superior. We used the AUC-CSH, which has been widely described in the literature, mainly in solid tumors, but also in lymphomas.14-16,28-30 This methodology is straightforward to apply and has been shown to be highly reproducible.43 Moreover, as AUC-CSH is independent of tumor volume,32 the effect of segmentation can be controlled, making AUC-CSH particularly suitable for the study of PMBCL, where the presence of a bulky mass at presentation requires estimation of MTV, using the isocontour fixed threshold method, based on 25% of the SUVmax.44
The calculation of AUC-CSH using the segmented MTV, thereby excluding necrotic areas with absent or very low FDG uptake, resulted in the most accurate estimation of metabolic distribution. Moreover, we compared our results estimating MH with an alternative method based on the SUVmax coefficient of variation.5,16 The correlation between the 2 methodologies was good, and both generated superimposable results when the effect of MH on treatment outcome was analyzed.45
Our results illustrate that the heterogeneity of 18FDG uptake does not hinge on the main quantitative PET parameters, but may be an additional biomarker in PMBCL treated with aggressive immunochemotherapy and radiotherapy.
A major challenge in the treatment of PMBCL is the need to identify, at diagnosis, the few patients for whom initial therapy will fail and who then risk an extremely poor outcome. In our previous studies, we showed that the prognostic utility of functional PET parameters has a limitation in their low PPV.24 This led us to study whether the effectiveness of TLG for risk stratification could be improved by combining TLG with other clinical and imaging parameters. We showed that the combination of baseline TLG and posttreatment Deauville score results in a better PPV; however, this approach identifies poor-risk patients only after the standard immunochemotherapy is completed and does not allow a risk-tailored strategy from the outset, such as treatment intensification.25
Although the restricted sample size and low event rate precluded testing in a validation cohort, the present study indicates that the combination of TLG and MH may offer a tool for early identification of patients with a high risk for initial treatment failure, which can be tested in other studies. In comparison with either MH or TLG alone, the proposed model showed much greater ability to specify patients with very unfavorable outcomes, with a markedly improved PPV. Further studies are warranted to ascertain whether this subset of poor-risk patients carries specific biological features that may engender the observed chemoresistance.
Few previous studies, all in solid tumors, have addressed the prognostic utility of combining intratumoral MH with other functional PET parameters.46-48 Our observations are in keeping with the results of a study on oropharyngeal squamous cell carcinoma, in which MH was combined with TLG to build a risk score.46
In the present study, patients with PMBCL with both low MH and low TLG had a very favorable outcome and might be suitable for treatment deescalation. However, it must be noted that almost all patients had mediastinal irradiation, precluding any conclusion on the need for radiotherapy in this group.
In contrast, and more important, the combination of high MH and high TLG accurately identifies at diagnosis the few patients with very poor prognosis and may, therefore, represent a powerful tool to allow patients to be selected for more intensive treatment. If confirmed in other cohorts, this could inform the design of future clinical trials and may represent an important chance to reduce the number of patients with refractory PMBCL.
Presented in part at the 14th International Conference on Malignant Lymphoma, Lugano, Switzerland, 14-17 June 2017.
The online version of this article contains a data supplement.
The publication costs of this article were defrayed in part by page charge payment. Therefore, and solely to indicate this fact, this article is hereby marked “advertisement” in accordance with 18 USC section 1734.
Acknowledgments
The authors thank Rita Gianascio Gianocca for her editorial assistance and are also grateful for the valuable contributions of Marina Cesaretti and Carol J. Tyas in studying organization and data management. Finally, the authors also thank Georg Stüssi for critical reading of the manuscript.
The IELSG26 study has been supported by grants ICP OCS-01709-04-2005 and ICP OCS-02062-03-2007 from OncoSuisse and was endorsed by the Italian Lymphoma Foundation and by Cancer Research United Kingdom (CRUKE/06/035). The participation of the UK centers was coordinated by the Southampton Clinical Trials Unit. A list of centers and investigators participating to the IELSG26 study has been previously reported.19,24
Authorship
Contribution: L. Ceriani, L.M., and E.Z. designed the study, performed research, and analyzed the data; L. Ceriani, M.M., L. Cascione, P.W.J., and E.Z. wrote the paper; and all authors contributed to patient data collection or management, critically reviewed and approved the manuscript, and shared final responsibility for the decision to submit.
Conflict-of-interest disclosure: The authors declare no competing financial interests.
Correspondence: Emanuele Zucca, IELSG Operating Group, Ospedale San Giovanni, CH-6500 Bellinzona, Switzerland; e-mail: ielsg@eoc.ch.
References
Author notes
P.W.J. and E.Z. are joint senior authors.

This feature is available to Subscribers Only
Sign In or Create an Account Close Modal