

Key Points
Premature CD4+ T-cell aging and lymphopenia induced peripheral T-cell proliferation contribute to the pathogenesis of autoimmunity in pDGS.
Infections in pDGS represent, in most of the cases, a complication of anatomical anomalies rather than a feature of the immunodefect.

Abstract
DiGeorge syndrome (DGS) is a primary immunodeficiency characterized by various degrees of T-cell deficiency. In partial DGS (pDGS), other risk factors could predispose to recurrent infections, autoimmunity, and allergy. The aim of this study was to assess the effect of different factors in the development of infections, autoimmunity, and/or allergy in patients with pDGS. We studied 467 pDGS patients in follow-up at Great Ormond Street Hospital. Using a multivariate approach, we observed that palatal anomalies represent a risk factor for the development of recurrent otitis media with effusion. Gastroesophageal reflux/dysphagia and asthma/rhinitis represent a risk factor for the development of recurrent upper respiratory tract infections. Allergy and autoimmunity were associated with persistently low immunoglobulin M levels and lymphopenia, respectively. Patients with autoimmunity showed lower levels of CD3+, CD3+CD4+, and naïve CD4+CD45RA+CD27+ T lymphocytes compared with pDGS patients without autoimmunity. We also observed that the physiological age-related decline of the T-cell number was slower in pDGS patients compared with age-matched controls. The age-related recovery of the T-cell number depended on a homeostatic peripheral proliferation of T cells, as suggested by an accelerated decline of the naïve T lymphocytes in pDGS as well as a more skewed T-cell repertoire in older pDGS patients. These evidences suggest that premature CD4+ T-cell aging and lymphopenia induced spontaneous peripheral T-cell proliferation might contribute to the pathogenesis of autoimmunity in patients with pDGS. Infections in these patients represent, in most of the cases, a complication of anatomical or gastroenterological anomalies rather than a feature of the underlying immunodeficiency.
Introduction
DiGeorge syndrome (DGS) includes an association of cardiac anomalies, hypoparathyroidism, and a variable degree of T-cell deficiency as a result of impaired development of the thymus.1 It is most commonly associated with a microdeletion at chromosome 22q11.2 but a similar phenotype can be associated with coloboma of the eye, heart defects, atresia of the nasal choanae, retardation of growth and/or development, genital and/or urinary abnormalities, and ear abnormalities and deafness syndrome (CHARGE syndrome), deletion at chromosome 10p, or caused by certain embryopathic influences such as poorly controlled gestational diabetes. These have been reviewed elsewhere.2 In affected individuals, thymic development can range from complete failure (athymia) to completely normal.2 Athymic individuals are said to have complete DGS (cDGS) with absent T cells resembling severe combined immunodeficiency. cDGS occurs in no more than 1.5% of children born with 22q11.2 deletion. Those in whom the T cells are present in variably low numbers (<1500/mm3 during the first 3 years of life) are said to have partial DGS (pDGS).3-5 This has a wide spectrum of clinical features.5-8 About 60% of the patients may experience recurrent infections manifesting as sinusitis, otitis media (OME), bronchitis, and pneumonia,9 and these are secondary not only to the immunologic dysfunction but also to the anatomic abnormalities that often accompany the syndrome.2,7,10,11 Autoimmune and allergic manifestations are also frequently seen in DGS patients.9,12-14 Given the great variability of the clinical and immunological manifestations and that these patients are often followed by different specialists, it has been difficult to determine the contribution of each of these factors to the final phenotype. Moreover, even though, the T- and B-cell compartments have largely been studied in cross-sectional analyses by Sullivan et al,15-19 the exact contribution of the alterations of the immune system to the increased risk of developing infections, autoimmunity, and allergy has yet to be clarified. In this context, the aim of the present study was to evaluate the long-term variations of immune system homeostasis and to identify risk factors for the development of infections, autoimmunity, and allergy in patients with pDGS.
Methods
Patients
Patients under follow-up at the velocardiofacial clinic at Great Ormond Street Hospital (GOSH) between January 2004 and December 2016, with the clinical diagnosis of pDGS were included in the study. The study was approved by GOSH institutional review board. According to European Society for Immunodeficiencies criteria (http://www.esid.org), pDGS was defined as reduced CD3+ T cells (less than 1500/mm3 during the first 3 years of life) and at least 1 of the following: (1) cardiac defect; (2) laboratory or clinically manifested hypocalcemia; or (3) dysmorphic facies or palatal abnormalities. Patients with cDGS and atypical cDGS, defined according to European Society for Immunodeficiencies criteria, were excluded. All patients underwent genetic evaluation by fluorescence in situ hybridization or complete genome hybridization (CGH) array. Clinical and laboratory data were retrieved retrospectively from the clinical records. In particular, demographics, age at diagnosis, and information on cardiac, gastroenterological, and otolaryngologic manifestations; history of infections; and symptoms suggestive of autoimmune or allergic disease and immunization history were documented. Severe infections were defined as radiologically proven pneumonia or invasive infection in a normally sterile site and recurrent infections as >5 episodes of sinopulmonary or ear infections requiring antibiotics each year. Autoimmune cytopenia, autoimmune thyroid disease, and juvenile idiopathic arthritis were defined based on clinical and laboratory findings along with positive autoantibodies. Inflammatory bowel disease and eosinophilic esophagitis were confirmed through gut biopsy. The remaining autoimmune diseases were diagnosed based on the clinical and laboratory findings.
Laboratory analysis
Immunological data at diagnosis and during follow-up were retrospectively collected for all patients. Lymphocyte subpopulations were studied by flow cytometric analysis, as previously described.20 Naïve and memory T cells were assessed as CD45RA+CD27+ and CD45RA−CD27+. Absolute counts were obtained by multiplying the lymphocyte subset fraction by the absolute lymphocyte count obtained simultaneously. Normal ranges for lymphocyte subsets were based on published data.21-23 Data were also compared with 75 age range–matched controls, including patients with recurrent infections evaluated at GOSH for suspected immunodeficiency that was subsequently ruled out through laboratory investigations. Controls were excluded if suffering from an acute illness or chronic disease. T-cell receptor excision circle (TREC) levels were measured through real-time quantitative polymerase chain reaction. Age-related normal ranges for TREC levels were based on in-house unpublished data. T-cell clonality was assessed using T-cell antigen receptor Vβ (TCRVβ) chain spectratyping on the CD3, CD4, and CD8 populations, as previously described.24 According to in-house unpublished data, the spectratyping was defined skewed when the number of peaks per family was <7 and the number of Gaussian families was <10. Serum immunoglobulins were measured by rate nephelometry. A low immunoglobulin level was defined as <2 standard deviations below the age-related geometric mean. Specific antibody levels to pneumococcus were evaluated using the 23-valent pneumococcal immunoglobulin G (IgG) enzyme-linked immunosorbent assay in 78 patients. In 123 patients, a multiplex 13-valent serotype-specific antibody assay including 9 serotypes of the 13-valent pneumococcal conjugate vaccine, 6 of the 7-valent vaccine, and 4 nonvaccine types was performed. Because prior additional immunizations were not given, results to vaccine serotypes were interpreted in the light of presumed early life routine childhood immunization. IgG whole titer <50 μg/mL was considered as low25 and levels >0.2 μg/mL to at least 6/9 vaccine serotypes were deemed to be the long-term minimal protective levels, as previously proposed.25,26
Statistical analysis
The statistical software packages GraphPad, MedCalc, and SPSS were used for the statistical analyses and to produce all the graphs. All values are shown as means ± standard deviation. Two-tailed Student t test for independent samples and Fisher’s exact test were used to compare means and proportions, respectively. Values of P < .05 were considered statistically significant. Scatter diagrams were used to evaluate the variations of the single parameters with age. In all different diagrams for each patient, we included the value obtained at first visit. Multivariate binary logistic regression analysis was used to assess the effect of different contributors in 404 pDGS patients with all the clinical and laboratory data available. These factors included congenital heart defects; palatal anomalies; gastroesophageal reflux disease (GERD)/dysphagia; asthma/rhinitis; lymphopenia; low CD3%, CD4%, and CD8%; IgM levels persistently <0.03 mg/dL; hypogammaglobulinemia; and IgA deficiency. Different lymphocyte subsets were compared between the group with autoimmunity and the group without autoimmunity. When more than 1 value was available in patients with autoimmunity, we selected the value obtained at first visit. Values obtained while on immunosuppression were excluded. Because the age at first evaluation was significantly higher in the group with autoimmunity compared with the group without autoimmunity, leading to potential errors in the interpretation of the results, in the second group we selected the values obtained at the last follow-up visit, obtaining 2 groups with comparable mean age.
Results
Demographic features and genetic analysis
Between January 2004 and December 2016, 505 patients were followed at GOSH velocardiofacial clinic. Thirty-eight patients were excluded because of the lack of relevant clinical and laboratory data. A total of 467 patients (248 males) were included in the study. Mean age was 11 ± 5.91 years (range, 0.23-30.4 years). Genetic analysis revealed the presence of the 22q11.2 deletion in 460/467 patients (98.5%). In the remaining 7 patients, a duplication of the long arm of the chromosome 22 was identified in 3 cases, whereas in 4 patients there was no deletion detected, but the mother suffered from gestational diabetes. Information on the genetic test performed and deletion breakpoints was retrieved for 197 patients (42.2%). In the remaining patients, the results of genetic studies performed before the referral to GOSH were not provided. A total of 124 patients (62.9%) were diagnosed through fluorescence in situ hybridization and 71 patients through CGH-array. In 2 cases, TBX1 deletion was identified through quantitative polymerase chain reaction. The detailed results of the analysis were not available for 3 patients studied through CGH-array. Most of the patients (88.2%) carried an A-D deletion, 7.4% carried an A-B deletion, 2 patients (2.9%) carried an A-C deletion, whereas the B-D deletion, not including TBX1 was identified in just 1 patient (1.5%). In 8/460 (1.74%) patients, genetic analysis revealed additional alterations in association with 22q11.2 deletion, including chr17p12 duplication (associated with Charcot-Marie tooth disease type 1A), chr4q22.1q22.3 deletion, chr16p13 microduplication, chr6 inversion, chr2 deletion, mosaicism 45XO+XY, 47XXY, and heterozygous mutation in the neurofibromin gene (associated with type 1 neurofibromatosis). The median age at diagnosis was 1.56 years (range, 0.001-19.9 years; mean age, 3.05 ± 3.71 years). Eleven patients received an antenatal diagnosis; in 2 cases, this was performed because of a family history. In the remaining 9 cases, the diagnosis was based on the antenatal identification of congenital heart disease in 4 cases, talipes in 2 cases, and during the screening for Down syndrome in 2 cases. In 1 patient, the reason for the antenatal genetic analysis was not clarified.
Infections, autoimmunity, allergy, and malignancies
Recurrent or severe infections were reported in 288/447 (64.4%) patients evaluated (Table 1). A total of 283/447 patients (63.3%) suffered from recurrent upper respiratory tract infections (URTIs), with 67 of them (15%) requiring antibiotic prophylaxis, whereas 23/447 patients experienced severe infections. One patient suffered from vertically acquired HIV infection and was excluded from further analysis.
Infections, autoimmunity, allergy, and malignancies
| Infections | N (%) |
|---|---|
| Recurrent URTI | 283 (63.3) |
| Antibiotic prophylaxis | 67 (15) |
| Severe infections | 23 (5.1) |
| Recurrent pneumonia | 8 (1.8) |
| Coxsackie myocarditis | 1 (0.2) |
| Encephalitis | 1 (0.2) |
| Recurrent abscesses | 2 (0.45) |
| Slow separation of umbilical cord followed by prolonged inflammation | 1 (0.2) |
| Recurrent skin and soft-tissue infections | 2 (0.45) |
| Meningococcal septicemia | 1 (0.2) |
| Bronchiectasis or chronic changes on chest radiograph or CT scan | 5 (1.1) |
| Recurrent/persistent or severe viral or fungal infections | 5 (1.1) |
| Molluscum contagiosum | 1 (0.2) |
| Persistent oral thrush | 2 (0.45) |
| Esophageal candidiasis | 1 (0.2) |
| Chronic EBV infection | 1 (0.2) |
| Autoimmune manifestations | |
| Autoimmune cytopenia | 9 (2) |
| Neutropenia | 2 (0.4) |
| ITP | 3 (0.7) |
| Neutropenia + ITP | 2 (0.4) |
| Anemia + ITP | 1 (0.2) |
| Neutropenia + anemia + ITP | 1 (0.2) |
| Autoimmune thyroid disease | 7 (1.6) |
| Juvenile idiopathic arthritis | 6 (1.34) |
| Alopecia areata | 4 (0.9) |
| Inflammatory bowel disease | 3 (0.7) |
| Raynaud phenomenon | 3 (0.7) |
| Psoriasis | 3 (0.7) |
| Vitiligo | 2 (0.45) |
| Unclassified immune-mediated inflammatory lung diseases | 1 (0.2) |
| Diabetes mellitus | 1 (0.2) |
| Systemic lupus erythematous/juvenile dermatomyositis overlap | 1 (0.2) |
| Allergic manifestations | |
| Asthma | 61 (13.76) |
| Rhinitis/conjunctivitis | 21 (4.74) |
| Eczema/dermatitis | 28 (6.3) |
| Drug/food allergy | 22 (4.96) |
| Malignancies | |
| EBV-related mixed T- and B-cell lymphoproliferative disease | 1 (0.2) |
| Pineoblastoma | 1 (0.2) |
CT, computed tomography; EBV, Epstein-Barr virus; ITP, Immune thrombocytopenia.
Autoimmune disease was diagnosed in 35/446 (7.84%) patients (Table 1). Autoimmune cytopenia was the most common manifestation observed (9/446). Five patients suffered from more than 1 autoimmune manifestation. Mean age at the onset of autoimmunity was 7.8 ± 5.5 years (range, 0.5-17).
Allergic manifestations were reported in 108/443 patients (24.4) and malignancies in 2 patients (Table 1).
Extra-immunological factors predisposing to recurrent/severe infection
Table 2 summarizes the prevalence of the different clinical manifestations observed in the study group. Ear-nose-throat anomalies were identified, by lateral videofluoroscopy in 338/449 patients evaluated (75.3%) (Table 2). In 75 patients without any evidence of anatomical palatal abnormalities, targeted questioning revealed a history of swallowing difficulties (17 patients), risk of aspiration (9 patients), and nasal regurgitation (32 patients). Laryngotracheal anomalies were identified through microlaryngoscopy and bronchoscopy in 51 patients (11.3%)
Clinical manifestations in patients with DGS
| Systems | Major (signs/symptoms) | N (%) | Minor (signs/symptoms) | N (%) |
|---|---|---|---|---|
| Cardiovascular | Normal heart | 161 (35.3) | VSD | 100 (33.9) |
| Congenital heart disease | 295 (64.7) | Atrial septal defect | 16 (5.4) | |
| Conotruncal anomalies | 226 (76.6) | VSD, ASD | 28 (9.5) | |
| Tetralogy of Fallot | 58 (19.6) | PDA | 29 (9.8) | |
| Pulmonary valve stenosis/atresia | 46 (15.6) | PFO | 10 (3.4) | |
| Coarctation of the aorta | 3 (1) | Right-sided aortic arch | 31 (10.5) | |
| Vascular ring | 15 (5) | Right-sided aortic arch, aberrant subclavian artery | 15 (5) | |
| Aberrant subclavian artery | 12 (4) | |||
| Single coronary artery origin from right coronary sinus | 2 (0.7) | |||
| Left superior vena cava | 4 (1.3) | |||
| Dilated coronary venus | 1 (0.3) | |||
| MAPCAs | 21 (7.1) | |||
| Palatal and ear-nose-throat | Palatal anomalies | 222 (48) | Hypernasal/hyponasal speech | 35 (7.8) |
| Laryngotracheoesophageal anomalies | 51 (11.3) | Swallowing difficulties | 17 (3.8) | |
| Laryngeal web/subglottic stenosis/laryngeal atresia | 21 (4.7) | Risk of aspiration | 9 (2) | |
| Tracheomalacia/laryngomalacia | 30 (6.7) | Nasal regurgitation | 32 (7.1) | |
| Tracheoesophageal fistula | 5 (1.1) | Recurrent or chronic otitis media with effusion | 146 (32.5) | |
| Obstructive sleep apnea | 15 (3.3) | Hearing loss | 104 (23.2) | |
| Adenoidectomy/tonsillectomy | 28 (6.2) | Conductive defect | 97 (21.6) | |
| Mixed defect | 4 (0.9) | |||
| Sensorineural hearing loss | 3 (0.7) | |||
| Nasal polyposis | 1 (0.2) | |||
| Vocal cord palsy/dysphonia | 11 (2.4) | |||
| Absent nose and nostrils/choanal atresia | 2 (0.4) | |||
| Gastrointestinal | Feeding difficulties | 107 (24.1) | Constipation | 145 (32.7) |
| Gastrostomy | 36 (8.1) | GERD | 123 (27.8) | |
| Nissen fundoplication | 14 (3.2) | Recurrent vomiting | 10 (2.3) | |
| Food allergies | 10 (2.3) | Recurrent abdominal pain | 14 (3.2) | |
| Eosinophilic colitis | 3 (0.7) | Chronic diarrhea | 4 (0.9) | |
| Inflammatory bowel disease | 3 (0.7) | |||
| Umbilical hernia | 12 (2.7) | |||
| Esophageal atresia + duodenal atresia | 2 (0.45) | |||
| Anorectal malformations | 9 (2) | |||
| Anterior anus | 2 (0.45) | |||
| Imperforate anus | 4 (0.9) | |||
| Hirschsprung disease | 1 (0.2) | |||
| Anal prolapse | 1 (0.2) | |||
| Anal stenosis | 1 (0.2) | |||
| Diaphragmatic hernia | 2 (0.45) | |||
| Intestinal malrotation | 2 (0.45) | |||
| Pyloric stenosis | 1 (0.2) | |||
| Meckel diverticulum | 1 (0.2) | |||
| Necrotizing enterocolitis | 3 (0.7) | |||
| Intestinal pseudo-obstruction | 1 (0.2) |
ASD, atrial septal defect; MAPCA, major aortopulmonary collateral artery; PDA, patent ductus arteriosus; PFO, patent foramen ovale; VSD, ventricle septal defect.
Echocardiography revealed congenital heart disease in 295/456 patients (64.7%).
Gastrointestinal manifestations were observed in 294/443 patients (66.4%). In about 1/3 of the cases, GERD and feeding difficulties were confirmed by videofluoroscopy, ph-impedentiometry, or endoscopy. In the remaining patients with typical symptoms of GERD, the diagnosis was confirmed by the response to the treatment with proton pump inhibitors, in agreement with the pediatric GERD clinical practice guidelines.27
Immunological alterations
T-cell compartment
T-cell studies were performed in 416 patients. Low CD3 percentage was the most common T-cell defect (69.7%) followed by low CD3 number (56.4%). CD4 and CD8 compartment were similarly affected. In 41/416 patients (9.85%), CD4 levels were <500 cells/µL and 2 of them presented with CD4 <200 cells/µL. TREC levels were generally lower than the 10th centile levels for age-matched control samples, suggesting a reduced, but not absent, thymic output in the patient cohort (Figure 1). Eight of 15 patients (53.3%) aged >12 years vs 8/41 (19.5%) <12 years (P = .0203) showed abnormal TCRVβ spectratyping, with a non-Gaussian and skewed profile apparent, consistent with age-related deterioration (Figure 2). A highly skewed and sparse, non-Gaussian, abnormal spectratype was found in most of the patients’ CD8+ T cells (67.0%). The prevalence of autoimmunity and infections in patients with skewed vs normal spectratype was 26.6% vs 13.9% (P = .42) and 86.7% vs 75% (P = .47), respectively.
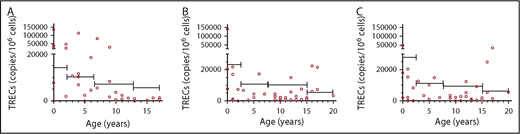
TRECs within different cell populations. (A) CD3+ T cells. (B) CD4+ T cells. (C) CD8+ T cells. In every panel, the bars indicate the 10th percentile levels for healthy children at different ages. The TREC content within the different cell populations is expressed as TRECs per million cells. TREC levels were variable but were generally lower than the 10th percentile levels for age-matched control samples.
TRECs within different cell populations. (A) CD3+ T cells. (B) CD4+ T cells. (C) CD8+ T cells. In every panel, the bars indicate the 10th percentile levels for healthy children at different ages. The TREC content within the different cell populations is expressed as TRECs per million cells. TREC levels were variable but were generally lower than the 10th percentile levels for age-matched control samples.
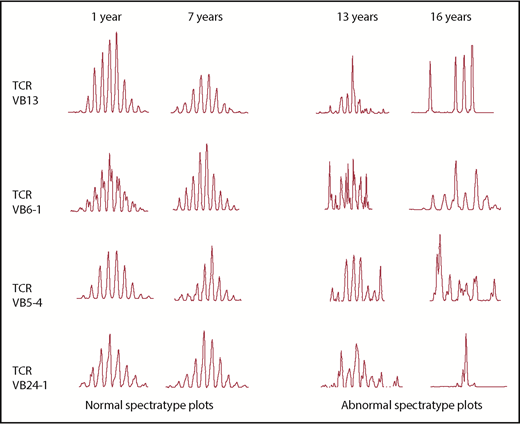
Examples of spectratyping by age. Examples of spectratypings of 4 different VB families obtained from 4 different patients studied at different ages. The 2 left columns represent examples of normal spectratyping in 2 pDGS patients studied at 1 and 7 years, respectively. The 2 right columns represent examples of abnormal spectratyping, with a non-Gaussian and skewed profile in 2 pDGS patients studied at 13 and 16 years, respectively.
Examples of spectratyping by age. Examples of spectratypings of 4 different VB families obtained from 4 different patients studied at different ages. The 2 left columns represent examples of normal spectratyping in 2 pDGS patients studied at 1 and 7 years, respectively. The 2 right columns represent examples of abnormal spectratyping, with a non-Gaussian and skewed profile in 2 pDGS patients studied at 13 and 16 years, respectively.
T-cell homeostasis during long-term follow-up
The study of the T-cell homeostasis during the first year of life, performed in 103 patients, showed an increase of the T-cell number during the first year and a reduction of the number of values below the 5th percentile levels for age-matched control samples between the 2 age groups (0-3 months vs 3-12 months, 92.85 vs 70.68%, P = .01) (Figure 3A). Apart from the first 3 months of life, T-cell percentage was always more affected than T-cell number (Figure 3B). The study of the T-cell compartment between 1 and 20 years of age revealed that the physiological age-related decline of the CD3+, CD8+, and CD4+ T-cell number is slower in pDGS patients compared with age-matched control (Figure 3C and Figure 4A-B). The number of patients with low CD3 count reduced with age, from 92.85% to 17.85% (p < .0001) (Figure 3B). As for the number of patients with low CD3%, it increased slightly and nonsignificantly between 0 and 1 year and then reduced from 83.54% to 63.30% (P =.0342) between 1 and 20 years (Figure 3B). Naïve CD4 and CD8% were lower in patients than in controls for all the age groups and, compared with controls, they declined more rapidly with age (Figure 4C-D). On the other hand, memory CD4 and CD8% were higher in patients than in controls and increased more rapidly with age (Figure 4E-F).
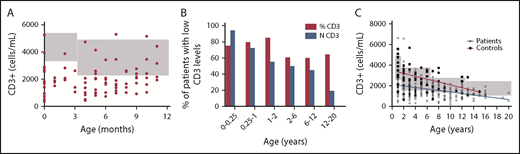
CD3+ T-cell homeostasis at different ages in patients with pDGS and controls. (A) CD3 absolute counts from pDGS patients in the first year of life. The gray boxes indicate the normal age-related ranges for absolute T-cell counts. Most of the values were below the 5th percentile levels for age-matched control samples. No variation in the number of the CD3+ T cells was observed during the first year of life. (B) Percentage of patients showing, at different ages, CD3 absolute counts (blue bars) or CD3% (red bars) below the 5th percentile levels for age-matched controls. Apart from the first 3 months of life, CD3% was always more affected than CD3 absolute count. The number of patients with low CD3 count reduced with age, from 92% to 37% (P < .0001). As for the number of patients with low CD3%, it increased between 0 and 1 year and then reduced from 85% to 54% (P < .0001) between 1 and 20 years. (C) CD3 T cells are lower in patients at all ages than in controls but have a slower rate of decline than controls. The gray boxes indicate the normal age-related ranges for absolute T-cell counts.
CD3+ T-cell homeostasis at different ages in patients with pDGS and controls. (A) CD3 absolute counts from pDGS patients in the first year of life. The gray boxes indicate the normal age-related ranges for absolute T-cell counts. Most of the values were below the 5th percentile levels for age-matched control samples. No variation in the number of the CD3+ T cells was observed during the first year of life. (B) Percentage of patients showing, at different ages, CD3 absolute counts (blue bars) or CD3% (red bars) below the 5th percentile levels for age-matched controls. Apart from the first 3 months of life, CD3% was always more affected than CD3 absolute count. The number of patients with low CD3 count reduced with age, from 92% to 37% (P < .0001). As for the number of patients with low CD3%, it increased between 0 and 1 year and then reduced from 85% to 54% (P < .0001) between 1 and 20 years. (C) CD3 T cells are lower in patients at all ages than in controls but have a slower rate of decline than controls. The gray boxes indicate the normal age-related ranges for absolute T-cell counts.
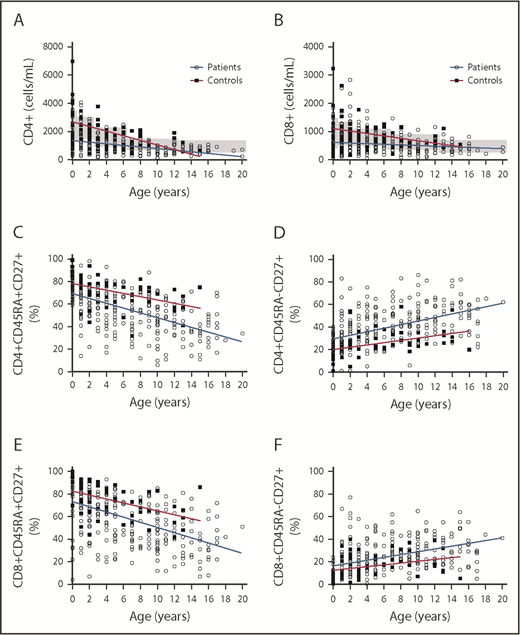
CD4 and CD8+ T-cell homeostasis at different ages and CD45RA and CD27 expression within CD4 and CD8 T cells in patients and controls. (A-B) CD4 and CD8 T cells are lower in patients at all ages than in controls but have a slower rate of decline than controls. The gray boxes indicate the normal age-related ranges for absolute T-cell counts. (C-F) The decline of naïve CD45RA+CD27+ and the accumulation of memory CD45RA−CD27+ T cells within the CD4 and CD8 populations (expressed as a percent of the CD4 and CD8 populations, respectively) is greatly accelerated in patients compared with controls.
CD4 and CD8+ T-cell homeostasis at different ages and CD45RA and CD27 expression within CD4 and CD8 T cells in patients and controls. (A-B) CD4 and CD8 T cells are lower in patients at all ages than in controls but have a slower rate of decline than controls. The gray boxes indicate the normal age-related ranges for absolute T-cell counts. (C-F) The decline of naïve CD45RA+CD27+ and the accumulation of memory CD45RA−CD27+ T cells within the CD4 and CD8 populations (expressed as a percent of the CD4 and CD8 populations, respectively) is greatly accelerated in patients compared with controls.
Humoral immunity
Immunoglobulin levels were evaluated in 402 patients. A low IgM level was the most common identified alteration. In particular, 127/402 patients (31.6%) showed levels of IgM <50 mg/dL on at least 1 occasion. A total of 96 patients (23.9%) had borderline values (30-50 mg/dL) while levels were <30 mg/dL in 31/402 patients (7.71%) with 22/402 patients (5.4%) having levels of <30 mg/dL on all occasions. Selective IgA deficiency observed in 24/402 (5.97%) of patients was the second most common humoral alteration, followed by panhypogammaglobulinemia in 9/402 (2.23%) requiring replacement therapy in 2 cases and transient panhypogammaglobulinemia in 5/402 (1.24%) of the patients (Figure 5).
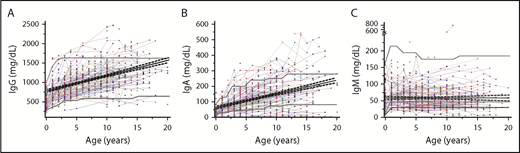
Longitudinal data on quantitative immunoglobulin levels. (A) IgG. (B) IgA. (C) IgM. In all the panels, each line and symbol represent a single patient. The gray bold lines represent the 5th and 95th percentile levels of the age-matched reference values based on in-house unpublished data. Black line indicates trend. The black bold line in the panel C represents the 30 mg/dL limit used to define the severe IgM deficiency.
Longitudinal data on quantitative immunoglobulin levels. (A) IgG. (B) IgA. (C) IgM. In all the panels, each line and symbol represent a single patient. The gray bold lines represent the 5th and 95th percentile levels of the age-matched reference values based on in-house unpublished data. Black line indicates trend. The black bold line in the panel C represents the 30 mg/dL limit used to define the severe IgM deficiency.
Specific antibody levels to protein-based or live vaccine (tetanus, diphtheria, Haemophilus influenzae type b, or measles) were protective in 386 (96.25%) of the 401 patients evaluated. Two of 15 patients with low levels also had panhypogammaglobulinemia, 3 had reduced IgM levels, and 1 reduced IgA levels. The vaccination status was unknown for the remaining patients. A total of 79/201 patients (39.3) had nonprotective pneumococcal antibody titers.
B-cell immunophenotyping was available for 13 patients; in 6 cases, the analysis was repeated during follow-up (Figure 6). Immunoglobulin levels were impaired in 12/13: hypogammaglobulinemia requiring replacement (2/13), IgM levels persistently <30 mg/dL (6/13), low IgA and IgM levels (3/13), and persistently borderline IgM levels (1/13) (supplemental Table 1, available on the Blood Web site). Two patients suffered from chronic Epstein-Barr virus infection, associated in 1 case with mixed B- and T-cell lymphoproliferative disease. Switched memory B cells were reduced in 5/13 and borderline 2/13 patients. Nonswitched memory B cells were reduced in 8/13 and borderline in 1 patient. An accumulation of transitional B cells was observed in 1 patient (P12) suffering from EBV-related mixed B- and T-cell lymphoproliferative disease. None of the patients showed an expansion of the CD19+CD38lowCD21low. Plasmablasts (CD19+IgMloCD38++) were normal in most of the cases.
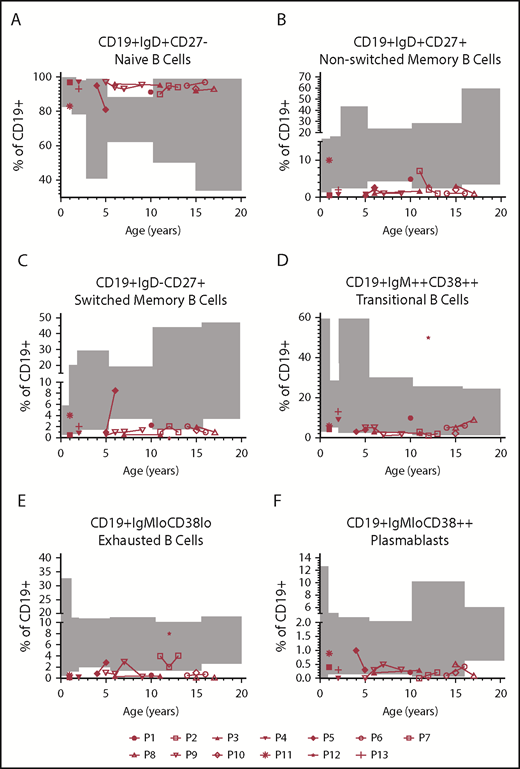
B-cell immunophenotyping. B-cell immunophenotyping of 13 patients. Gray boxes indicate the normal age-related ranges for relative B-cell counts. (A) Naïve B cells (CD19+IgD+CD27−). (B-C) Nonswitched memory (CD19+IgD+CD27+) and switched memory B cells (CD19+IgD−CD27+) were reduced in 69% and 54% of the patients, respectively. (D) One patient (P12), suffering from EBV-related mixed B- and T-cell lymphoproliferative disease, showed an accumulation of transitional B cells (CD19+IgM++CD38++). (E-F) Exhausted B cells (CD19+IgMloCD38lo) and plasmablasts (CD19+IgMloCD38++) were normal in most of the cases.
B-cell immunophenotyping. B-cell immunophenotyping of 13 patients. Gray boxes indicate the normal age-related ranges for relative B-cell counts. (A) Naïve B cells (CD19+IgD+CD27−). (B-C) Nonswitched memory (CD19+IgD+CD27+) and switched memory B cells (CD19+IgD−CD27+) were reduced in 69% and 54% of the patients, respectively. (D) One patient (P12), suffering from EBV-related mixed B- and T-cell lymphoproliferative disease, showed an accumulation of transitional B cells (CD19+IgM++CD38++). (E-F) Exhausted B cells (CD19+IgMloCD38lo) and plasmablasts (CD19+IgMloCD38++) were normal in most of the cases.
Identification of risk factors for the development of infections, autoimmunity, and allergy
Multivariate logistic regression analysis confirmed that the increased incidence of URTI in pDGS is due to other predisposing factors including GERD/dysphagia (p = .006; odds ratio [OR], 1.870; 95% confidence interval [95% CI], 1.199-2.915) and asthma/rhinitis (p 0.006; OR 2.686; 95% CI 1.325-5.448) rather than the underlying immune defect. Similarly, recurrent OME with or without hearing impairment was associated with functional or anatomical palatal alterations (P < .0001; OR, 2.807; 95% CI, 1.767-4.460). Antibiotic prophylaxis was prescribed more commonly in patients with asthma/rhinitis (P = .017; OR, 2.434; 95% CI, 1.176-5.039) and IgM levels persistently <30 mg/dL (P = .011; OR, 3.547; 95% CI, 1.335-9.424). In a group of 201 patients with available pneumococcal antibodies, recurrent OME were associated with nonprotective antibody titers (p = .003; OR, 2.578; 95% CI, 1.388-4.786).
Allergy was more prevalent in patients with IgM levels persistently <30 mg/dL (P = .003; OR, 3.787; 95% CI, 1.554-9.230) and autoimmunity was more prevalent in patients with lymphopenia (P = .024; OR, 2.417; 95% CI, 1.126-5.189). Significantly lower total lymphocyte counts were observed in patients with autoimmunity as compared with patients without autoimmune manifestations (2205.33 ± 1229.57 vs 2927.76 ± 1535.98, P = .0127) (Figure 7A). In particular, in patients with autoimmunity, there were significantly lower levels of CD3+ (1265.58 ± 686.97 vs 1694.94 ± 872.28, P = .0078) and CD3+CD4+ (736.90 ± 448.64 vs 1026.47 ± 587.76, P = .0077) T cells (Figure 7A). CD3+CD8+ T-cell counts were also lower in the group with autoimmunity (448.13 ± 329.49 vs 546.86 ± 331.49, P = .1119), but the difference was not statistically significant, whereas B-cell levels were comparable between the 2 groups (620.75 ± 546 vs 754.69 ± 630.55, P = .245). Within the T-cell compartment, patients with autoimmune manifestations showed a significant reduction in the percentage of naïve T cells CD4+CD45RA+CD27+ (45.43 ± 21.55 vs 55.47 ± 18.76; P = .0159) and a corresponding increase of the memory T cells CD4+CD45RA-CD27+ (48.69 ± 19.88 vs 40 ± 16.72; P = .0195) (Figure 7B).
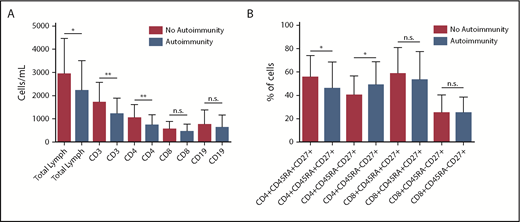
Lymphocyte subsets in autoimmunity. (A) Significantly lower total lymphocyte counts were observed in patients with autoimmunity compared with patients without autoimmune manifestations (P = .017). In particular, levels of CD3+ (P = .0078) and CD3+CD4+ (P = .0077) T cells were significantly lower in patients with autoimmunity. CD3+CD8+ T-cell counts were also lower in the group with autoimmunity, but the difference was not statistically significant (P = .1119), whereas B-cell levels were comparable between the 2 groups (P = .245). (B) Within the T-cell compartment, patients with autoimmune manifestations showed a significantly lower percentage of naïve T-cell CD4+CD45RA+CD27+ (P = .0159) and a correspondingly higher percentage of memory T-cell CD4+CD45RA−CD27+ (P = .0195). *P < .05; **P < .01. n.s., not significant.
Lymphocyte subsets in autoimmunity. (A) Significantly lower total lymphocyte counts were observed in patients with autoimmunity compared with patients without autoimmune manifestations (P = .017). In particular, levels of CD3+ (P = .0078) and CD3+CD4+ (P = .0077) T cells were significantly lower in patients with autoimmunity. CD3+CD8+ T-cell counts were also lower in the group with autoimmunity, but the difference was not statistically significant (P = .1119), whereas B-cell levels were comparable between the 2 groups (P = .245). (B) Within the T-cell compartment, patients with autoimmune manifestations showed a significantly lower percentage of naïve T-cell CD4+CD45RA+CD27+ (P = .0159) and a correspondingly higher percentage of memory T-cell CD4+CD45RA−CD27+ (P = .0195). *P < .05; **P < .01. n.s., not significant.
Discussion
In this paper, we describe a large cohort of 467 DGS patients identified over a 12-year period. As expected, most of the patients (98.28%) carried the 22q11.2 deletion. In 3 patients, the syndrome was associated with 22q11.2 duplication, which has previously been associated with DGS phenotype.28,29 Most of our patients (64.4%) suffered from recurrent or severe infections. The results of the multivariate analysis showed that the increased susceptibility to URTI and OME are related to the underlying anatomical defects (GERD or functional and anatomical palatal alterations) and to nonprotective pneumococcal antibody titer.2,7,10,11 The frequency of URTI was also increased in patients with asthma/rhinitis, as also observed in the general population.30 Antibiotic prophylaxis was recommended more frequently in patients with low IgM levels. This observation may suggest that immunodeficiency may predispose to more frequent and severe infections requiring antibiotic prophylaxis. However, we cannot exclude that clinicians were keener on recommending antibiotic prophylaxis in the presence of an immunological disorder, whether or not this was truly clinically indicated. Selective IgM deficiency (SIGMD) represents a poorly defined and underrecognized primary immunodeficiency, characterized in ∼80% of the cases by increased risk of infections, allergy, and autoimmunity.31 It has been reported in association with different chromosomal abnormalities or genetic syndromes including chromosome 1, 18, and 22q11.2 deletions, and Silver Russel syndrome.32-37 In our cohort, IgM deficiency represented the most common humoral defect. Even though it was not associated with increased risk of URTI or autoimmunity, it was more commonly reported in patients with URTI requiring antibiotic prophylaxis and in patients with allergic manifestations. However, it should be noted that pDGS is a complex disorder, in which IgM deficiency is not usually isolated. Therefore, it can be difficult to identify the role of a single factor to the clinical phenotype. Even if different mechanisms have been proposed, the pathogenesis of SIGMD remains unclear. It remains to be elucidated whether the conditions described in association with SIGMD are caused by the IgM deficiency itself or if they share the same pathogenic mechanism with IgM deficiency. For instance, it has been shown that the accumulation of CD21low B cells in SIGMD can explain autoimmunity, impaired pneumococcal polysaccharide response, and increased risk of infections.31 In the current study, we did not detect any accumulation of CD21low B cells or impaired pneumococcal antibodies in patients with IgM levels persistently <30 mg/dL. This may explain why in our study IgM deficiency was not associated with autoimmunity or URTI and suggests that the pathogenesis of IgM deficiency in pDGS may be different from that of SIGMD. Moreover, even if the incidence of allergy was higher in patients with IgM deficiency, we were not able to identify any pathogenic link between low serum IgM and allergy. It has been previously reported that specific antibody response to pneumococcal polysaccharide antigen may be impaired in pDGS.36 In the current study, ∼40% of the patients had nonprotective pneumococcal antibody titers. In our cohort, the levels were not measured at set points after vaccination and, in some cases, they were evaluated many years after routine childhood immunization, making any conclusions about the ability of these patients to mount an antibody response against pneumococcus difficult. Nonetheless, as expected, nonprotective pneumococcal antibody titers were associated with OME, underlying the importance of pneumococcal vaccination to reduce the incidence of recurrent infections in pDGS.
An increase in allergic diseases, contributing to the infection pattern, has been reported in chromosome 22q11.2 deletion syndrome by using the International Study of Asthma and Allergies in Childhood (ISAAC) questionnaire.38 In our cohort, 24.4% of the patients suffered from ≥1 allergic manifestations. The prevalence rates observed in our cohort were lower compared with those observed in UK children aged 13 to 14 years in the phase 3 ISAAC (24.5%, 15%, and 11.2% respectively)39 and with those previously reported in 22q11.2 deletion syndrome (36%, 21%, and 28%, respectively).38 However, different from the studies performed using the ISAAC questionnaire, in our study no specific questions were addressed concerning the presence of allergic symptoms. The ISAAC survey is based on self-reported symptoms and studies suggest that there are significant differences between the self-reported prevalence of atopic disorders in the open population compared with physician diagnosed prevalence of atopic disorders in general practice.40
Autoimmune manifestations were observed in 8% of the patients, as previously reported in the literature,9,41,42 with autoimmune cytopenia being the most common presentation. Interestingly, in patients with autoimmune manifestations, the lymphocyte count was significantly lower as compared with patients without autoimmunity. As previously reported, patients with higher levels of naïve T cells had a lower risk of developing autoimmune manifestations,42,43 suggesting a role for ongoing thymopoiesis in the process of immune tolerance. Recent evidence suggests that autoimmune manifestations in pDGS usually appear later in life.14 In parallel, the age-related decline of naïve T cells is more rapid in DGS patients compared with healthy controls, as shown previously.19 As already reported, TCR repertoire was impaired in our cohort and abnormalities were more commonly detected in older patients.44-46 The age-related deterioration of the TCR repertoire together with the accelerated decline of the naïve CD45RA+CD27+ and the accumulation of memory CD45RA−CD27+ T cells within the CD4 and CD8 compartment support the hypothesis that homeostatic peripheral proliferation of T cells contributes to the age-related recovery of T-cell numbers. Together with the evidence of lower levels of naïve T cells in patients with autoimmunity, these observations suggest that premature CD4+ T-cell aging and lymphopenia induced spontaneous T-cell proliferation might contribute to the pathogenesis of autoimmunity in patients with DGS.47,48 Infections and autoimmunity may contribute to the T-cell repertoire skewing. However, even if both the conditions were more frequent in the group with skewed spectratype, the differences were not statistically significant. This may be due to the small population size because the group with autoimmunity and spectratype evaluated only included 9 patients.
B-cell abnormalities have been recently described in 22q11.2 deletion.49,50 In the current study, the B-cell phenotype was studied in only 13 patients suffering from recurrent respiratory infections and showing, in most cases, a defect in ≥1 immunoglobulin classes. Most of the patients showed a defect in switched and nonswitched memory B cells (54% and 69%, respectively). All the evaluations were performed in patients <18 years confirming that the B-cell compartment may be also affected earlier in life. One patient with EBV-related mixed B- and T-cell lymphoproliferative disease and panhypogammaglobulinemia showed increased transitional B cells. This finding has been observed in XLP,51 idiopathic CD4 lymphopenia,52 and in ∼15% of the patients with common variable immunodeficiency disorder, where it is associated with lymphoadenopathy.53
Deletion breakpoints in 22q11.2 have been recently shown to correlate with CD4− lymphopenia in DGS, particularly with regard to whether TBX1 is deleted.54 In the present study, it was not possible to correlate the presence/absence of TBX1 with the T-cell count or any other clinical measures because the distal deletion, not including TBX1, was identified just in 1 patient (1.6%). Notably, most of our patients were ascertained before the distal deletion could have been detected and before it would have been reported by a diagnostic laboratory. Moreover, because distal deletion is associated with a lower penetrance, patients carrying this deletion may be underrecognized.
In conclusion, we provide evidence that infections in pDGS may represent a complication of anatomical or gastroenterological anomalies. Moreover, we identified low lymphocyte count and low CD4+ naïve cells as a risk factor for the development of autoimmunity, suggesting that lymphopenic patients may require closer follow-up to evaluate the development of autoimmune manifestations.
For original data, please contact giuliana.giardino@unina.it.
The online version of this article contains a data supplement.
The publication costs of this article were defrayed in part by page charge payment. Therefore, and solely to indicate this fact, this article is hereby marked “advertisement” in accordance with 18 USC section 1734.
Acknowledgments
The stay of Giuliana Giardino at Great Ormond Street Hospital was financially supported by UniNA and Compagnia Intesa SanPaolo, in the frame of Programme STAR, and by Ermenegildo Zegna Founder’s scholarship.
Authorship
Contribution: G.G., F.L., and E.G.D. organized and analyzed the data and wrote the manuscript; N.R. and P.K. collected the information and reviewed the manuscript; S.A. performed the spectratyping and the TRECs analysis and reviewed the manuscript; D.M.M. analyzed the genetic results; K.G. performed the flow cytometry, contributed to the interpretation of the data, and reviewed the manuscript; and W.I., A.W., A.J., I.M.-P., and H.B.G. contributed to the interpretation of the data and reviewed the manuscript.
Conflict-of-interest disclosure: The authors declare no competing financial interests.
Correspondence: Giuliana Giardino, Department of Translational Medical Sciences, Unit of Immunology, Federico II University, via S. Pansini 5, 80131 Naples, Italy; e-mail: giuliana.giardino@unina.it.
