Acute lymphoblastic leukemia (ALL) is characterised by a number of recurrent chromosomal abnormalities which inform prognosis. Low hypodiploidy (HoTr) and high hyperdiploidy (HeH) are genetic subgroups associated with large non-random ploidy shifts, specifically 30-39 chromosomes and 51-65 chromosomes respectively. HoTr ALL often presents with a near triploid karyotype of 60-78 chromosomes through chromosomal endoreduplication without cytokinesis. This presents a diagnostic challenge in distinguishing this poor risk entity from good risk HeH ALL. To date, classification of such challenging cases has been based on the modal chromosome number, the pattern of specific gains, and identification of loss of heterozygosity (LOH) using single nucleotide polymorphism (SNP) arrays where possible. However, loss of cellular context and mixed cell populations (normal diploid, low hypodiploid and near-triploid) when analysing SNP arrays can pose additional analytical difficulty.
The aim of this SNP array study was to (1) determine the level of inaccurate genetic subgrouping when cytogenetics only was used to distinguish HeH from doubled up HoTr and (2) develop a diagnostic algorithm to reliably call HeH and HoTr without supporting cytogenetic analysis.
SNP arrays were performed on diagnostic ALL samples of 85 patients (46 HoTr, 39 HeH) using Illumina CytoSNP 850k (n=80) or Affymetrix Cytoscan HD (n=5) arrays. Probe level data were uploaded to Nexus Copy Number 10 (BioDiscovery) and manual segments spanning the length of each chromosome were created. No further data pre-processing was carried out and log2 ratio of 0 was automatically assigned to the median log2 ratio of the sample. Chromosomal log2 ratios were normalized within each sample and a variety of machine-learning techniques used to cluster the samples independently of assigned diagnosis. Cases residing in the incorrect cluster based on initial diagnosis were examined in detail using information from cytogenetics and SNP array interpretation.
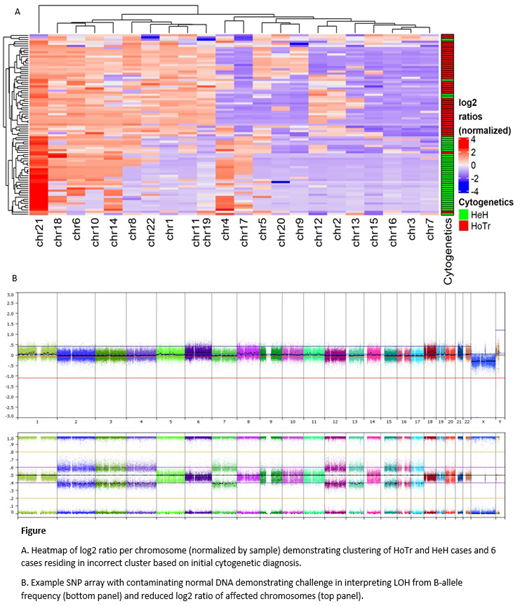
SNP arrays were analysed from 46 HoTr (median age 50.5 years (range 7-87), 43% male) and 39 HeH (median age 7 years (range 1-58), 56% male) patients. Unsupervised clustering of log2 ratios showed a clear distinction between HeH and HoTr patients (figure (A)). Six cases clustered incorrectly based on cytogenetic diagnosis. After detailed interpretation of all cases, including identifying LOH affecting chromosomes 3, 7, 15, 16 and 17, 3/6 cases initially classified as HeH were highly suggestive of HoTr ALL despite having <60 chromosomes. Similarly, 1/6 cases was cytogenetically diagnosed with HoTr but had a SNP array pattern typical of HeH ALL. We identified chromosomes 1, 4, 11, 17, 19, and 21 as those contributing most to the distinction in the HoTr and HeH signatures with the log2 ratio of chromosome 1 the most highly discriminatory in this cohort.
Using whole chromosome log2 ratios, HoTr and HeH ALL have distinct profiles. SNP array analysis highlighted at least 4 patients whose ploidy subgroups appeared incorrectly called by cytogenetics, which can affect risk stratification. Crucially, these data call into question the accepted modal chromosome numbers for HeH and HoTr in the near triploid phase and suggest this alone cannot be used to classify patients into these ploidy groups. All samples incorrectly classified as HeH ALL were from adults aged >40 years, suggesting this good risk subgroup is even rarer than previously thought in older adults. After re-classification, our cohort only contained 5/41 adults >40 years with HeH ALL, signifying that HoTr ALL is the commonest genetic ploidy group in older adults with ALL and must still be considered in cases with 50-60 chromosomes.
Copy number analysis from SNP arrays is challenging in samples with marked ploidy shift and mixed cell populations. Importantly, a number of our samples had significant contaminating normal DNA and LOH could not be confirmed visually (figure (B)), underlying the need for additional factors to aid classification. Our analysis only takes into account log2 ratio of entire chromosomes, thus permitting a measure of the relative over and under-representation of specific chromosomes within the sample. This method accurately clusters patients even when LOH cannot be clearly visualized from B-allele frequency due to contaminating non-leukemic DNA and supports the development of a diagnostic classifier based on chromosomal log2 ratios.
Fielding:Amgen: Consultancy; Novartis: Consultancy; Pfizer: Consultancy; Incyte: Consultancy.
Author notes
Asterisk with author names denotes non-ASH members.


This feature is available to Subscribers Only
Sign In or Create an Account Close Modal