Key Points
Duplication of PLAU in QPD disrupts genome architecture and rewires enhancer-gene interactions, causing cell type–specific overexpression.
Abstract
Quebec platelet disorder (QPD) is an autosomal dominant bleeding disorder with a unique, platelet-dependent, gain-of-function defect in fibrinolysis, without systemic fibrinolysis. The hallmark feature of QPD is a >100-fold overexpression of PLAU, specifically in megakaryocytes. This overexpression leads to a >100-fold increase in platelet stores of urokinase plasminogen activator (PLAU/uPA); subsequent plasmin-mediated degradation of diverse α-granule proteins; and platelet-dependent, accelerated fibrinolysis. The causative mutation is a 78-kb tandem duplication of PLAU. How this duplication causes megakaryocyte-specific PLAU overexpression is unknown. To investigate the mechanism that causes QPD, we used epigenomic profiling, comparative genomics, and chromatin conformation capture approaches to study PLAU regulation in cultured megakaryocytes from participants with QPD and unaffected controls. QPD duplication led to ectopic interactions between PLAU and a conserved megakaryocyte enhancer found within the same topologically associating domain (TAD). Our results support a unique disease mechanism whereby the reorganization of sub-TAD genome architecture results in a dramatic, cell-type–specific blood disorder phenotype.
Introduction
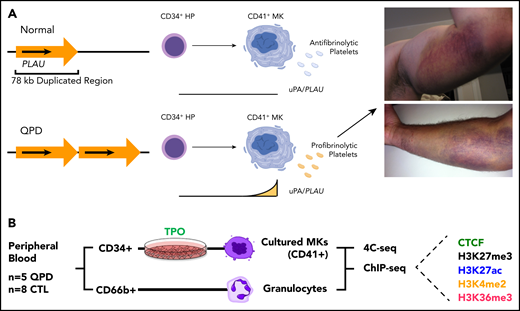
Quebec platelet disorder (QPD) is an autosomal dominant bleeding disorder with complete penetrance of a unique gain-of-function defect in fibrinolysis.1 The causative mutation is a 78-kb single-tandem duplication on chromosome 10q22 that includes PLAU and its known regulatory elements.1 PLAU is ubiquitously expressed in most nonneuronal solid tissues and shows higher expression in granulocytes and dendritic cells2 than in megakaryocytes.3,4 In QPD, a >100-fold increase in PLAU expression in megakaryocytes results in platelet-dependent but not systemic fibrinolysis, increasing platelet PLAU/uPA and triggering intraplatelet plasmin generation that degrades diverse α-granule proteins.4-6 QPD increases risks for challenge-related bleeding (examples in Figure 1A) that can be reduced with antifibrinolytic drugs (the only known effective treatment).7 Mice that selectively overexpress PLAU in megakaryocytes have a QPD-like bleeding disorder.8
Overview of QPD and study design (A) Overview of QPD pathogenesis. QPD is associated with a duplication mutation of PLAU that selectively increases PLAU expression with megakaryocyte differentiation, resulting in a platelet-dependent gain-of-function defect in fibrinolysis, with hemostatic consequences. Images show QPD bleeds in 2 participants, after exercise (top) or a minor fall (bottom). (B) Overview of samples, cell types, and experimental assays. TPO, thrombopoietin; MK, megakaryocytes; HP, hematopoietic progenitor. The schematic in panel A was created with BioRender.com.
Overview of QPD and study design (A) Overview of QPD pathogenesis. QPD is associated with a duplication mutation of PLAU that selectively increases PLAU expression with megakaryocyte differentiation, resulting in a platelet-dependent gain-of-function defect in fibrinolysis, with hemostatic consequences. Images show QPD bleeds in 2 participants, after exercise (top) or a minor fall (bottom). (B) Overview of samples, cell types, and experimental assays. TPO, thrombopoietin; MK, megakaryocytes; HP, hematopoietic progenitor. The schematic in panel A was created with BioRender.com.
Discovery of the QPD duplication mutation has transformed diagnostic testing for this blood disorder. However, the molecular mechanism that explains how this mutation causes QPD is unknown. Multiple lines of evidence indicate that QPD results from profound, allele- and megakaryocyte-specific overexpression of PLAU by the disease chromosome. First, QPD megakaryocytes and platelets exhibit >100-fold increased levels of structurally normal PLAU mRNA3 and PLAU/uPA protein4 relative to controls, whereas QPD saliva, urine, monocytes, granulocytes, and CD34+ hematopoietic progenitors show only minimal changes (∼2-5-fold).3-6,9 Second, overexpression of PLAU by the disease chromosome emerges with megakaryocyte differentiation, with day-13 to -14 cultured QPD megakaryocytes showing the same >100-fold increase in PLAU transcripts and uPA levels in QPD platelets.6 Third, PLAU transcripts overexpressed in QPD megakaryocytes show a strong (>100-fold) bias for alleles from the disease chromosome, unlike those expressed by QPD CD34+ hematopoietic progenitors or granulocytes.3,5,6
The 78-kb QPD duplication on chromosome 10q221 contains 1 additional gene, C10orf55, and is flanked by the neighboring genes CAMK2G and VCL, located ∼37 kb upstream and 87 kb downstream of the PLAU promoter, respectively.1,3 All 4 genes are contained entirely within a ∼400-kb topologically associating domain (TAD).10 TADs are megabase-scale, self-interacting, genomic intervals that can act as evolutionarily conserved regulatory units where enhancers are more likely to access receptive gene promoters.10-14 Although genes within the same TAD are known to exhibit coordinated patterns of expression,15,16 TADs can be further partitioned into substructures, such as insulated neighborhoods or sub-TADs, that orchestrate spatiotemporal gene expression patterns.17-23 PLAU expression appears to be uncoupled from that of C10orf55, CAMK2G, and VCL. For example, in QPD megakaryocytes, PLAU expression is increased >100-fold without affecting that of C10orf55, CAMK2G, or VCL.3 Similarly, induction of PLAU in nonexpressing HepG2 cells results in an ∼100-fold increase in PLAU expression, with minimal effects on CAMK2G and VCL expression.24,25 Furthermore, during normal megakaryocyte differentiation, PLAU expression is unchanged, whereas VCL expression increases over time.26 The distinct PLAU expression patterns after stimulation and during megakaryopoiesis indicate that sub-TAD structures are integral to this locus.17-21
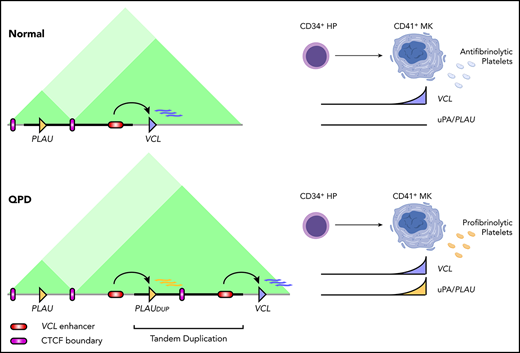
In this study, we asked whether a detailed characterization of the PLAU locus, using epigenomic profiling and chromatin conformation capture approaches to compare overexpressing (megakaryocytes) and nonoverexpressing (granulocytes) blood cell types, would reveal the molecular mechanism(s) that gives rise to the QPD phenotype. Our results support a model in which the QPD duplication positions 1 copy of PLAU within a neighboring sub-TAD where PLAU is ectopically activated by a conserved hematopoietic enhancer during megakaryopoiesis.
Methods
Ethics
Studies were conducted in accordance with the revised Declaration of Helsinki with approval from the Hamilton Integrated Research Ethics Board and the Centre Hospitalier Universitaire Sainte Justine Research Ethics Board. All participants provided written informed consent.
Subjects and sample collection
Peripheral blood samples (≤200 mL per donation) were collected by multiple donations from QPD (n = 5) and age- and sex-matched controls (n = 8; some declined multiple donations). Identities were anonymized at collection and further simplified for publication. Peripheral blood CD66b+ granulocytes and CD34+ hematopoietic progenitors were obtained as described.6 QPD and control samples were processed in parallel.
Megakaryocyte culture
Megakaryocytes were grown in liquid culture from peripheral blood–derived CD34+ hematopoietic progenitors and assessed for viability and differentiation, as described.3
ChIP-seq library preparation and sequencing
Multiple batches of day-14 cultured megakaryocytes and peripheral blood granulocytes were prepared, cross-linked in 1% formaldehyde, and stored at −80°C until use for chromatin immunoprecipitation sequencing (ChIP-seq) and 4C-seq. ChIP libraries were prepared as described.27 Antibodies included mouse monoclonal anti-H3K27ac (05-1334; Millipore), rabbit polyclonal anti-H3K4me2 (07-030; Millipore), rabbit polyclonal anti-H3K36me3 (ab9050; Abcam), rabbit polyclonal anti-H3K27me3 (07-449; Millipore), and rabbit polyclonal anti-CTCF (07-729; Millipore). All sequencing libraries were constructed using the NEBNext ChIP-seq DNA library preparation kit with the exception of H3K27me3 and CTCF ChIP-seq libraries which used NEBNext Ultra II (cat. no. E7645L). Size selection for 200- to 350-bp fragments was performed by PippinPrep (Sage Science), quantified with the 2100 Bioanalyzer (Agilent), and sequenced (The Centre for Applied Genomics [TCAG], Toronto, ON, Canada) on a HiSeq2500 for 50-bp single-ended reads.
4C-seq library preparation and sequencing
Primers for 4C-seq were designed using the 4C primer designer (https://mnlab.uchicago.edu/4Cpd/) for the enzyme combination DpnII (primary) and NlaIII (secondary). Site-specific primers were appended to sequences used for addition of Illumina sequencing adapters by PCR (supplemental Methods; available on the Blood Web site). 4C libraries were constructed with frozen, fixed megakaryocytes (all samples processed in parallel) by published methods.28
Sanger sequencing of 4C samples
Forward primers were designed against the single-nucleotide polymorphism (SNP)–containing restriction fragments of interest; reverse primers consisted of the 4C reverse primer plus a 5- to 9-bp overhang specific to the ligation product containing the fragment of interest (supplemental Methods). PCR was performed on 4C PCR products, and bands of the expected size were gel purified and submitted for Sanger sequencing (at TCAG), using the forward PCR primer as the sequencing primer.
H3K27me3 ChIP Droplet Digital PCR
Droplet Digital PCR (ddPCR) was performed at TCAG. Detection of rs1916341 was performed on the QX200 Droplet Digital PCR system (Bio-Rad Laboratories, Inc, Hercules, CA) using TaqMan hydrolysis probe chemistry (Thermo Fisher, Waltham, MA) and a predesigned primer and TaqMan probe PLAU_C_11458608_10 (cat. no.; 4351379; Thermo Fisher). QuantaSoft v1.7.4.0917 (Bio-Rad Laboratories) was used to analyze the data. Reference DNA NA19238 (Coriell Institute for Medical Research, Camden, NJ) was included as a heterozygous control. Up to 5 μL of template DNA, corresponding to ∼50 ng of ChIP or input library, was used.
ChIP-seq data analysis
Demultiplexed reads were obtained in fastq format (study data sets) or downloaded from the Short Read Archive (published data sets; National Institutes of Health). Reads were trimmed with Trimmomatic29 to a minimum length of 36 bp and aligned to the hg19 and mm10 reference genome assemblies for human and mouse, respectively, using the Burrows-Wheeler alignment tool with default settings.30 Reads of low mapping quality (q > 1) and reads overlapping ENCODE blacklist regions (https://www.encodeproject.org/annotations/ENCSR636HFF/) were discarded. Individual replicates were assessed for quality, based on ENCODE ChIP-seq guidelines31 before pooling for peak calling using MACS2 v2.1.2.32 Peak calling parameters are described in supplemental Methods.
Differential ChIP enrichment analysis
Differential analysis was performed on peaks genome-wide, with DESeq2 v1.2433 at default settings, using peak-level counts per replicate. Counts from QPD samples were divided by 1.5 to account for the extra copy gain for peaks overlapping the duplicated region (chr10:75659017-75736956). Raw P-values (Wald test) were corrected for the number of peaks within the duplicated region to obtain a locus P-value (reported in text) using the false discovery rate (FDR). The same approach was used to compare H3K27ac expression between granulocytes and megakaryocytes.
4C-seq data analysis
Demultiplexed reads were obtained in fastq format and filtered for reads beginning with the 4C reading primer sequence, with an edit distance of 1. Domainograms were generated using 4Cseqpipe v0.728 for the region (hg19 chr10:75575000-75875000), with the parameters entered as follows: –read_length 70 –stat_type median –trend_resolution 1000.
Zebrafish reporter assays
Zebrafish were maintained and handled per the guidance of the Canadian Council on Animal Care and the Laboratory Animal Services of The Hospital for Sick Children. Embryos were raised at 28.5°C and staged based on morphology. The 375-bp conserved fragment of ENHQPD (hg19 assembly chr10:75716316−75716690; designated as ENHQPD_CONS) was amplified from human genomic DNA (cat. no. G1471; Promega; primers in supplemental Methods).
The ENHQPD_CONS fragment was first cloned into a GFP reporter vector E1b-Tol2-GFP-gateway34 (37846; Addgene), by using the gateway recombination system (cat. no. 11791020; Gateway LR Clonase II Enzyme Mix; Invitrogen). To generate the Tg(ENHQPD:GFP)hsc96 zebrafish line, we microinjected 25 ng of the E1b-Tol2-GFP-gw plasmid carrying ENHQPD_CONS into wild-type embryos at the 1-cell stage, together with 150 ng Tol2 mRNA, as described.35 Injected F0 embryos with GFP expression were raised to adulthood and screened for germline transgene carriers. F1 embryos from stable Tg(ENHQPD_CONS:GFP)hsc96 carriers were used for RNA in situ hybridization and confocal imaging, as described.36 In brief, a previously described gfp probe37 was synthesized using a DIG RNA Labeling kit (cat. no. 11277073910; Roche). To generate double-transgenic embryos, a previously described Tg(gata1:DsRed)sd2 line38 was crossed with the Tg(ENHQPD_CONS:GFP)hsc96 fish. Embryos were collected at 24 hours after fertilization (hpf) for confocal imaging.
Luciferase reporter assays
Luciferase activity was measured using the dual-luciferase reporter assay (E1960; Promega), which relies on cotransfection of 2 plasmids: pGL4.23 (firefly luciferase) and pGL4.75 (Renilla luciferase). Luciferase activity is calculated by normalizing pGL4.23 firefly signal to pGL4.75 Renilla signal. Assayed constructs were generated by subcloning the empty pGL4.23 vector (minP). PLAU (pPLAU; chr10:75670575-75670944; 315 bp upstream and 55 bp downstream of the transcription start site [TSS])25 and VCL (pVCL; chr10:75757517-75757938; 367 bp upstream and 55 bp downstream of the TSS) promoters, and ENHQPD_CONS were PCR amplified from human genomic DNA (cat. no. G1471; Promega). Primers are described in supplemental Methods.
pPLAU and pVCL were inserted in place of the minimal promoter upstream of the luc2 gene in pGL4.23, using the BglII and NcoI restriction sites. ENHQPD_CONS was inserted downstream of the firefly luciferase gene (luc2), using the NotI restriction site. K562 cells were plated at a density of 104 cells in 96-well plates with 4 technical replicates for each construct. Separate transfections were performed in 5 plates. The transfections were performed with Lipofectamine 3000 (Thermo Fisher Scientific). For human megakaryocyte transfection, day 5 (donor 1) or day 8 (donor 2) megakaryocytes, at a cell density of 2.5 × 10⁵ cells per well in 6-well plates, were transfected, using Amaxa Human CD34+ Nucleofector Kit according to the manufacturer’s protocol. Luciferase activity was measured on the Fluoroskan Ascent FL plate reader. Statistical analysis was performed with 1-way analysis of variance with the Tukey correction.
Results
To understand how the QPD duplication can alter PLAU regulation, we obtained CD66b+ granulocytes and CD34+ hematopoietic progenitors from individuals with QPD (n = 5) and control participants (n = 8). CD34+ hematopoietic progenitors were differentiated into megakaryocytes and harvested on day 14 of culture (at harvest: 79%-93% CD41+, with 20-98 ng von Willebrand factor in the medium per 106 cells). Cells were subjected to epigenomic profiling by ChIP-seq for the histone posttranslational modifications H3K27ac (mark of active regulatory regions), H3K27me3 (mark of polycomb-mediated repression), H3K4me2 (mark of active and latent enhancers), and H3K36me3 (mark of active transcription). We also profiled CTCF, a zinc finger protein involved in the formation of TAD and sub-TAD boundaries.19,20,40-42 In addition, we profiled active histone modifications (H3K27ac, H3K4me2, and H3K36me3) in QPD and control peripheral blood granulocytes, a lineage that normally expresses PLAU, but does not exhibit allele-specific PLAU overexpression in QPD3 (Figure 1B).
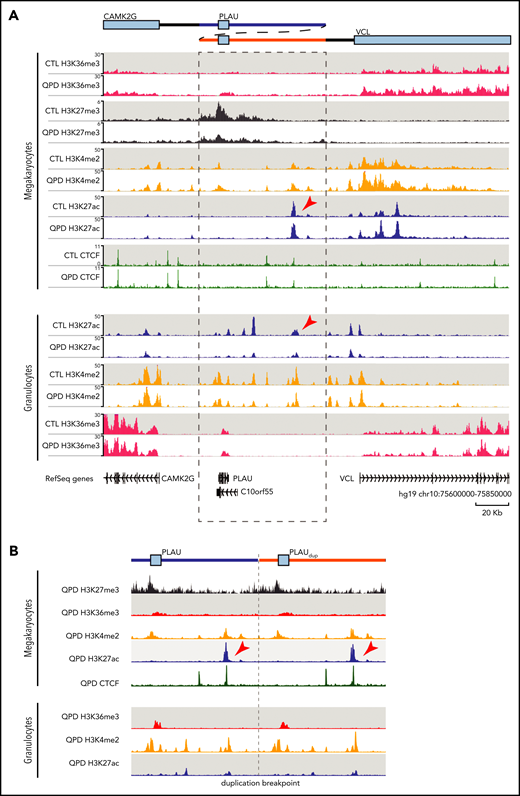
For megakaryocytes, ChIP-seq results indicated a gain in H3K36me3 across the PLAU gene body in QPD, which is consistent with an increase in RNA polymerase II (RNAP2)–mediated transcription in QPD megakaryocytes (1.9-fold; FDR = 1.4e−7; Figure 2A). We also observed a reduction in H3K27me3 at the PLAU promoter (1.3-fold; FDR = 8e−3) in QPD vs control megakaryocytes (Figure 2A), suggesting that the active expression of PLAU in QPD megakaryocytes is associated with a loss of chromatin repression. The remaining factors were highly concordant between control and QPD megakaryocytes within the region duplicated in QPD (QPD duplication; chr10:75659017-75736956; Figure 2A), without significant differences in enrichment for H3K27ac or H3K4me2 peaks within the QPD duplication (FDR < .05). Consistent with our previous work comparing C10orf55 mRNA and protein expression between QPD megakaryocytes and controls, we did not observe any overt H3K4me2/H3K27ac changes around its TSS, or H3K36me3 enrichment in its gene body (Figure 2A). The breakpoint sequence at the duplication boundaries in QPD samples did not appear to create novel regulatory elements, as no ChIP-seq enrichments were observed when the sequence was aligned with that of an in silico QPD genome that contained the QPD duplication (Figure 2B).
QPD results in a loss of repressive chromatin and repositions PLAU relative to a candidate megakaryocyte enhancer. (A) Genome browser view of tracks produced by ChIP-seq of H3K27ac (blue), H3K4me2 (orange), and H3K36me3 (red) in granulocytes and megakaryocytes, from QPD and control (CTL), and H3K27me3 (gray) and CTCF (green) from QPD and CTL megakaryocytes only (bottom). Each track shows merged signal from 3 biological replicates with the exception of the CTL granulocyte H3K4me2, for which only 2 biological replicates were used. ChIP-seq track values are shown as fold change over input. Arrowheads mark the position of ENHQPD. The schematic (top) describes the duplication in QPD. Dashed lines mark the boundaries of the duplicated region. Tracks were visualized using the WashU epigenome browser with the following settings: summary method, max; smoothing window, 3 pixels. (B) ChIP-seq signal from QPD megakaryocytes and granulocytes aligned to a custom chromosome 10 containing the QPD duplication. Tracks were smoothed before visualization with Sushi70 in R. Only unmapped reads and reads mapping to chromosome 10 from hg19 alignments were used.
QPD results in a loss of repressive chromatin and repositions PLAU relative to a candidate megakaryocyte enhancer. (A) Genome browser view of tracks produced by ChIP-seq of H3K27ac (blue), H3K4me2 (orange), and H3K36me3 (red) in granulocytes and megakaryocytes, from QPD and control (CTL), and H3K27me3 (gray) and CTCF (green) from QPD and CTL megakaryocytes only (bottom). Each track shows merged signal from 3 biological replicates with the exception of the CTL granulocyte H3K4me2, for which only 2 biological replicates were used. ChIP-seq track values are shown as fold change over input. Arrowheads mark the position of ENHQPD. The schematic (top) describes the duplication in QPD. Dashed lines mark the boundaries of the duplicated region. Tracks were visualized using the WashU epigenome browser with the following settings: summary method, max; smoothing window, 3 pixels. (B) ChIP-seq signal from QPD megakaryocytes and granulocytes aligned to a custom chromosome 10 containing the QPD duplication. Tracks were smoothed before visualization with Sushi70 in R. Only unmapped reads and reads mapping to chromosome 10 from hg19 alignments were used.
To test whether the loss of H3K27me3 shows bias for the disease chromosome in QPD megakaryocytes, we analyzed the PLAU intronic single-nucleotide polymorphism (rs1916341G>T) that falls within the H3K27me3 peak by ddPCR analysis of our H3K27me3 ChIP-seq and matched input libraries from heterozygous individuals with QPD (2 copies of the T allele on the disease chromosome and the G allele on the other). We detected allelic ratios consistent with the expected genomic copy number in all heterozygous input libraries (∼2:1 for n = 3 QPD libraries and ∼1:1 for n = 1 control library, respectively; supplemental Figure 1). In contrast, the levels of the QPD allele were significantly depleted in H3K27me3 ChIP-seq libraries relative to input for all 3 QPD samples (∼1.3:1; P < 2.2e−16; Fisher’s exact test) but not in the control libraries (supplemental Figure 1). This result indicates that the loss of H3K27me3 in QPD megakaryocytes occurs preferentially on the disease chromosome.
To discover enhancers that could drive PLAU overexpression in QPD megakaryocytes, we compared H3K27ac enrichment between QPD and control granulocytes and megakaryocytes. We identified 7 H3K27ac peaks within the QPD duplication in QPD and control granulocytes, including the previously studied PLAU upstream enhancer24 (Figure 2A). The only enriched H3K27ac peak in QPD and control megakaryocytes relative to granulocytes (2.9-fold; FDR = 8.0e−6) was a 5.7-kb element that was roughly equidistant (∼50 kb) between the PLAU and VCL promoters (Figure 2A-B; arrowheads). This element ranks within the top 10th percentile of peaks in megakaryocytes when ordered by H3K27ac fold-enrichment, vs >30th percentile in granulocytes (supplemental Figure 2A). Comparing H3K27ac ranking in our samples with cells/tissues from Roadmap Epigenomics,43 we found that this element was marked by H3K27ac in the majority of hematopoietic cell types profiled, with megakaryocytes ranking among the top cells and tissues43 (supplemental Figure 2B). Given the H3K27ac enrichment seen in megakaryocytes and other tissues, we designated this putative enhancer as ENHQPD.
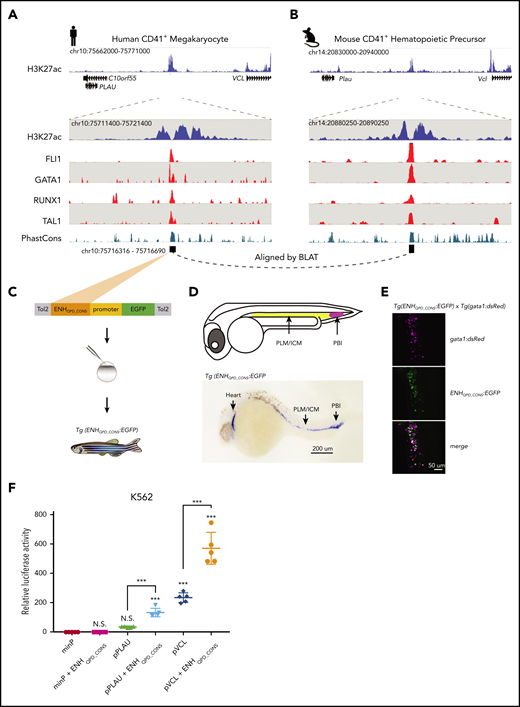
Although PLAU and VCL share conserved synteny and their tandem organization across vertebrates (eg, human and zebrafish), the ENHQPD sequence itself is conserved only in mammals (supplemental Figure 3A). Closer inspection of ENHQPD using published ChIP-seq experiments performed in human megakaryocytes44 and mouse CD41+ hematopoietic precursors45 showed conserved orthologous H3K27ac enrichment and binding of canonical megakaryocyte transcription factors, including FLI1, GATA1, RUNX1, and TAL146 (Figure 3A-B; supplemental Figure 3B). The conserved cis regulatory module (designated ENHQPD_CONS; 91% identity between human and mouse) is a nucleosome-free ∼375-bp region that falls in the prominent valley of the conserved H3K27ac signal in both humans and mice.
ENHQPD is a conserved hematopoietic enhancer that acts in synergy with the PLAU and VCL promoters. (A) Views of human ENHQPD. H3K27ac signal from QPD megakaryocytes (blue, including zoom in view) are compared with published ChIP-seq tracks for hematopoietic transcription factors from cord blood–derived megakaryocytes44 (red), expressed as fold change over input. Teal track shows a 46-way vertebrate PhastCons score. (B) Similar views of the orthologous equivalent of ENHQPD in mouse, showing ChIP-seq tracks for corresponding transcription factors profiled in mouse CD41+ hematopoietic precursor cells.45 Black squares in panels A and B (bottom) depict ENHQPD_CONS. (C) The Tol2 reporter vector system. (D) An embryo at 24 hpf (top), showing known early-stage zebrafish hematopoietic tissues (adapted from Chen and Zon,47 with permission); in situ staining (bottom) for GFP in Tg(ENHQPD_CONS:EGFP). A representative F2 embryo at 24 hpf is shown. Embryos were fixed at 24 hpf in 4% paraformaldehyde and incubated with a digoxigenin-labeled antisense gfp probe. RNA-probe hybrids were detected by an alkaline phosphatase–conjugated antibody (anti-digoxigenin-AP and Fab fragments; 1:5000; Roche, Basel, Switzerland) that catalyzed reaction on a chromogenic substrate (NBT/BCIP; Roche). Stained embryos were cleared in 2:1 benzyl benzoate/benzyl alcohol solution and imaged under an Axio Zoom.V16 Stereoscope (Zeiss, Oberkochen, Germany). PLM, posterior lateral mesoderm; ICM, interior cell mass; PBI, posterior blood island. (E) Confocal microscopy image of the PBI in a representative Tg(gata1:dsRed) x Tg(ENHQPD_CONS:EGFP) double-transgenic embryo. At 24 hpf, embryos were mounted in 1% (w/v) low-melt agarose (Sigma-Aldrich, St. Louis, MO) and imaged under a Nikon A1R Si Point scanning confocal microscope (Nikon, Tokyo, Japan). (F) Relative luciferase activity for minimal (minP), PLAU (pPLAU), or VCL (pVCL) promoter constructs, with or without ENHQPD_CONS, assayed in K562 erythroid leukemia cells. Data points show measured values averaged from 4 technical replicates (separate wells) per construct, for 5 separate transfections. All values were normalized relative to minP in their respective cell type. Statistical analysis was performed using 1-way analysis of variance with the Tukey correction. Asterisks immediately above data points denote significance compared with minP. Error bars show standard deviation of mean. Asterisks denote significance vs minP and other select pairwise comparisons. ***P < .001; n.s., not significant. All constructs and inserted sequences are further described in “Materials and methods” and supplemental Methods.
ENHQPD is a conserved hematopoietic enhancer that acts in synergy with the PLAU and VCL promoters. (A) Views of human ENHQPD. H3K27ac signal from QPD megakaryocytes (blue, including zoom in view) are compared with published ChIP-seq tracks for hematopoietic transcription factors from cord blood–derived megakaryocytes44 (red), expressed as fold change over input. Teal track shows a 46-way vertebrate PhastCons score. (B) Similar views of the orthologous equivalent of ENHQPD in mouse, showing ChIP-seq tracks for corresponding transcription factors profiled in mouse CD41+ hematopoietic precursor cells.45 Black squares in panels A and B (bottom) depict ENHQPD_CONS. (C) The Tol2 reporter vector system. (D) An embryo at 24 hpf (top), showing known early-stage zebrafish hematopoietic tissues (adapted from Chen and Zon,47 with permission); in situ staining (bottom) for GFP in Tg(ENHQPD_CONS:EGFP). A representative F2 embryo at 24 hpf is shown. Embryos were fixed at 24 hpf in 4% paraformaldehyde and incubated with a digoxigenin-labeled antisense gfp probe. RNA-probe hybrids were detected by an alkaline phosphatase–conjugated antibody (anti-digoxigenin-AP and Fab fragments; 1:5000; Roche, Basel, Switzerland) that catalyzed reaction on a chromogenic substrate (NBT/BCIP; Roche). Stained embryos were cleared in 2:1 benzyl benzoate/benzyl alcohol solution and imaged under an Axio Zoom.V16 Stereoscope (Zeiss, Oberkochen, Germany). PLM, posterior lateral mesoderm; ICM, interior cell mass; PBI, posterior blood island. (E) Confocal microscopy image of the PBI in a representative Tg(gata1:dsRed) x Tg(ENHQPD_CONS:EGFP) double-transgenic embryo. At 24 hpf, embryos were mounted in 1% (w/v) low-melt agarose (Sigma-Aldrich, St. Louis, MO) and imaged under a Nikon A1R Si Point scanning confocal microscope (Nikon, Tokyo, Japan). (F) Relative luciferase activity for minimal (minP), PLAU (pPLAU), or VCL (pVCL) promoter constructs, with or without ENHQPD_CONS, assayed in K562 erythroid leukemia cells. Data points show measured values averaged from 4 technical replicates (separate wells) per construct, for 5 separate transfections. All values were normalized relative to minP in their respective cell type. Statistical analysis was performed using 1-way analysis of variance with the Tukey correction. Asterisks immediately above data points denote significance compared with minP. Error bars show standard deviation of mean. Asterisks denote significance vs minP and other select pairwise comparisons. ***P < .001; n.s., not significant. All constructs and inserted sequences are further described in “Materials and methods” and supplemental Methods.
To ascertain ENHQPD function in vivo, we generated the Tg(ENHQPD:GFP)hsc96 zebrafish reporter line to visualize ENHQPD activity in the developing zebrafish embryo, by using the 375-bp sequence corresponding to ENHQPD_CONS (Figure 3C; supplemental Figure 3B). Despite the absence of a sequence orthologue of ENHQPD_CONS in fish and consistent with conserved regulatory logic and binding preferences of hematopoietic transcription factors, we detected GFP by in situ staining at 24 hpf in tissues that give rise to thrombocytes (the zebrafish equivalent of platelets), among other hematopoietic lineages, later in development47 (Figure 3D). We validated these expression patterns using a double cross with a gata1:dsRed reporter line, a hematopoietic transcription factor that is tightly restricted to the hematopoietic lineage in fish,48 and observed colocalization of GFP with dsRed signal (Figure 3E). We concluded that ENHQPD is active in zebrafish hematopoietic cells and functions as a conserved hematopoietic enhancer.
During normal megakaryocyte differentiation, PLAU expression remains low, whereas VCL expression increases considerably (supplemental Figure 4).26 In QPD megakaryocytes, PLAU expression mirrors that of VCL and other canonical platelet-expressed genes.6 Given that the QPD duplication positions a copy of PLAU downstream of ENHQPD (Figure 2B), we hypothesized that ENHQPD normally functions as a VCL enhancer that is adopted by PLAU in QPD.
We next asked whether ENHQPD has the capacity to drive promoter activity, by using a luciferase reporter in human hematopoieticlike cells (K562 cells; which express hematopoietic transcription factors such as GATA1, GATA2, NFE2, and TAL149 ). The addition of ENHQPD_CONS to a minimal promoter (minP) did not elicit enhancer activity in K562 cells (0.90-fold luciferase signal relative to minP; 95% confidence interval, 0.7-1.1; Figure 3F). In contrast, the addition of ENHQPD_CONS to the PLAU promoter (pPLAU) and VCL promoter (pVCL) resulted in a 2.4- and 3.7-fold increase in luciferase activity relative to their respective promoter-only equivalents (Figure 3F). This result demonstrates that ENHQPD is promoter specific and can enhance expression of both PLAU and VCL promoters, which we confirmed with cultured human megakaryocytes (supplemental Figure 5).
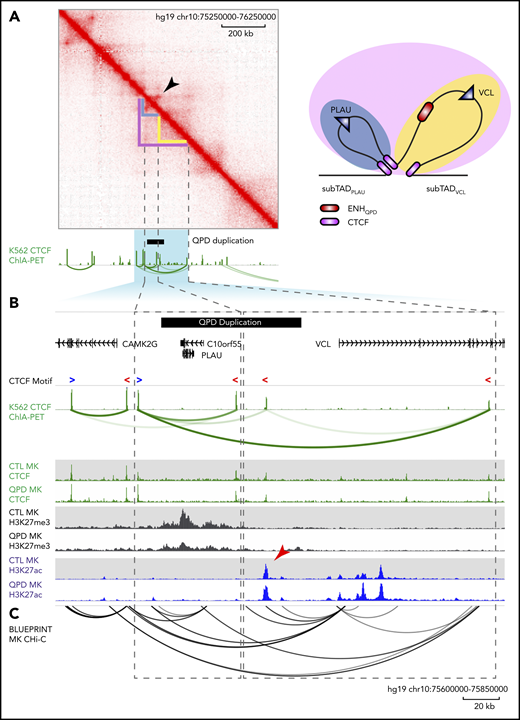
We then asked whether DNA topology supports the existence of sub-TAD structure at the PLAU locus by interrogating both published in situ Hi-C10 and CTCF chromatin-interaction analysis by paired-end tag sequencing (ChIA-PET) looping data sets50 (Figure 4A-B). Inspection of Hi-C contacts in K562 cells revealed that the locus is divided into 2 nested sub-TADs that encompass and separate each of PLAU and VCL, referred to hereafter as sub-TADPLAU and sub-TADVCL, respectively (Figure 4A-B; dashed rectangles). Furthermore, we observed evidence of a strong looping interaction at the boundaries of sub-TADPLAU in Hi-C contacts from K562 cells, but not in those from IMR90 fibroblasts (Figure 4A; supplemental Figure 6), indicating that sub-TAD boundaries at the PLAU locus are tissue specific.
The QPD duplication spans the sub-TAD boundary separating PLAU and ENHQPD. (A) Hi-C interaction matrix from K562 erythroid leukemia cells. Green tracks show K562 CTCF ChIP-seq and ChIA-PET interactions. Arrowhead marks a corner-dot feature, indicative of a looping interaction. A graphic interpretation (right) of the sub-TAD structures. Domains are color coded corresponding to structures marked on the Hi-C interaction matrix: blue, sub-TADPLAU; yellow, sub-TADVCL. CTCF sites are shown in purple. (B) Zoom-in of the highlighted region in panel A. K562 CTCF ChIP-seq ChIA-PET interactions (top) as in panel A. Blue “>” and red “<” depict forward- and reverse-oriented CTCF motifs, respectively. H3K27ac (blue) and H3K27me3 (gray) and CTCF (green) ChIP-seq tracks (bottom) from QPD and control megakaryocytes (MK), as in Figure 2. Black bar marks the region duplicated in QPD. Dashed rectangles mark the inferred inactive sub-TADPLAU (left) and active sub-TADVCL (right) domains. Arrowhead marks the position of ENHQPD. (C) Black arcs show the megakaryocyte promoter capture Hi-C interactions reported by Javierre et al.51 Only interactions with a soft-thresholded, negative log-weighted P ≥ 5 are shown.
The QPD duplication spans the sub-TAD boundary separating PLAU and ENHQPD. (A) Hi-C interaction matrix from K562 erythroid leukemia cells. Green tracks show K562 CTCF ChIP-seq and ChIA-PET interactions. Arrowhead marks a corner-dot feature, indicative of a looping interaction. A graphic interpretation (right) of the sub-TAD structures. Domains are color coded corresponding to structures marked on the Hi-C interaction matrix: blue, sub-TADPLAU; yellow, sub-TADVCL. CTCF sites are shown in purple. (B) Zoom-in of the highlighted region in panel A. K562 CTCF ChIP-seq ChIA-PET interactions (top) as in panel A. Blue “>” and red “<” depict forward- and reverse-oriented CTCF motifs, respectively. H3K27ac (blue) and H3K27me3 (gray) and CTCF (green) ChIP-seq tracks (bottom) from QPD and control megakaryocytes (MK), as in Figure 2. Black bar marks the region duplicated in QPD. Dashed rectangles mark the inferred inactive sub-TADPLAU (left) and active sub-TADVCL (right) domains. Arrowhead marks the position of ENHQPD. (C) Black arcs show the megakaryocyte promoter capture Hi-C interactions reported by Javierre et al.51 Only interactions with a soft-thresholded, negative log-weighted P ≥ 5 are shown.
The boundaries of sub-TADPLAU and sub-TADVCL coincided with CTCF loop anchors in K562 cells, indicating that these sub-TADs are demarcated by CTCF-CTCF loops. CTCF profiles in K562 cells were representative of our CTCF ChIP-seq from QPD and control megakaryocytes (Figure 4B). This sub-TAD designation also coincided with distinct H3K27ac and H3K27me3 domains in control megakaryocytes, where sub-TADPLAU was enriched for H3K27me3 and depleted of H3K27ac, whereas sub-TADVCL was enriched for H3K27ac and depleted of H3K27me3 (Figure 4B). Evaluation of local promoter-enhancer interactions using published human megakaryocyte promoter capture Hi-C data51 showed that ENHQPD physically interacted with the VCL promoter, but not the equidistant PLAU promoter, in normal megakaryocytes (Figure 4C). Together, these findings suggest that the PLAU locus is partitioned into distinct sub-TADs in normal megakaryocytes as in K562 cells, and that sub-TADPLAU may function as an “insulated neighborhood,”17,52 separating PLAU from active enhancers in the neighboring sub-TADVCL.
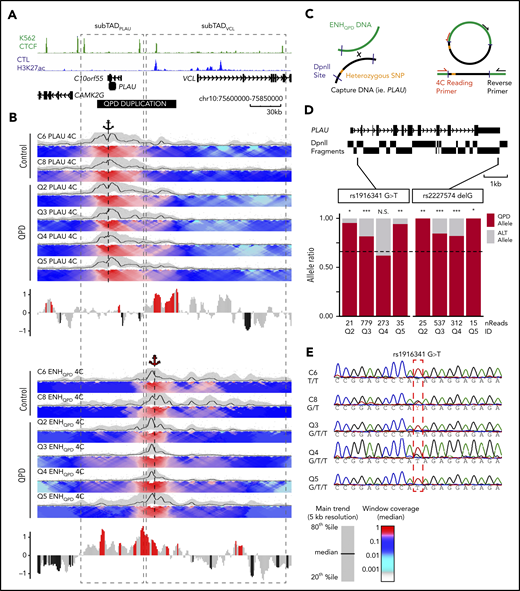
Because the QPD duplication spans the boundary between sub-TADPLAU and sub-TADVCL, such that a copy of PLAU is placed ∼50 kb downstream of ENHQPD (Figure 4B) and within sub-TADVCL, we hypothesized that the repositioning of PLAU in QPD could enable ectopic enhancer-promoter interactions between ENHQPD and PLAU, thereby driving PLAU overexpression in QPD megakaryocytes. To determine whether the QPD duplication causes altered enhancer-gene interactions that lead to PLAU activation, we interrogated interactions from the PLAU promoter and ENHQPD perspectives by performing 4C-seq39 in QPD and control megakaryocytes. In control megakaryocytes, interactions from the PLAU promoter perspective are mostly confined within sub-TADPLAU. By contrast, interactions from the ENHQPD perspective are enriched at multiple positions coinciding with H3K27ac peaks within sub-TADVCL, including the VCL promoter, but are depleted at equidistant regions beyond the boundary between sub-TADPLAU and sub-TADVCL (Figure 5A-B). These indicate that the sub-TAD boundary physically separates PLAU from ENHQPD and other active elements in normal megakaryocytes. In QPD megakaryocytes, PLAU promoter interactions crossed the sub-TAD boundary and were enriched within the section of the QPD duplication that falls within sub-TADVCL and includes ENHQPD. Similarly, ENHQPD interactions crossed the sub-TAD boundary and were enriched within the duplicated region upstream of PLAU, together indicating the occurrence of ectopic interactions between PLAU and ENHQPD (Figure 5B).
QPD results in ectopic enhancer-gene interactions specific to the disease chromosome. (A) H3K27ac tracks from control megakaryocytes, CTCF ChIA-PET tracks from K562, and gray-dashed boxes marking sub-TADPLAU and sub-TADVCL are shown, as in Figure 4. Black horizontal bar marks the position of the QPD duplication. (B) Individual 4C-Seq contact profiles from QPD and control megakaryocytes generated using a bait (restriction fragment) at the PLAU promoter (top) and EHNQPD (bottom), marked by black and red anchor symbols, respectively. For domainograms, the black trendline shows the median contact frequency in 5-kb windows tiled across 1-kb increments normalized to the maximum median value at 5-kb resolution; shaded area indicates the 20th to 80th percentiles. The heat map color-scale shows median contact frequency in the windows of increasing size from 2 to 50 kb tiled across 1-kb increments, normalized relative to the maximum median value at 12-kb resolution. Bar plots below domainograms depict log2 fold enrichment in 4C contacts in QPD vs control samples calculated for 5-kb bins tiled across 1-kb increments. Counts for bins falling within the duplicated region were divided by 1.5 to adjust for the copy number in the QPD samples. Red and black bars signify windows of nominally significantly increased interaction in QPD and control samples, respectively (nonadjusted P < .1; 2-tailed Student t test). (C) The 4C-seq design used to assess allele-specific contacts from the ENHQPD perspective. (D) Genome browser view (top) of PLAU DpnII fragments (black rectangles below the gene model) and SNPs rs1916341 and rs2227574 (vertical black bars). Fragments harboring SNPs are outlined in red. The percentage of reads (bottom) from each 4C sample at 2 SNPs that contain either the allele from the disease chromosome or the other allele. Dashed black line show the expected frequency of QPD alleles based on 1.5 copy (ie, 0.66). Numbers below bars correspond to the total number of reads mapped to a given SNP. (E) Sanger sequencing chromatographs of 4C prelibrary PCR products from 2 control and 3 QPD samples. Genotypes are displayed in the format control allele > QPD allele. *P < .01; **P < .001; ***P < .0001 by 2-tailed binomial test.
QPD results in ectopic enhancer-gene interactions specific to the disease chromosome. (A) H3K27ac tracks from control megakaryocytes, CTCF ChIA-PET tracks from K562, and gray-dashed boxes marking sub-TADPLAU and sub-TADVCL are shown, as in Figure 4. Black horizontal bar marks the position of the QPD duplication. (B) Individual 4C-Seq contact profiles from QPD and control megakaryocytes generated using a bait (restriction fragment) at the PLAU promoter (top) and EHNQPD (bottom), marked by black and red anchor symbols, respectively. For domainograms, the black trendline shows the median contact frequency in 5-kb windows tiled across 1-kb increments normalized to the maximum median value at 5-kb resolution; shaded area indicates the 20th to 80th percentiles. The heat map color-scale shows median contact frequency in the windows of increasing size from 2 to 50 kb tiled across 1-kb increments, normalized relative to the maximum median value at 12-kb resolution. Bar plots below domainograms depict log2 fold enrichment in 4C contacts in QPD vs control samples calculated for 5-kb bins tiled across 1-kb increments. Counts for bins falling within the duplicated region were divided by 1.5 to adjust for the copy number in the QPD samples. Red and black bars signify windows of nominally significantly increased interaction in QPD and control samples, respectively (nonadjusted P < .1; 2-tailed Student t test). (C) The 4C-seq design used to assess allele-specific contacts from the ENHQPD perspective. (D) Genome browser view (top) of PLAU DpnII fragments (black rectangles below the gene model) and SNPs rs1916341 and rs2227574 (vertical black bars). Fragments harboring SNPs are outlined in red. The percentage of reads (bottom) from each 4C sample at 2 SNPs that contain either the allele from the disease chromosome or the other allele. Dashed black line show the expected frequency of QPD alleles based on 1.5 copy (ie, 0.66). Numbers below bars correspond to the total number of reads mapped to a given SNP. (E) Sanger sequencing chromatographs of 4C prelibrary PCR products from 2 control and 3 QPD samples. Genotypes are displayed in the format control allele > QPD allele. *P < .01; **P < .001; ***P < .0001 by 2-tailed binomial test.
Given these 4C-seq results, we asked if interactions between ENHQPD and PLAU in QPD megakaryocytes show a concordant bias for the disease chromosome. Genotyping results identified 2 independent PLAU SNPs in 4 QPD participants: rs1916341G>T and rs2227574delG (found on 2 distinct DpnII fragments; locations shown in Figure 5D). Allele-specific analysis of 4C-seq reads from the ENHQPD perspective revealed bias in the percentage of reads containing the QPD allele for rs2227574 (expected, 66.6%; median, 92.3%; range observed, 82.0% to 100%) and for rs1916341 (expected, 66.6%; median, 88.0%; range observed, 61.9% to 95.2%) (Figure 5D). Sanger sequencing on 4C libraries for 1 control sample (C8) that was heterozygous at rs1916341 supports that both alleles were detected at similar levels in control megakaryocytes (Figure 5E). Together, our findings indicate that QPD results in allele-specific ectopic interactions between PLAU and ENHQPD, suggesting that sub-TAD organization is disrupted on the disease chromosome.
Discussion
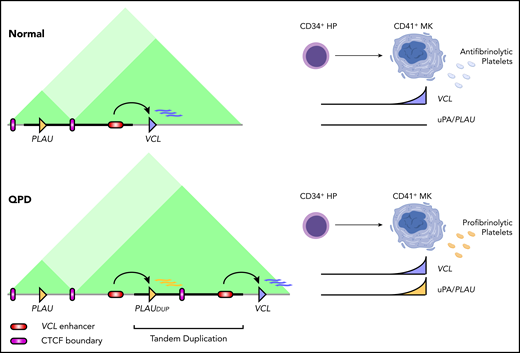
The question of how a single tandem duplication results in a profound cell-type–specific overexpression of the clot-breaking enzyme PLAU in QPD has been a long-standing mystery. In this study, QPD duplication positioned a copy of PLAU within a neighboring sub-TAD, placing it under the control of a conserved megakaryocyte enhancer (Figure 6). Given the association of H3K27me3 with the native PLAU promoter in normal megakaryocytes, and the loss of H3K27me3 specific to the disease chromosome in QPD (supplemental Figure 2), we also propose that the magnitude of PLAU expression in QPD stems from a loss of epigenetic silencing at a strong PLAU promoter that is triggered via activation by ENHQPD during megakaryopoiesis. The mechanism offers an explanation for the >100-fold increased uPA in QPD platelets that increase risks for experiencing challenge-related bleeding, heavy menstrual bleeding, joint bleeds, spontaneous hematuria (in those with the highest platelet uPA levels), and wound-healing problems that respond to antifibrinolytic therapy.7,53
Model of enhancer adoption in QPD. Regulatory interactions at the PLAU locus in megakaryocytes for control (top) vs the QPD (bottom) chromosome. Dark green rectangles mark sub-TADPLAU and sub-TADVCL. Bold black line marks the QPD duplication. HP, hematopoietic progenitor; MK, megakaryocyte.
Model of enhancer adoption in QPD. Regulatory interactions at the PLAU locus in megakaryocytes for control (top) vs the QPD (bottom) chromosome. Dark green rectangles mark sub-TADPLAU and sub-TADVCL. Bold black line marks the QPD duplication. HP, hematopoietic progenitor; MK, megakaryocyte.
Although several lines of evidence support our model, including experiments using primary cells for individuals with QPD, further mechanistic insight could be gained from future experiments that attempt to reconstruct a minimal QPD duplication through the insertion of ENHQPD within the existing PLAU sub-TAD domain. Such an experiment could clarify the contribution of ENHQPD from the larger sub-TAD rearrangement in QPD which includes additional genomic elements: for example, duplication of the conserved CTCF binding sites at the downstream boundary of sub-TADPLAU that have been demonstrated to be involved in long-range chromatin interactions.
An increasing number of human congenital disorders and cancers have been shown to involve disruptions in 3-dimensional (3D) genome architecture that give rise to ectopic enhancer-gene interactions and consequent pathological changes in gene expression.54-62 Disruptions in TAD architecture explain the mechanistic basis of many seminal leukemogenic structural mutations that bring transcriptional enhancers in proximity to proto-oncogenes (reviewed in Bhagwat et al63 and Bresnick and Johnson64 ), such as the t(8;14) translocation involving the IgH 3′ enhancer and MYC in Burkitt lymphoma,65 the t(4;14) translocation involving IgH enhancers and MMSET in multiple myeloma,66 and the 3q21;q26 inversion involving GATA2 h-77 enhancer and MECOM in AML.67,68 Together, these diseases, referred to as “enhanceropathies” or “tadopathies,”69 highlight enhancer dysfunction resulting from disrupted 3D genome architecture as an emerging cause of human disease.
The majority of enhanceropathies/tadopathies reported thus far describe megabase- or chromosome-scale rearrangements that span the boundaries of megabase-scale TADs.54,56,57 Through fine-mapping of enhancers, CTCF boundary elements, and 3D chromatin architecture in a disease-relevant cell type, we demonstrated that QPD is a unique bleeding disorder enhanceropathy/tadopathy arising from disruption of a single-gene sub-TAD. We predict that other mutations that either disrupt local sub-TAD architecture or juxtapose PLAU and ENHQPD in the absence of an intervening boundary element could similarly cause a QPD-like defect. Our findings demonstrate how rewiring of structural elements within TADs can impact evolutionarily conserved cell-type–specific regulatory logic to result in human disease and underscores the importance of considering sub-TAD DNA topology when studying structural genomic variations such as inversions, duplications, and deletions.54,56
The raw sequencing data sets have been deposited in the European Genotype-phenome Archive (accession number EGAS00001004315) with controlled-access administered by C.P.M.H., as stipulated by participants’ consent forms.
All count-level QPD and control ChIP-seq data sets can be downloaded and inspected from the following WashU epigenome browser session site: http://epigenomegateway.wustl.edu/legacy/?genome=hg19&session=rGXGCUCEpa&statusId=423397932. The 4C-seq count data in the format generated by 4Cseqpipe are available in the online data supplement; all previously published data sets used in this publication are listed in the supplemental Methods. Further information and requests regarding data and data analysis should be directed to the corresponding authors: C.P.M.H. (haywrdc@mcmaster.ca) and M.D.W. (michael.wilson@sickkids.ca).
The online version of this article contains a data supplement.
The publication costs of this article were defrayed in part by page charge payment. Therefore, and solely to indicate this fact, this article is hereby marked “advertisement” in accordance with 18 USC section 1734.
Acknowledgments
The authors thank the persons with QPD and volunteers who served as controls for participating in the study; The Centre for Applied Genomics (TCAG) for assistance with next-generation sequencing; Bing Ren for training in the 4C-seq method and analysis; and Alejandra Medina-Rivera, Mathieu Lupien, and Lincoln Stein for helpful advice regarding experiments and analysis.
Funding for this project was provided by Canadian Institutes of Health Research (CIHR) grant 201603PJT-364832 (C.P.M.H., J.A.M., M.D.W.); an Early Researcher Award from the Ontario Ministry of Research and Innovation and Tier 2 Canada Research Chairs from CIHR (M.D.W.); a Sickkids Restracomp Fellowship (M.L.); the Natural Sciences and Engineering Research Council of Canada-Canada Graduate Scholarships-Master’s Program (NSERC-CGS-M) (L.A.); and a Youth Abroad Scholarship from the Ministry of Education of Azerbaijan (A.A.). This study made use of data generated by the Blueprint Consortium. A full list of the investigators who contributed to the generation of the data is available from http://www.blueprint-epigenome.eu. Funding for Blueprint was provided by the European Union’s Seventh Framework Programme (FP7/2007-2013) under Grant Agreement 282510-Blueprint.
Authorship
Contribution: M.L. performed bioinformatic analyses and 4C experiments and led the writing of the manuscript; A.S., L.A., L.U.-R., S.A.A., and S.T. performed ChIP-seq experiments; A.A., S.T., L.E.A., and J.A.M. performed and designed the luciferase assays. A.S. and S.T. obtained control samples and performed megakaryocyte cell cultures, genotyping, and qPCR experiments; X.Y. and I.C.S. designed and performed zebrafish experiments; C.P.M.H. and G.-É.R. obtained QPD samples; A.D.P., C.P.M.H., J.A.M., and M.D.W. were involved in conceptualization, supervision, funding acquisition, data interpretation, and experimental design; and all authors edited and approved the manuscript.
Conflict-of-interest disclosure: The authors declare no competing financial interests.
Correspondence: Catherine P. M. Hayward, Department of Pathology and Molecular Medicine, McMaster University, Hamilton, ON L8N 3Z5, Canada; e-mail: haywrdc@mcmaster.ca; and Michael D. Wilson, SickKids Research Institute, 686 Bay St, Room 14.9712, Toronto, ON M5G 0A4, Canada; e-mail: michael.wilson@sickkids.ca.
REFERENCES
Author notes
C.P.M.H. and M.D.W. contributed equally to this study.

This feature is available to Subscribers Only
Sign In or Create an Account Close Modal