Abstract
Enrolled subjects were 7 children diagnosed with JMML in Nanfang Chunfu Children's Institute Hematology & Oncology Research according to the 2016 WHO standard from January 2019 to July 2020. Bone marrow samples were collected from all 7 children before and after the decitabine treatment. DNA extraction was successfully performed in all 7 cases of before group. And DNA extraction was successfully performed in only 4 cases of after group, while was failed in the rest of 3 cases. 11 DNA samples that were successfully extracted and qualified for quality control (7 cases before treatment, 4 cases after treatment) were subjected to chip experiments according to the Illumina Infinium Methylation EPIC 850K BeadChip manufacture protocol. The BMIQ algorithm is used to standardize methylation level β value. The enrolled cases were divided into two groups before and after treatment with decitabine, and the difference in β value before and after treatment was compared. The criteria for differential screening are: ∣Δβ∣≥0.1, P<0.01. Then through the visualization of DMP display, GO and KEGG function enrichment and related signal pathways, explore the mechanism of demethylation of decitabine in the treatment of JMML. Public database JMML gene expression dataset and independent JMML validation cohort was used for mechanism validation.
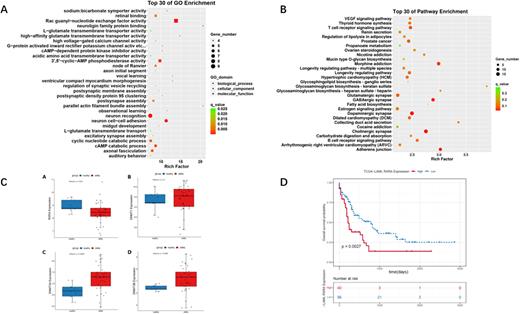
1. From the β value density curve and box plot, it can be seen that the β value of JMML children has a "bimodal" pattern, but the density of high methylation sites is significantly higher than that of low methylation sites. Screening for differential methylation sites through the champ. DMP function, a total of 2310 differentially methylated positions that meet the screening criteria were obtained, accounting for 0.26% of the methylation coverage of 850K chip, indicating that demethylation drugs have an effect on the overall high methylation level loci, but number of points does not affected much. Through DMP scatter plots, volcano plots and cluster analysis, it is found that each enrolled child with JMML has a specific abnormally hypermethylation pattern, and demethylation treatment is to reduce the degree of methylation of certain CpG sites under the specific hypermethylation pattern of each patient. 2. Perform GO and KEGG function enrichment analysis on the genes adjacent to the 2310 differentially methylated sites that have been screened out. In the GO enrichment analysis, it is found that the activity of PI3K/AKT pathway showed the highest adjacent gene enrichment with significant P value(Figure 1.A). In the KEGG enrichment analysis(Figure 1.B), it is found that DMP has the highest degree of enrichment in genes that affect signal transduction, indicating that demethylation therapy has the greatest impact on the signal transduction process within/between the signal pathway. Combined with the results of GSEA, it is suggested that decitabine may reduce the methylation of some related genes in the PI3K/AKT signaling pathway near the CpG site, thereby inhibiting the abnormal activation of the PI3K/AKT signaling pathway, so as to achieve the effect of treating JMML. In the validation cohort, it was confirmed that the expression of phosphorylated PI3K/AKT protein was significantly decreased after decitabine treatment compared with before treatment.
3. A total of 5 motifs were obtained by motif analysis, and these motifs correspond to a total of 22 transcription factors, namely INSM1, SP1, T, EBF1, Egr1, EWSR1-FLI1, FEV Hand1::Tcfe2a, IRF1, Klf4, Myf , NFATC2, NFE2L2, NHLH1, PPARG::RXRA, RXR::RAR_DR5, SPI1, Spz1, Stat3, Tal1::Gata1, TFAP2A, Zfp423; the upstream transcription factors of the target genes DNMT1, DNMT3A and DNMT3B of decitabine. The 165 possible transcription factors were intersected with the transcription factors corresponding to the motif analysis, and the common transcription factor was the RXRA gene. GSE71935 dataset in the GEO contains gene expression data of 38 JMML patients and 9 normal healthy controls, confirming that JMML patients have decreased RXRA gene expression and increased DNMT3A and DNMT3B expression relative to healthy donors group(Figure 1.C/D).
Disclosures
No relevant conflicts of interest to declare.
Author notes
Asterisk with author names denotes non-ASH members.


This feature is available to Subscribers Only
Sign In or Create an Account Close Modal