Key Points
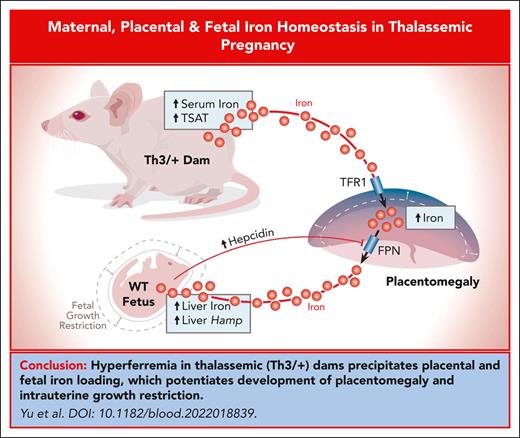
Hyperferremia in thalassemic dams caused iron loading of Th3/+ and WT fetuses, potentiating intrauterine (fetal) growth restriction.
Hepatic Hamp was transactivated in iron-loaded fetuses; fetal hepcidin likely repressed placental ferroportin, thus mitigating iron loading.
Abstract
Pregnancy rates in β-thalassemia are increasing but the risk of complications is higher; thus, better understanding of maternal and fetal iron homeostasis in this disorder is needed. HbbTh3/+ (Th3/+) mice model human β-thalassemia. Both the murine and human diseases are characterized by low hepcidin, high iron absorption, and tissue iron overload, with concurrent anemia. We hypothesized that disordered iron metabolism in pregnant Th3/+ mice would negatively affect their unborn offspring. The experimental design included these groups: wild-type (WT) dams carrying WT fetuses (WT1); WT dams carrying WT and Th3/+ fetuses (WT2); Th3/+ dams carrying WT and Th3/+ fetuses (Th3/+); and age-matched, nonpregnant adult females. Serum hepcidin was low, and mobilization of splenic and hepatic storage iron was enhanced in all 3 groups of experimental dams. Intestinal 59Fe absorption was lower in Th3/+ dams (as compared with WT1/2 dams) but splenic 59Fe uptake was higher. Th3/+ dams had hyperferremia, which led to fetal and placenta iron loading, fetal growth restriction, and placentomegaly. Notably, Th3/+ dams loaded Th3/+ and WT fetuses, with the latter situation more closely mirroring human circumstances when mothers with thalassemia have relatively unaffected (thalassemia trait) offspring. Iron-related oxidative stress likely contributed to fetal growth impairment; enhanced placental erythropoiesis is a probable cause of placental enlargement. Moreover, high fetal liver iron transactivated Hamp; fetal hepcidin downregulated placental ferroportin expression, limiting placental iron flux and thus mitigating fetal iron loading. Whether gestational iron loading occurs in human thalassemic pregnancy, when blood transfusion can further elevate serum iron, is worth consideration.
Introduction
β-Thalassemia is a hereditary blood disorder caused by impaired production of hemoglobin (Hb) β-globin chains, resulting in a profound anemia with concurrent iron loading.1 In β-thalassemia major, β-globin protein synthesis is very low or absent, causing a profound anemia. Individuals affected by β-thalassemia major accumulate excess iron in parenchymal tissues because of inappropriately elevated intestinal iron absorption and frequent blood transfusion.2 In β-thalassemia intermedia (βTI), β-globin production is less diminished, ameliorating the need for regular blood transfusions3; nonetheless, iron loading occurs because of increased erythropoietic demand, suppression of hepcidin expression, and consequent excessive absorption of dietary iron.4,5 Hepcidin is a liver-derived, peptide hormone that regulates serum iron concentrations by targeting the iron exporter, ferroportin (FPN), for internalization and degradation in cells that absorb, recycle, and store iron. βTI has been modeled in HbbTh3/+ (Th3/+) mice; disease etiology and pathological features are comparable in the murine and human disorders.6-9 Recent advances in clinical management of β-thalassemia have improved life expectancy and quality of life substantially for patients who are affected.10,11 Hence, an increasing number of women with this disease choose to have children.12 Because of anemia and cardiac, hepatic, and endocrine iron overload, increased risk for adverse pregnancy outcomes emerges. A more thorough understanding of iron metabolism during pregnancy is not only of intrinsic interest but may also improve management of iron overload and pregnancy complications in woman with thalassemia.
Transfer of iron across the placental syncytiotrophoblast is facilitated by transferrin receptor 1 (TFR1), mediating endocytosis of diferric transferrin from the maternal blood, and ferroportin 1 (FPN1), releasing iron into the fetal circulation.13-15 Maternal hepcidin is a key regulator of iron homeostasis during pregnancy.16 Depletion of body iron stores and increased erythroid demand for iron cause a downregulation of hepatic Hamp expression, decreasing hepcidin production and enhancing intestinal iron absorption.17-22 Humans exhibit low hepcidin during pregnancy,23,24 as do rat and mouse models.25 The mechanism for maternal hepcidin suppression in pregnancy is unknown,26 but it likely involves a hormonal signaling loop involving erythropoietin (EPO) and erythroferrone (ERFE).27
In this investigation, we used the HbbTh3/+ mouse model to examine maternal, placental, and fetal iron metabolism during βTI. We hypothesized that pregnancy would accentuate development of iron-related pathologies in dams that are thalassemic, which would negatively impact developing fetuses. The experimental approach included wild-type (WT) and Th3/+ dams carrying fetuses of both genotypes, allowing us to see whether Th3/+ dams influenced WT fetuses and whether Th3/+ fetuses influenced maternal iron homeostasis. Notable outcomes included alterations in intestinal iron absorption and tissue distribution when comparing WT and Th3/+ dams, changes in iron transporter expression levels that could mediate this differential iron distribution, influences of thalassemic dams on fetuses of either genotype, and influences of βTI fetuses on maternal and WT fetus iron homeostasis.
Materials and methods
Animals and experimental design
All animal experimentation was approved by the University of Florida IACUC. C57BL/6 mice were purchased from Jackson Laboratories. HbbTh3/+ (Th3/+) mice (C57BL/6 background) were kindly provided by Stefano Rivella (Children’s Hospital of Philadelphia). Breeding pairs were established with 12-week-old adult mice for timed pregnancy studies as follows: WT males × WT females (WT1); Th3/+ males × WT females (WT2); and WT males × Th3/+ females (Th3/+). Age-matched, nonpregnant (NP) WT and Th3/+ female mice served as controls (Table 1). Mice were fed an AIN-76A-based diet containing ∼50 ppm iron (TD.130018; Envigo). Fetuses were removed at 16 to 18 days of gestation.
Experimental mice used in this investigation
| Females . | Females (n) . | Male breeders . | Fetal genotype(s) . | Fetuses (n) . |
|---|---|---|---|---|
| WT1 dams | 5-6 | WT | WT | 23 |
| WT2 dams | 5 | Th3/+ | WT & Th3/+ | WT (10); Th3/+ (15) |
| Th3/+ dams | 5-6 | WT | WT & Th3/+ | WT (10); Th3/+ (13) |
| NP-WT | 5 | --- | --- | --- |
| NP-Th3/+ | 5 | --- | --- | --- |
Iron physiology study
Whole blood was collected from dams at euthanasia and used for complete blood count analysis and reticulocyte counting. A light duodenal scrape was used for messenger RNA (mRNA) or protein isolation. Maternal and fetal organs were removed, weighed, and stored at −80°C. Bone marrow was flushed from the femurs of dams for mRNA isolation. Serum ferritin (ab157713; Abcam) and EPO (MEP00B; R&D Systems) were quantified by enzyme-linked immunosorbent assay. Serum and tissue nonheme iron (NHI) concentrations, total iron-binding capacity (TIBC), and percent transferrin saturation (TSAT) were quantified, as previously described.28-30
Iron absorption study
Pregnant females were fasted for 2 hours and then gavaged with a 59Fe transport solution, as previously described.31,32 Food was provided immediately after gavage. After 24 hours, mice were euthanized, and fetuses were removed. Blood samples were collected, and the entire gastrointestinal (GI) tract was removed. Maternal and fetal organs were also collected. 59Fe activity was measured using a gamma counter (2480 Wizard2; Perkin Elmer). Radioactive counts per minute (CPMs) were normalized by weight (for tissues) or volume (for blood). Intestinal iron absorption was calculated as [(CPM in the carcass + CPM in blood) – (CPM in the entire GI tract)/(total CPM in the transport solution)] × 100.
Real-time quantitative polymerase chain reaction and western blot analysis
SYBR-Green quantitative real-time polymerase chain reaction was performed as described previously.33,34 Primer sequences are listed in supplemental Table 1, available on the Blood website. Protein was isolated from duodenal scrapes, and from the liver, spleen, and placenta using a membrane protein extraction kit (catalog [cat.] # 89842; Thermo-Fisher Scientific). Proteins (20 μg) were separated on 10% polyacrylamide gels, then transferred to PVDF membranes. Membranes were blocked in Odyssey blocking buffer (Licor), and then incubated with the following antibodies: DMT1 (1:2000; kindly provided by François Canonne-Hergaux, see “Acknowledgments”), FPN1 (1:2000; cat. # MTP11-A, Alpha Diagnostics), ferritin (1:2000; cat. # ab75973, Abcam), transferrin receptor (1:2000; cat. # H68.4, Invitrogen), and β-actin (1:50 000; cat. # 66009-1-lg, Proteintech). Antibody validation is outlined in supplemental Methods. Blots were then incubated with secondary antibodies (1:10 000; cat. # 925-32213 or cat. # 926-68072, Licor), and then imaged using a Licor Odyssey CLx instrument (model 9141-02V). Protein band intensities were normalized to β-actin band intensities.
Statistical analyses
Data were analyzed by one-way analysis of variance, which compared all groups to one another. When a significant main effect was noted by one-way analysis of variance, a Tukey multiple comparisons test was then used to establish significance among different experimental groups (GraphPad Prism, version 8.0). Departures from normal distribution were detected using the D’Agostino and Pearson goodness-of-fit test. The Brown-Forsythe test or Levene test was used to check for equal variance. Some data were log transformed afterward; nontransformed data, however, are shown in the figures to aid in visual interpretation. P < .05 was considered statistically significant.
Results
Th3/+ dams had cardiomegaly and splenomegaly
WT and Th3/+ mice had similar sized litters, averaging 7 to 8 pups. Body weight (31-33 g), and liver (∼5%), kidney (∼1%), and pancreas (0.4%-0.45%) weights, as a percentage of total body weight, were comparable among all groups of pregnant mice. Pregnant Th3/+ mice, however, had grossly enlarged spleens (∼2% of body weight vs ∼0.25% in WTs), and hearts were also enlarged (∼0.56% vs ∼0.40%) (P < .001 for both). Splenomegaly, due to stress erythropoiesis, and cardiomegaly, generally typify the anemia associated with βTI.
Th3/+ and WT2 dams were hyperferremic
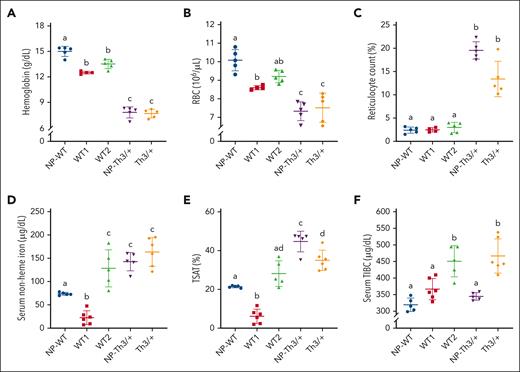
Complete blood counts showed mild physiological anemia of pregnancy in WT1 and WT2 dams (Figure 1; Table 2), as expansion of the maternal plasma volume outpaces expansion of the red blood cell (RBC) mass.35 Th3/+ mice, both NP and pregnant, displayed hypochromic anemia with reticulocytosis and anisopoikilocytosis (Figure 1; Table 2), but these descriptors were mainly unaffected by pregnancy. These observations are consistent with previous reports on Th3/+ mice and reflect the known etiology of βTI.36 Serum iron and TSAT were reduced in WT1 dams (relative to NP-WT controls), yet, unexpectedly, both parameters increased in WT2 dams that carried Th3/+ fetuses (Figure 1D-E). Serum TIBC was similar in NP WTs and WT1 dams but elevated in WT2 dams (Figure 1F). In NP Th3/+ mice, as expected, serum iron and TSAT were elevated and TIBC was normal, whereas pregnant Th3/+ mice had elevated serum iron, TSAT, and TIBC. These data demonstrate that Th3/+ fetuses affected iron homeostasis in WT2 dams such that they more closely reflected aspects of the thalassemic phenotype (like Th3/+ dams).
Effect of pregnancy on hematological and iron-related blood parameters in dams of both genotypes. (A) Hb levels; (B) RBC count; (C) reticulocyte count; (D) serum NHI; (E) TSAT; (F) TIBC. Data represent mean ± standard deviation (SD) for n = 6 mice per group (WT1 and Th3/+) or n = 5 mice per group (WT2, NP-WT, and NP-Th3/+). Data were analyzed by one-way analysis of variance (ANOVA) followed by Tukey multiple comparisons test. Groups labeled with different letters are significantly different from one another (P < .05). Significant main effects: panels A-F, P < .0001.
Effect of pregnancy on hematological and iron-related blood parameters in dams of both genotypes. (A) Hb levels; (B) RBC count; (C) reticulocyte count; (D) serum NHI; (E) TSAT; (F) TIBC. Data represent mean ± standard deviation (SD) for n = 6 mice per group (WT1 and Th3/+) or n = 5 mice per group (WT2, NP-WT, and NP-Th3/+). Data were analyzed by one-way analysis of variance (ANOVA) followed by Tukey multiple comparisons test. Groups labeled with different letters are significantly different from one another (P < .05). Significant main effects: panels A-F, P < .0001.
Hematological parameters of experimental mice
| Experimental Group . | Hct (%) . | Mean cell volume (fL) . | Mean cell Hb (pg) . | Mean cell Hb concentration (g/dL) . | Hb distribution width (g/dL) . | Red cell distribution width (%) . |
|---|---|---|---|---|---|---|
| WT1 | 45.3 ± 1.59a | 52.7 ± 1.65 | 14.6 ± 0.05a | 27.7 ± 0.79a | 2.2 ± 0.08a | 14.7 ± 0.40a |
| WT2 | 47.3 ± 1.57a | 51.4 ± 0.68 | 14.7 ± 0.22a | 28.6 ± 0.23a | 2.0 ± 0.10a | 15.1 ± 0.59a |
| Th3/+ | 36.5 ± 1.19b | 49.0 ± 4.57 | 10.3 ± 0.48b | 21.0 ± 1.01b | 4.2 ± 0.06b | 33.6 ± 0.53b |
| P | <.0001 | .2168 | <.0001 | <.0001 | <.0001 | <.0001 |
Data represent means ± standard deviation for n = 5 or 6 mice per group and were analyzed by one-way analysis of variance with Tukey multiple comparisons test. Groups labeled with different letters vary significantly (P < .05).
Hct, hematocrit.
EPO-ERFE signaling represses Hamp in Th3/+ dams
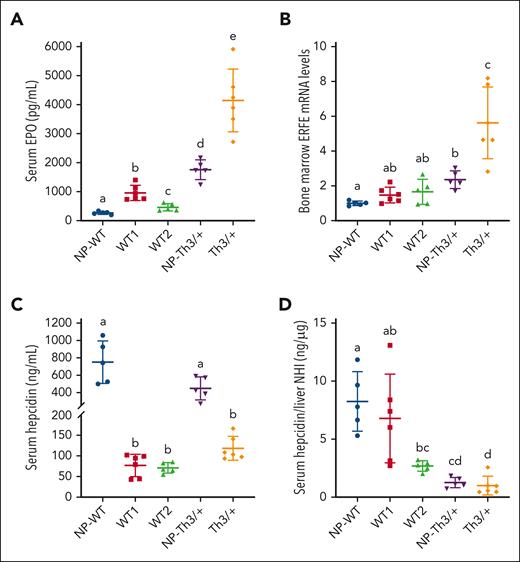
When erythroid demand for iron increases, renal EPO release increases. Circulating EPO stimulates production of red cells in the bone marrow and increases ERFE expression in erythrocyte precursors.18,27 ERFE downregulates hepatic Hamp, decreasing hepcidin levels, and enhancing iron absorption. This circuitry is augmented in β-thalassemia and in Th3/+ mice. Serum EPO increased several fold in WT1 dams, whereas the increase in WT2 dams was smaller (Figure 2A). EPO levels were elevated in NP Th3/+ mice but were the highest in pregnant Th3/+ mice. Bone marrow ERFE mRNA expression was significantly elevated in NP-Th3/+ mice and further elevated in pregnant Th3/+ mice (Figure 2B). ERFE mRNA levels accurately reflect circulating hormone levels.18 Serum hepcidin levels were drastically lower in pregnant mice of both genotypes (Figure 2C) but did not significantly vary between WT1, WT2, or Th3/+ dams, despite notable iron loading in the thalassemic mice. Indeed, the ratio of serum hepcidin (Figure 2C) to liver NHI (Figure 3A) was the lowest in pregnant Th3/+ animals (Figure 2D). These data support notably increased erythropoietic activity in Th3/+ dams, suppressing hepcidin strongly even in the face of maternal iron overload, likely via enhanced EPO/ERFE/Hamp signaling.
EPO-ERFE-Hamp signaling axis in dams of both genotypes. (A) Serum EPO levels, (B) relative bone marrow ERFE mRNA expression levels, and (C) serum hepcidin concentrations. (D) Serum hepcidin is low relative to iron load (Figure 3A) in Th3/+ dams and in WT dams carrying Th3/+ fetuses (WT2 group). Data represent mean ± SD for n = 5 (WT2, NP-WT, and NP-Th3/+) or 6 (WT1 and Th3/+) mice per group and were analyzed by one-way ANOVA followed by Tukey multiple comparisons test. Groups labeled with different letters are significantly different from one another (P < .05). Main effects: panels B-D, P < .01; panel A, P < .001.
EPO-ERFE-Hamp signaling axis in dams of both genotypes. (A) Serum EPO levels, (B) relative bone marrow ERFE mRNA expression levels, and (C) serum hepcidin concentrations. (D) Serum hepcidin is low relative to iron load (Figure 3A) in Th3/+ dams and in WT dams carrying Th3/+ fetuses (WT2 group). Data represent mean ± SD for n = 5 (WT2, NP-WT, and NP-Th3/+) or 6 (WT1 and Th3/+) mice per group and were analyzed by one-way ANOVA followed by Tukey multiple comparisons test. Groups labeled with different letters are significantly different from one another (P < .05). Main effects: panels B-D, P < .01; panel A, P < .001.
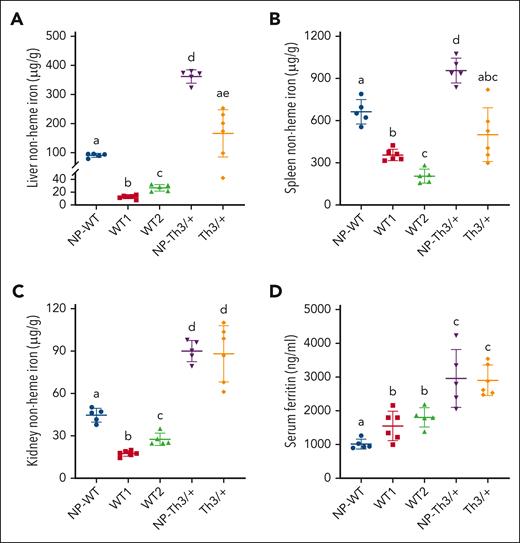
Effects of pregnancy on selected iron parameters in WT and Th3/+ mice. NHI levels in the liver (A), spleen (B), and kidney (C), and serum ferritin concentrations (D). Data represent mean ± SD for n = 6 mice per group (WT1 and Th3/+) or n = 5 mice per group (WT2, NP-WT, and NP-Th3/+). Data were analyzed by one-way ANOVA followed by Tukey multiple comparisons test. Groups labeled with different letters are significantly different from one another (P < .05). Significant main effects: panels A-D, P < .0001.
Effects of pregnancy on selected iron parameters in WT and Th3/+ mice. NHI levels in the liver (A), spleen (B), and kidney (C), and serum ferritin concentrations (D). Data represent mean ± SD for n = 6 mice per group (WT1 and Th3/+) or n = 5 mice per group (WT2, NP-WT, and NP-Th3/+). Data were analyzed by one-way ANOVA followed by Tukey multiple comparisons test. Groups labeled with different letters are significantly different from one another (P < .05). Significant main effects: panels A-D, P < .0001.
Iron loading in WT dams carrying Th3/+ fetuses
Pregnant mice of both genotypes had diminished liver and spleen NHI content compared with NP controls, with overall levels higher in Th3/+ mice (Figure 3A-B), suggesting mobilization of hepatic and splenic storage iron in both WT and Th3/+ dams. Renal and cardiac NHI content was lower in WT dams (as compared with NP-WTs), whereas cardiac NHI was unchanged and renal NHI levels remained elevated in Th3/+ dams (Figure 3C; Table 3). Serum ferritin was similarly elevated in both groups of pregnant WT mice (∼50%), and even higher in NP and pregnant thalassemic mice (∼2-fold increase) (Figure 3D). Furthermore, hepatic and renal NHI was modestly elevated and splenic NHI was modestly lower in WT2 dams (Figure 3A-C), as compared with WT1 dams, indicating that Th3/+ fetuses affected maternal iron distribution. Increased liver and kidney iron probably relates to elevations in serum iron in WT2 dams.
Tissue NHI levels of experimental mice
| Experimental Group . | Pancreas NHI (ug/g) . | Heart NHI (ug/g) . |
|---|---|---|
| NP-WT | 22.51 ± 3.31 | 49.94 ± 7.46a |
| WT1 | 19.46 ± 5.15 | 43.00 ± 2.53b |
| WT2 | 15.93 ± 1.49 | 34.93 ± 1.19c |
| NP-Th3/+ | 19.69 ± 2.54 | 44.77 ± 2.43ab |
| Th3/+ | 23.76 ± 8.53 | 42.42 ± 2.20b |
| P | .0805 | <.0001 |
Data represent means ± standard deviation for n = 5 or 6 mice per group and were analyzed by one-way ANOVA with Tukey multiple comparisons test. Groups labeled with different letters vary significantly (P < .05).
Percentage of absorbed 59Fe in organs and remaining in carcasses
| Tissue . | NP-WT . | WT1 . | WT2 . | NP-Th3/+ . | Th3/+ . | P . |
|---|---|---|---|---|---|---|
| Kidney | 2.1 ± 0.46a | 0.7 ± 0.18b | 0.9 ± 0.19b | 1.7 ± 0.24a | 1.0 ± 0.09b | .0371 |
| Heart | 0.6 ± 0.08a | 0.2 ± 0.08b | 0.3 ± 0.10b | 0.8 ± 0.22a | 0.7 ± 0.21a | .0024 |
| Pancreas | 0.4 ± 0.11a | 0.1 ± 0.02b | 0.1 ± 0.04c | 0.4 ± 0.19a | 0.2 ± 0.02c | .0041 |
| Carcass | 81.5 ± 0.99a | 21.0 ± 8.95b | 11.3 ± 4.92b | 43.4 ± 7.84c | 16.1 ± 6.25b | .0001 |
Data were compared across experimental groups of mice (each on an individual row). Data represent means ± standard deviation for n = 5 mice per group and were analyzed by one-way ANOVA followed by Tukey multiple comparisons test. Experimental groups across individual rows labeled with different letters vary significantly (P < .05).
Th3/+ dams absorb less dietary iron than their WT counterparts
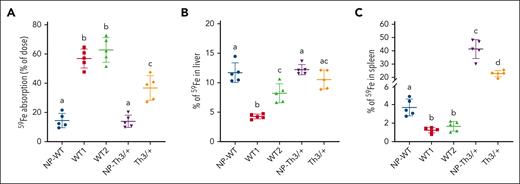
59Fe absorption increased 3.8-fold in WT mice, from ∼16% of the dose in NP females to ∼60% in pregnancy (Figure 4A). In NP-Th3/+ mice, 59Fe absorption was comparable with NP-WT controls, reflecting similar circulating hepcidin levels (Figure 2C). Although iron absorption is known to be elevated in Th3/+ mice,9 weanlings and adolescents primarily exhibit this increase, with iron absorption normalizing into adulthood. In pregnant Th3/+ mice, as in WT dams, 59Fe absorption was elevated; however, the magnitude of increase was only 2.3-fold, from ∼16% in NP-Th3/+ mice to ∼37% in pregnant Th3/+ mice. This difference in absorption occurred despite similar circulating hepcidin levels in pregnant mice of both genotypes (Figure 2C). Distribution of absorbed 59Fe revealed 10% to 12% of absorbed 59Fe in the liver of NP-WT, Th3/+ females, and Th3/+ dams, whereas pregnant WT mice accumulated slightly less iron in the liver (WT1, ∼5%; WT2, ∼8%) (Figure 4B). WT controls had ∼4% of absorbed 59Fe in their spleens, with lesser levels in both groups of WT dams (Figure 4C). Strikingly, >40% of absorbed iron was observed in the spleen of NP-Th3/+ mice, with a slight reduction noted in pregnant Th3/+ mice (but still ∼20-fold higher than in WT dams), reflecting a high rate of extramedullary erythropoiesis in Th3/+ mice. Notable observations from these experiments are: (1) intestinal iron absorption was more strongly upregulated in WT dams than in Th3/+ dams; and (2) a much larger percentage of iron is trafficked to the spleen in Th3/+ mice. Important implications of these findings are that WT mice rely more on dietary iron to meet the demands of pregnancy, and that enhanced stress erythropoiesis makes the spleen an “iron sink” in Th3/+ mice.
Selected iron (59Fe) absorption into organs of pregnant WT and Th3/+ mice. (A) Intestinal iron absorption was quantified after oral, intragastric gavage of an 59Fe test dose, and presented as the percentage of radioactivity present in the animals (minus 59Fe trapped in the gut) 24 hours after dosing. Also shown is the distribution of 59Fe in the liver (B) and the spleen (C), which is presented as the percentage of absorbed 59Fe in each tissue. Results represent mean ± SD for n = 5 animals per group and were analyzed by one-way ANOVA followed by Tukey multiple comparisons test. Groups labeled with different letters are significantly different from one another (P < .05). Main effects: panels A-C, P < .0001. 59Fe accumulation in other tissues and that remaining in the carcasses after dissection of all other tissues are presented in Table 4.
Selected iron (59Fe) absorption into organs of pregnant WT and Th3/+ mice. (A) Intestinal iron absorption was quantified after oral, intragastric gavage of an 59Fe test dose, and presented as the percentage of radioactivity present in the animals (minus 59Fe trapped in the gut) 24 hours after dosing. Also shown is the distribution of 59Fe in the liver (B) and the spleen (C), which is presented as the percentage of absorbed 59Fe in each tissue. Results represent mean ± SD for n = 5 animals per group and were analyzed by one-way ANOVA followed by Tukey multiple comparisons test. Groups labeled with different letters are significantly different from one another (P < .05). Main effects: panels A-C, P < .0001. 59Fe accumulation in other tissues and that remaining in the carcasses after dissection of all other tissues are presented in Table 4.
Placental iron flux is repressed in Th3/+ dams
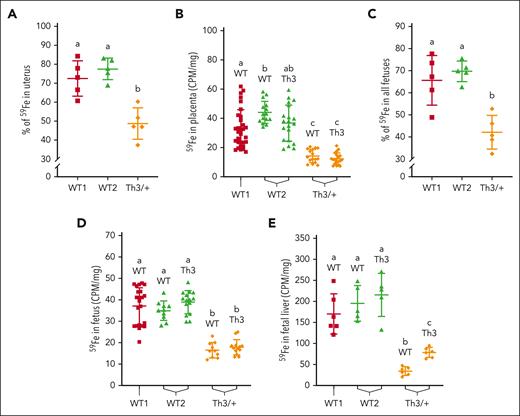
A large percentage of absorbed 59Fe (70%-80%) was detected in intact uteruses (containing the feto-placental units) of both groups of WT dams (Figure 5A), whereas in Th3/+ dams, only ∼50% of absorbed 59Fe was found in the uterus. Radioactive counts in WT and Th3/+ placentas from Th3/+ dams were lower than in the placentas from either WT group (Figure 5B). Total percent radioactivity in all fetuses from each dam (Figure 5C) reflected the pattern of iron in undissected uteruses but values were slightly lower. 59Fe accumulation in individual fetuses and fetal livers reflected a similar pattern, with less 59Fe being present in fetuses/livers from Th3/+ dams (Figure 5D-E). These data demonstrate that delivery of dietary iron to developing fetuses was blunted in Th3/+ dams, presumably because they had higher tissue iron levels and could thus mobilize more storage iron (Figure 4C). Despite this distribution in late pregnancy, Th3/+ fetuses were iron loaded (see below), probably reflecting events earlier in pregnancy.
Iron (59Fe) delivery to developing fetuses in Th3/+ dams during late-stage pregnancy. Radiotracer iron was provided to mice after oral intragastric gavage; 24 hours later, 59Fe accumulation in the uteruses, placentas, and fetuses was measured. 59Fe amounts are presented as a percentage of total iron absorbed in the uteruses (A) and all the fetuses (C), or as radioactive counts (CPM per mg tissue) in the placentas (B), and in individual fetuses (D) and fetal livers (E). Data represent mean ± SD for n = 5 mice per group for panels A,C,E or n = 10 to 20 mice per group for panels B,D, and were analyzed by one-way ANOVA followed by Tukey multiple comparisons test. Groups labeled with different letters are significantly different from one another (P < .05). Significant main effects: panels A,C-E, P < .0001; panel B, P < .01.
Iron (59Fe) delivery to developing fetuses in Th3/+ dams during late-stage pregnancy. Radiotracer iron was provided to mice after oral intragastric gavage; 24 hours later, 59Fe accumulation in the uteruses, placentas, and fetuses was measured. 59Fe amounts are presented as a percentage of total iron absorbed in the uteruses (A) and all the fetuses (C), or as radioactive counts (CPM per mg tissue) in the placentas (B), and in individual fetuses (D) and fetal livers (E). Data represent mean ± SD for n = 5 mice per group for panels A,C,E or n = 10 to 20 mice per group for panels B,D, and were analyzed by one-way ANOVA followed by Tukey multiple comparisons test. Groups labeled with different letters are significantly different from one another (P < .05). Significant main effects: panels A,C-E, P < .0001; panel B, P < .01.
Differential expression of NHI transporters alters iron flux in Th3/+ dams
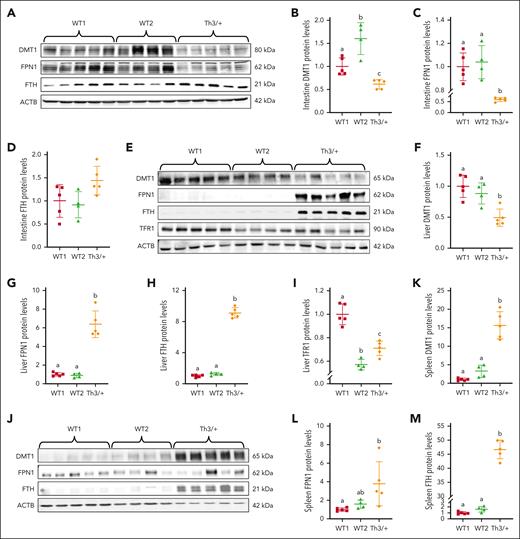
DMT1 and FPN1 expression in the duodenum was significantly lower in Th3/+ dams, whereas ferritin H chain+ (FTH) was higher, as compared with WT1 and WT2 dams (Figure 6A-D). Interestingly, this finding is specific to thalassemic pregnancy because NP Th3/+ mice had elevated DMT1 and unchanged FPN1 compared with NP-WT mice.37 Downregulation of duodenal DMT1 and FPN1 provides a mechanistic explanation for lower iron absorption in Th3/+ dams (Figure 4A). Low FPN1 activity in enterocytes increases intracellular iron, which secondarily decreases DMT1 levels via transcript degradation that occurs when iron-regulatory proteins (IRPs) do not bind to the DMT1 3′ iron-responsive element (IRE).38 How FPN1 is decreased is less clear, because hepcidin levels were the same in dams of both genotypes.
Expression of iron transport- and storage-related proteins in Th3/+ vs WT dams. Expression of DMT1, FPN1, and FTH in the intestine (A-D), the liver (E-I), and the spleen (J-M) was quantified by western blotting. Furthermore, because the liver acquires iron from circulating transferrin, hepatic TFR1 expression was also quantified (E,I). Expression of each protein was normalized to the expression of β-actin. Results represent mean ± SD for n = 4 mice (WT2) or n = 5 mice per group (WT1 and Th3/+) and were analyzed by one-way ANOVA followed by Tukey multiple comparisons test. Groups labeled with different letters are significantly different from one another (P < .05). Significant main effects (from P < .05-P < .0001) noted for all quantification data for panels B-M, except for intestinal FTH (D).
Expression of iron transport- and storage-related proteins in Th3/+ vs WT dams. Expression of DMT1, FPN1, and FTH in the intestine (A-D), the liver (E-I), and the spleen (J-M) was quantified by western blotting. Furthermore, because the liver acquires iron from circulating transferrin, hepatic TFR1 expression was also quantified (E,I). Expression of each protein was normalized to the expression of β-actin. Results represent mean ± SD for n = 4 mice (WT2) or n = 5 mice per group (WT1 and Th3/+) and were analyzed by one-way ANOVA followed by Tukey multiple comparisons test. Groups labeled with different letters are significantly different from one another (P < .05). Significant main effects (from P < .05-P < .0001) noted for all quantification data for panels B-M, except for intestinal FTH (D).
DMT1 and TFR1 expression was reduced by ∼50% in the livers of Th3/+ dams, whereas FPN1 and FTH were significantly upregulated (∼6.5-fold and ∼9-fold, respectively), as compared to WT1 and WT2 dams (Figure 6E-I). TFR1 mediates hepatic acquisition of transferrin-bound iron derived from the GI tract and blood, and DMT1 may also be involved in this process.39 Lower DMT1 expression is thus consistent with reduced absorption of dietary iron (Figure 4A) and the elevated liver iron content in Th3/+ dams (Figure 3A). High FPN1 expression likely reflects mobilization of hepatic storage iron. Differential liver FPN1 expression when comparing WT and Th3/+ dams is puzzling, because hepcidin levels did not vary among experimental groups (Figure 2C). This enigma implicates a hepcidin-independent mechanism for iron regulation during late-term pregnancy. One possibility is that FPN1 expression in WT dams is downregulated via interaction of its 5′ IRE with IRPs,40 whereas in Th3/+ dams, elevated hepatic iron content renders IRPs nonfunctional, thus, translation of FPN1 transcripts is derepressed, yielding more FPN1 protein.
In the spleen, robust increases in DMT1 (∼15-fold), FPN1 (∼4-fold), and FTH (>45-fold) protein expression were noted in Th3/+ dams (Figure 6J-M). DMT1 is required for iron acquisition from diferric transferrin by developing erythrocytes.41 High DMT1 expression is thus consistent with elevated splenic transferrin-bound iron uptake to support erythrocyte maturation.6,42 Although TFR1 expression was not measured, we predict that it would also have been highly expressed in the spleens of Th3/+ dams.
Collectively, these data demonstrate that differential expression of NHI transporters represses absorption of dietary iron, increases mobilization of hepatic storage iron, and elevates splenic iron uptake to support stress erythropoiesis in Th3/+ dams.
Placentomegaly and fetal growth restriction in thalassemic dams
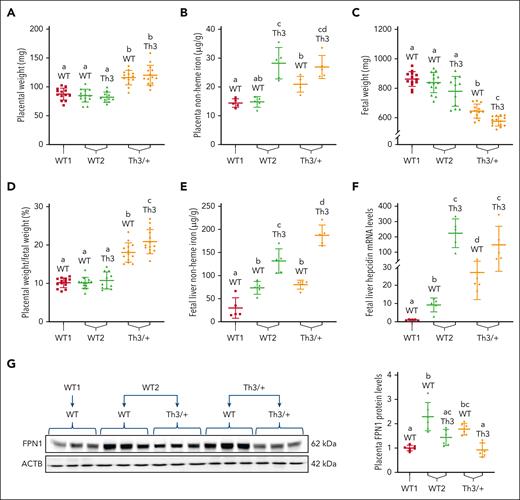
Placental FPN1 regulates iron flux from the dam to developing fetuses.16,26 Furthermore, fetal livers produce hepcidin,43 which logically participates in regulating iron flux between mother and offspring via the placenta. Placentas and fetuses from experimental dams were thus examined. Placental iron loading and placentomegaly were apparent in WT and Th3/+ fetuses from thalassemic dams (Figure 7A-B). The placentas of Th3/+ fetuses from WT2 dams also had elevated NHI (Figure 7B); however, they were not enlarged (Figure 7A). Moreover, fetal growth restriction of WT and Th3/+ fetuses from thalassemic dams was noted (Figure 7C), and placenta-to-fetal weight ratio was also elevated in this experimental group (Figure 7D). Fetal liver NHI content was elevated in fetuses from WT2 and Th3/+ dams, with Th3/+ fetuses having higher levels compared with their WT littermates (Figure 7E). A similar pattern was noted for fetal liver Hamp expression, with quite large increases noted in Th3/+ fetuses (Figure 7F). Interestingly, placental FPN1 protein expression in WT2 and Th3+ dams inversely correlated with fetal liver Hamp expression; that is, higher Hamp expression was associated with lower FPN1 levels (Figure 7G).
Placental and fetal iron homeostasis is dysregulated in dams carrying Th3/+ fetuses. (A) Placental weight was increased in Th3/+ dams. (B) Placental NHI. (C) Fetuses from thalassemic dams weighed less than those from WT dams, and (D) placental weight normalized by fetal weight was increased in Th3/+ dams. (E) Fetal liver iron and (F) liver hepcidin mRNA expression were elevated in fetuses from WT2 and Th3/+ group dams. Moreover, FPN1 expression was quantified in the placentas. (G) FPN1 expression was normalized to expression of β-actin, which did not vary significantly among experimental groups. Results represent mean ± SD for n = 5 mice per group and were analyzed by one-way ANOVA followed by Tukey multiple comparisons test. Groups labeled with different letters are significantly different from one another (P < .05). Significant main effects: panels A-E,G, P < .001; panel F, P < .0001.
Placental and fetal iron homeostasis is dysregulated in dams carrying Th3/+ fetuses. (A) Placental weight was increased in Th3/+ dams. (B) Placental NHI. (C) Fetuses from thalassemic dams weighed less than those from WT dams, and (D) placental weight normalized by fetal weight was increased in Th3/+ dams. (E) Fetal liver iron and (F) liver hepcidin mRNA expression were elevated in fetuses from WT2 and Th3/+ group dams. Moreover, FPN1 expression was quantified in the placentas. (G) FPN1 expression was normalized to expression of β-actin, which did not vary significantly among experimental groups. Results represent mean ± SD for n = 5 mice per group and were analyzed by one-way ANOVA followed by Tukey multiple comparisons test. Groups labeled with different letters are significantly different from one another (P < .05). Significant main effects: panels A-E,G, P < .001; panel F, P < .0001.
In summary, placentomegaly and fetal growth restriction were observed in fetuses of both genotypes in Th3/+ dams. Placental and fetal liver NHI content was the highest in Th3/+ fetuses, intermediate in their WT littermates, and lowest in WT fetuses from WT1 dams. Fetal liver Hamp expression reflected fetal iron loading, while placental FPN expression had an opposite pattern. These data suggest that, over time, maternal hyperferremia and high placental iron levels increase fetal liver iron content, inducing fetal liver hepcidin Hamp expression (increasing hepcidin production), with hepcidin then suppressing placental FPN expression to reduce iron flow to the already iron-loaded fetuses. Thus, fetal hepcidin is regulated by iron during embryonic development and it, in turn, regulates iron flux across the placenta.
Discussion
Rationale and significance
Translational relevance of this research derives from pregnancy becoming more frequent in thalassemic women. Here, we assessed how thalassemic pregnancy affected iron homeostasis using Th3/+ mice, a well-established, preclinical model of human βTI.6,36,42 To our knowledge, iron homeostasis has not been previously investigated during pregnancy in any mouse models of β-thalassemia. We hypothesized that dysregulation of iron homeostasis would be exacerbated by pregnancy in Th3/+ mice, thus increasing risk for adverse fetal outcomes. Experimental results supported this postulate, and also revealed unpredicted pathophysiological outcomes with possible implications for thalassemic pregnancy in humans.
Dysregulation of iron homeostasis in thalassemic mice during pregnancy
NP and pregnant Th3/+ mice were anemic (Figure 1A-B; Tables 2 and 3), with reticulocytosis (Figure 1C), anisocytosis, and microcytosis (Tables 2 and 3), and were significantly iron overloaded (Figure 1D-E; Figure 3). Serum EPO concentrations and bone marrow ERFE mRNA expression were elevated and serum hepcidin was repressed in pregnant Th3/+ mice, compared with NP controls (Figure 2). The EPO-ERFE-Hamp signaling pathway thus appears to be a strong regulator of iron homeostasis in Th3/+ dams. A pregnancy factor26 could also contribute to downregulation of Hamp expression in thalassemic dams. Decreased levels of circulating hepcidin led to an increase in iron absorption in pregnant Th3/+ mice, compared with NP Th3/+ controls, but the pregnancy-related increase was less significant than in WT mice (Figure 4A). These distinctions may be because hepatic and splenic NHI were much higher in Th3/+ dams, allowing more mobilization of storage iron than in WT dams. Th3/+ dams may thus rely less on dietary iron to meet the increased demand associated with pregnancy. Furthermore, altered iron distribution in Th3/+ mice can likely be explained by differential expression of NHI transporters. For example, downregulation of DMT1 and FPN protein expression in duodenal enterocytes (Figure 6A-C) most likely explains the lower iron absorption in Th3/+ dams (Figure 4A), whereas high FPN in the liver is consistent with enhanced mobilization of hepatic iron stores (Figure 6E-G). In the spleen, DMT1 was significantly upregulated (Figure 6J-K), likely reflecting enhanced iron uptake via the transferrin cycle to support proliferation and differentiation of splenic erythrocytes (see also Figures 3B and 4C). Furthermore, placental iron transfer to developing fetuses was blunted in late-term pregnancy in Th3/+ mice (Figure 5), although they were already iron-loaded by this point. This decrement in placental iron transfer late in pregnancy may be caused by activation of fetal liver Hamp in response to iron loading and subsequent downregulation of placental FPN expression by fetal hepcidin (as discussed below).
Placentomegaly and fetal growth restriction in thalassemic dams
Th3/+ dams had elevated serum iron and TSAT (Figure 1D-E). We postulated that this increase in serum iron is a pathological outcome, because maternal hyperferremia is the most likely cause of placental (Figure 7B) and fetal liver (Figure 7E) iron loading.26 Increased placental and fetal iron was not, however, accurately reflected by 59Fe flux studies late in gestation (Figure 5), suggesting that iron loading had occurred mainly earlier during pregnancy. Importantly, altered iron homeostasis was associated with placentomegaly (Figure 7A) and fetal growth retardation (Figure 7C). Placental enlargement occurs with maternal anemia,44 which is consistent with notable anemia in Th3/+ dams (Figure 1A). Intrauterine growth restriction (IUGR) has been reported in human females with βTI,45 even with regular blood transfusion.46 Voskaridou et al hypothesized that IUGR in thalassemia results from uretero-placental hypoxia.46 In Th3/+ mouse pregnancies, placental enlargement and fetal growth restriction could also relate to iron overload (ie, toxicity). Furthermore, fetal liver Hamp was activated by fetal iron loading (Figure 7C), which coincided with lower placental FPN1 protein levels (Figure 7D). Fetal hepcidin may thus downregulate placental iron flux to prevent even greater iron loading. Importantly, WT fetuses being carried by Th3/+ dams most accurately reflect the situation in human β-thalassemia, when mothers are thalassemic and fetuses are relatively normal (thalassemia trait). Iron loading of WT placentas and fetuses, and negative effects on fetal growth, thus have important implications for the human disorder, particularly because blood transfusion further elevates serum iron and could exacerbate fetal iron loading.
Unexpected hyperferremia in WT2 dams also causes fetal iron loading
The magnitude of intestinal iron absorption (Figure 4A) and total body iron stores (Figure 3D) were similar in WT1 and WT2 dams. Serum NHI and TSAT were decreased in WT1 dams (as compared with NP controls); however, strikingly, in WT2 dams (carrying Th3/+ fetuses), serum iron was elevated to levels that were similar to those in Th3/+ dams, reflecting the thalassemic phenotype (Figure 1D-F). Th3/+ fetuses thus altered maternal iron distribution. As in Th3/+ dams, maternal hyperferremia in WT2 dams likely accounts for the iron loading of WT fetuses, whereas in Th3/+ fetuses, ineffective erythropoiesis and accelerated RBC destruction and recycling in the fetus itself may also contribute to fetal liver iron loading. Regardless of the cause, fetal liver iron accumulation led to transactivation of fetal liver Hamp, likely increasing fetal hepcidin and thus limiting placental iron flux by repressing FPN1 expression. Furthermore, fetal liver iron accumulation was less pronounced in WT2 dams and developmental changes in the placentas and fetuses were not observed. These observations collectively suggest that the degree of maternal iron loading dictates the degree of fetal iron accumulation, and that fetal and maternal factors both contribute to disease etiology.
Limitations
HbbTh3/+ mice are frequently used to study the dysregulated iron homeostasis that typifies human βTI.7,9,18,36,37 The β-globin loci differ between mice and humans,47 leading to expression of distinct β-globin genes during fetal and postnatal development. Th3/+ mice are heterozygous for deletion of the 2 main murine β-globin genes, Hbb1 and Hbb2, which are expressed as an apparent single Hb throughout gestational development and after parturition. In contrast, humans express fetal hemoglobin (HbF) during gestational development and up to ∼6 months of age, before switching fully to adult hemoglobin (HbA). Homozygosity (or double heterozygosity) for HbA gene mutations underlies βTI in humans; therefore, the disease does not manifest until sometime after birth. One situation in the current investigation best reflects the human disorder, in which relatively normal (thalassemic trait) fetuses are carried by mothers who are thalassemic. Maternal hyperferremia in Th3/+ dams caused iron loading and IUGR of WT fetuses, which raises the question of whether the same phenomenon may occur in the human disorder.
Summary and conclusions
We predict the following sequence of pathophysiological events: maternal hyperferremia in Th3/+ dams results in fetal iron loading, which transactivates Hamp; fetal hepcidin targets placental FPN1, which represses placental iron flux and increases placental iron content, thus exacerbating maternal hyperferremia and accelerating fetal iron loading; and, placental and fetal iron loading increases risk for developmental abnormalities. In WT2 dams, Th3/+ fetuses initially load liver iron because of innate defects in RBC homeostasis, which transactivates Hamp, leading to repression of placental iron flux, maternal hyperferremia, and iron loading of WT fetal littermates. Placental and fetal iron loading in WT2 dams, however, is not significant enough to result in developmental abnormalities (as in Th3/+ dams). Iron loading of WT placentas and fetuses from WT dams is thus most likely driven by maternal hyperferremia.
In summary, the current investigation advances knowledge on pathophysiological and molecular aspects of pregnancy in murine βTI, thus generating novel, testable hypotheses relating to thalassemic pregnancy in humans. Increased understanding of (patho)physiological changes during pregnancy in thalassemia may ultimately lead to the development of new clinical approaches to better support reproduction by women with this wide-spread disorder of iron metabolism.
Acknowledgments
DMT1 antibody was kindly provided by François Canonne-Hergaux, IRSD, Université de Toulouse, INSERM, INRA, ENVT, UPS, Toulouse, France.
This work was supported by grants R01 DK074867 from the National Institute of Diabetes and Digestive and Kidney Diseases and R01 DK109717 from the National Institute of Diabetes and Digestive and Kidney Diseases and the Office of Dietary Supplements (J.F.C.).
Authorship
Contribution: Y.Y., L.M.G., M.D.G., and J.F.C. conceived of, and designed, this investigation; Y.Y., R.R.W., J.K.L., P.O.E., and S.Z. performed experiments, analyzed data, and produced the figures; Y.Y., E.N., L.M.G., M.D.G., and J.F.C. provided intellectual guidance, analyzed and interpreted data, drew conclusions, and drafted the manuscript; all authors participated in reviewing and revising the paper, and all authors approved the final, submitted version of this manuscript.
Conflict-of-interest disclosure: The authors declare no competing financial interests.
Correspondence: James F. Collins, Food Science & Human Nutrition Department, University of Florida, FSHN Bldg, #441; 572 Newell Dr, Gainesville, FL 32611; e-mail: jfcollins@ufl.edu.
References
Author notes
Data are available on request from the corresponding author, James F. Collins (jfcollins@ufl.edu).
The online version of this article contains a data supplement.
There is a Blood Commentary on this article in this issue.
The publication costs of this article were defrayed in part by page charge payment. Therefore, and solely to indicate this fact, this article is hereby marked “advertisement” in accordance with 18 USC section 1734.

This feature is available to Subscribers Only
Sign In or Create an Account Close Modal