Single-cell RNA sequencing and spatial transcriptomics reveal transcriptionally distinct hepatic macrophage populations in SCA mice.
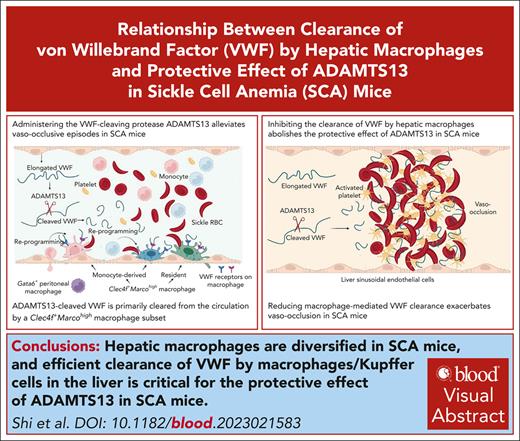
Efficient clearance of VWF by macrophages or Kupffer cells in the liver is critical for the protective effect of ADAMTS13 in SCA mice.
Visual Abstract
Although it is caused by a single-nucleotide mutation in the β-globin gene, sickle cell anemia (SCA) is a systemic disease with complex, incompletely elucidated pathologies. The mononuclear phagocyte system plays critical roles in SCA pathophysiology. However, how heterogeneous populations of hepatic macrophages contribute to SCA remains unclear. Using a combination of single-cell RNA sequencing and spatial transcriptomics via multiplexed error-robust fluorescence in situ hybridization, we identified distinct macrophage populations with diversified origins and biological functions in SCA mouse liver. We previously found that administering the von Willebrand factor (VWF)–cleaving protease ADAMTS13 alleviated vaso-occlusive episode in mice with SCA. Here, we discovered that the ADAMTS13-cleaved VWF was cleared from the circulation by a Clec4f+Marcohigh macrophage subset in a desialylation-dependent manner in the liver. In addition, sickle erythrocytes were phagocytized predominantly by Clec4f+Marcohigh macrophages. Depletion of macrophages not only abolished the protective effect of ADAMTS13 but exacerbated vaso-occlusive episode in mice with SCA. Furthermore, promoting macrophage-mediated VWF clearance reduced vaso-occlusion in SCA mice. Our study demonstrates that hepatic macrophages are important in the pathogenesis of SCA, and efficient clearance of VWF by hepatic macrophages is critical for the protective effect of ADAMTS13 in SCA mice.
Introduction
Sickle cell anemia (SCA) is one of the most common inherited hematological disorders worldwide.1 Despite its genetic simplicity, SCA is a systemic disease with complex, incompletely defined pathologies. The mononuclear phagocyte system plays critical roles in SCA pathophysiology.2-7 Heme, one of the hemolytic products in SCA, can impair macrophage efferocytosis and aggravate tissue damage in SCA.4 Heme oxygenase-1 (HO-1) is a key enzyme that catalyzes the breakdown of heme into biliverdin, carbon monoxide, and ferrous iron.8 A HO-1hi subset of monocytes protects the endothelium by patrolling and removing hemolysis-damaged endothelial cells, working with scavengers of hemolysis-derived products, such as hemopexin and haptoglobin to reduce the harmful effects of hemolysis.3,6 Recently, patrolling monocytes are shown to ameliorate vaso-occlusion by removal of endothelial-adherent sickle erythrocytes.5 On the other hand, pulmonary perivascular HO-1+, endothelin-1+, and interleukin-6–positive macrophages with iron contribute to pulmonary vascular remodeling in SCA.2
Liver macrophages are highly abundant and heterogeneous.9 Among them, Kupffer cells, the largest resident macrophage population in the body, originate from the erythromyeloid progenitors that migrate from the yolk sac to the fetal liver before birth (by embryo day 10.5 in mice).10 Kupffer cells replenish themselves by self-renewal, and they constantly scan and remove viruses, bacteria, toxins, aged proteins, and senescent blood cells from the liver sinusoidal blood flow.11,12 Monocyte-derived macrophages from the bone marrow and spleen can infiltrate into the liver13 and play multifaceted roles during liver homeostasis and disease.14 In SCA, mouse liver monocytes or macrophages upregulate type-1 interferon expression in response to hemolysis to trigger classical monocyte migration into the liver and differentiation into monocyte-derived macrophages.6,15 Some macrophages underwent heme-induced proinflammatory phenotypic switching in the liver and therapeutic administration of hemopexin in mice with SCA counteracted the heme-driven macrophage-mediated inflammation.16 Indeed, inflammasome activation in macrophages bridges inflammation with thrombosis,17 indicating the importance of macrophages in the thromboinflammatory SCA. On the other hand, some recruited monocytes are protective by clearing sickle hemoglobin and reducing sickle hemoglobin–induced senescence of liver sinusoidal endothelium, thus decreasing liver injury in mice with SCA.7 In addition, peritoneal macrophages, which uniquely infiltrate the injured liver via a nonvascular route, are another special type of recruited macrophages that have reparative functions during liver injury.18 These studies suggest the importance of hepatic macrophages in SCA pathogenesis, but a comprehensive molecular and functional analysis of the highly heterogeneous hepatic macrophages in SCA is lacking.
Increased plasma levels of von Willebrand factor (VWF), a multimeric glycoprotein secreted by endothelial cells and platelets that is critical for hemostasis,19,20 have been detected in patients with SCA.21-23 VWF activity is mainly regulated by ADAMTS13, a plasma enzyme that cleaves multimeric VWF at its A2 domain.24-26 Recently, we and others have shown that reduced cleavage of VWF by ADAMTS13 plays an essential role in SCA,27-29 albeit with unclear underlying mechanisms. SCA is characterized by system-wide thromboinflammation30-32, and VWF may serve as a bridging molecule linking the inflammation and thrombosis in SCA. One of the important regulators of VWF function and plasma level is its clearance in the liver.33,34 It remains unknown whether and how VWF clearance contributes to the pathogenesis of SCA.
In this study, we investigated the roles of hepatic macrophages in a humanized mouse model of SCA (S/S mice).35 Using a combination of single-cell RNA sequencing (scRNA-seq) and spatial transcriptomics, we characterized the transcriptomic profiles of highly heterogeneous hepatic macrophages of mice with SCA. Our data show that Clec4f+Marcohigh macrophages have important reparative functions by scavenging pathological plasma factors and erythrocytes. Additionally, ADAMTS13-mediated protection from vaso-occlusive episodes (VOEs) in S/S mice was dependent on efficient clearance of ADAMTS13-cleaved VWF by hepatic macrophages in a desialylation-dependent manner. Promoting macrophage scavenging function increased VWF clearance and reduced vaso-occlusion in SCA mice.
Materials and methods
Mice
Humanized Townes mice homozygous for human sickle hemoglobin βS/βS (S/S) and human wild-type hemoglobin βA/βA (A/A; control)35 were purchased from the Jackson Laboratory. Mice were housed and maintained in a specific pathogen-free facility at Oklahoma Medical Research Foundation. All experiments were performed in compliance with protocols approved by the institutional animal care and use committee of the Oklahoma Medical Research Foundation.
Mouse treatment
VOE was induced by either intraperitoneal injection of 500 ng tumor necrosis factor (TNF) or challenging with hypoxia for 8 hours (8% O2) followed by reoxygenation for 2 hours. Some S/S mice were IV injected with 3 μg recombinant human ADAMTS13 (R&D Systems) or vehicle 15 minutes before VOE induction.27 For competitive inhibition of VWF clearance, S/S mice were IV injected with asialofetuin or fetuin (Sigma Millipore; 0.2 mg/g body weight for bolus injection and 0.1 mg/g body weight for booster injection). For macrophage depletion, S/S mice were IV injected with clodronate or control liposomes at 100 μL/10 g body weight 2 days before VOE induction.36
scRNA-seq
The Chromium Next GEM 3′ Kit v3.1 was used to capture the single-cell, polyadenylated messenger RNA according to the 10x Genomics 3′ protocol. Sequencing libraries were prepared using the 10x Genomics Library Construction Kit with the Dual Index Kit TT Set A. After complementary DNA fragmentation, end repair, A-tailing, and adapter ligation, the libraries were loaded on a NovaSeq 6000 S4 flowcell with PE150 bp reads to target 500 million reads per sample. Cell Ranger was used for read alignment, feature-barcode matrix generation, and cell clustering.
MERFISH
Multiplexed error-robust fluorescence in situ hybridization (MERFISH) is a novel spatially resolved, single-cell, genome-scale transcriptome profiling technology that features in error-robust barcoding, combinatorial labeling, and sequential imaging.37 MERFISH was developed based on single-molecule fluorescence in situ hybridization, but it is highly multiplexed because of multiple rounds of hybridization, imaging, and quenching. The MERFISH experiments were performed with a MERSCOPE Platform purchased from Vizgen.38 The gene panels used were listed in supplemental Tables 1 and 2, available on the Blood website.
Statistical analysis
The scRNA-seq data were analyzed using R (version 4.2.1). MERFISH data were visualized using the MERSCOPE Vizualizer software. Experimental data were analyzed using GraphPad Prism 9. Parametric data were analyzed using 2-tailed, unpaired Student t test, Welch t test, or analysis of variance, as appropriate. Nonparametric data were analyzed using Mann-Whitney test and Wilcoxon signed-rank test. P < .05 was considered statistically significant.
See the supplemental Data for further material and methods details.
Results
Altered morphology, distribution, and number of hepatic macrophages in S/S mice
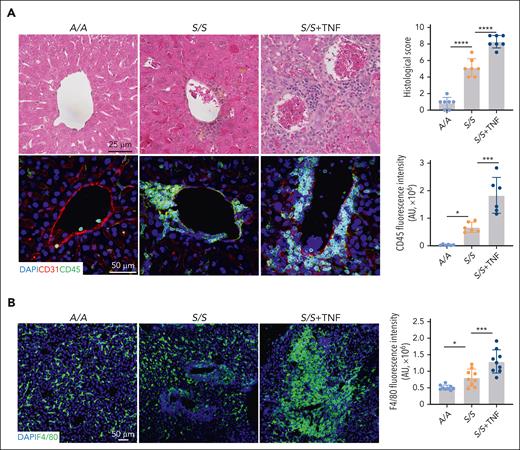
To characterize hepatic macrophages, we performed hematoxylin and eosin staining and found widespread sickle erythrocyte sequestration, inflammatory infiltrates, and ischemic and necrotic changes in the livers of 2-month-old S/S mice compared with 2-month-old A/A mice (Figure 1A). Prussian blue staining showed increased iron accumulation in the macrophages and hepatocytes of the S/S liver, whereas trichrome staining revealed increased fibrosis around the central vein and portal triad in the S/S liver (supplemental Figure 1A). To characterize pathological changes during VOEs, 2-month-old mice were injected with 500 ng TNF for VOE induction. Immunofluorescence staining showed significantly increased inflammatory infiltrates, erythrocyte occlusion, and platelet deposition in S/S mouse liver during VOEs (Figure 1A; supplemental Figure 1B). Macrophages represent an important component of inflammatory infiltrates and were significantly different between A/A and S/S mice (Figure 1B). Morphologically, macrophages of the S/S liver were obviously hypertrophied relative to those of A/A mice. The number of hepatic macrophages was higher in S/S mice than in A/A mice, which was further increased after TNF challenge. Additionally, many macrophages in S/S mice were accumulated around vessels, suggesting their extrahepatic origins. These results demonstrate the distinct morphology, distribution, and number of hepatic macrophages in S/S mice.
Increased inflammatory infiltrates and altered macrophages in the liver of S/S mice. (A) Representative images of hematoxylin and eosin staining and immunofluorescence staining of liver sections from A/A mice, S/S mice, and S/S mice during VOEs. There were increased vaso-occlusion, inflammatory infiltrates, and hepatocyte death in the liver of S/S mice, which were further aggravated during TNF-induced VOE. Histological scores and inflammatory infiltrate quantification are shown on the right. Cryosections were stained with primary antibodies to CD31 (endothelial cell marker) and CD45 (leukocyte common antigen). 4′,6-diamidino-2-phenylindole (DAPI) cell nuclear staining (n = 4 mice per group). Data represent mean ± standard deviation. ∗P < .05; ∗∗∗P < .001; ∗∗∗∗P < .0001, 1-way analysis of variance (ANOVA). (B) Representative confocal microscopic images of liver cryosections of A/A mice, S/S mice, and S/S mice during VOEs. There were increased macrophages in the S/S mouse liver, which were hypertrophied when compared with those in the liver of A/A mice. During VOE, there was an increase of macrophage accumulation around the vessels in the liver of S/S mice, indicating increased infiltration of circulating monocyte-derived macrophages. Macrophage quantification is shown on the right. Cryosections were stained with primary antibody to F4/80 (macrophage marker). DAPI cell nuclear staining (n = 4 mice per group). Data represent mean ± standard deviation. ∗P < .05; ∗∗∗P < .001, 1-way ANOVA. AU, arbitrary unit.
Increased inflammatory infiltrates and altered macrophages in the liver of S/S mice. (A) Representative images of hematoxylin and eosin staining and immunofluorescence staining of liver sections from A/A mice, S/S mice, and S/S mice during VOEs. There were increased vaso-occlusion, inflammatory infiltrates, and hepatocyte death in the liver of S/S mice, which were further aggravated during TNF-induced VOE. Histological scores and inflammatory infiltrate quantification are shown on the right. Cryosections were stained with primary antibodies to CD31 (endothelial cell marker) and CD45 (leukocyte common antigen). 4′,6-diamidino-2-phenylindole (DAPI) cell nuclear staining (n = 4 mice per group). Data represent mean ± standard deviation. ∗P < .05; ∗∗∗P < .001; ∗∗∗∗P < .0001, 1-way analysis of variance (ANOVA). (B) Representative confocal microscopic images of liver cryosections of A/A mice, S/S mice, and S/S mice during VOEs. There were increased macrophages in the S/S mouse liver, which were hypertrophied when compared with those in the liver of A/A mice. During VOE, there was an increase of macrophage accumulation around the vessels in the liver of S/S mice, indicating increased infiltration of circulating monocyte-derived macrophages. Macrophage quantification is shown on the right. Cryosections were stained with primary antibody to F4/80 (macrophage marker). DAPI cell nuclear staining (n = 4 mice per group). Data represent mean ± standard deviation. ∗P < .05; ∗∗∗P < .001, 1-way ANOVA. AU, arbitrary unit.
scRNA-seq reveals transcriptionally distinct monocyte or macrophage populations in the S/S liver
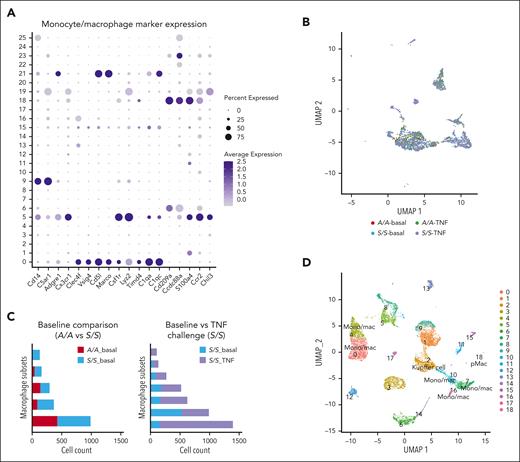
To gain insights into the transcriptomics of hepatic macrophages, we performed scRNA-seq of liver cells isolated from 4 groups of 2-month-old mice that included A/A and S/S mice at baseline (n = 2 mice per genotype) and A/A and S/S mice after TNF challenge (n = 2 mice per genotype; supplemental Figure 2A). Because parenchymal cells represent most of the liver cells, we performed low-speed centrifugation to enrich nonparenchymal cells and used a cell sorter to enrich macrophages. Analysis of the scRNA-seq data of all 4 groups of mice revealed a total of 26 cell clusters (supplemental Figure 2B), with multiple clusters exhibiting gene expression signatures of monocytes or macrophages (Figure 2A). Cell compositions of these monocyte or macrophage populations were shown in Figure 2B. Because the algorithm used for data set merging in Seurat27 limited the comparison of monocyte or macrophage numbers among 4 groups, 2-group analyses were performed and showed increased variety and number of monocytes or macrophages in baseline S/S liver when compared with baseline A/A liver (Figure 2C; supplemental Figure 3), indicating the increased infiltration and/or proliferation of these cells. Challenging S/S mice with TNF further increased the heterogeneity of hepatic monocytes or macrophages and their numbers (Figure 2C; supplemental Figure 4), which is consistent with the immunofluorescence staining data (Figure 1B).
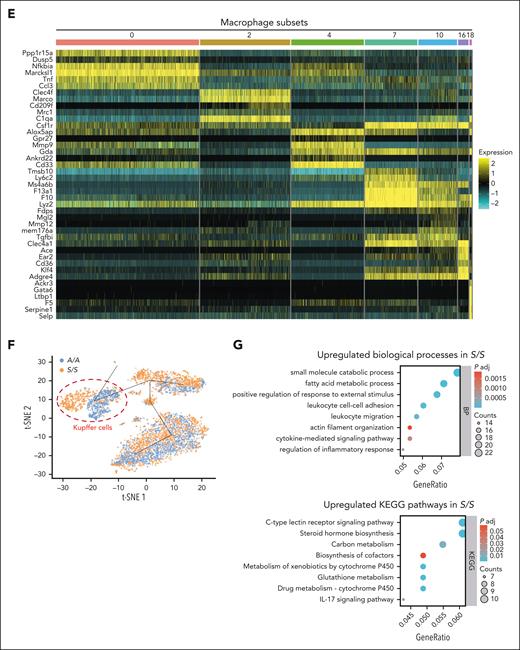
scRNA-seq reveals transcriptionally distinct monocyte or macrophage populations in the liver of A/A and S/S mice. (A) Dot plot showing the expression of monocyte or macrophage makers in different cell clusters identified using liver single cells from 4 groups of mice (2-month-old): A/A and S/S mice at baseline (n = 2 mice per genotype), and A/A and S/S mice after TNF challenge (n = 2 mice per genotype). (B) Uniform Manifold Approximation and Projection (UMAP) showing the monocyte and macrophage populations from panel A. (C) Comparison of the monocyte or macrophage numbers between baseline A/A and S/S mice (top), and between baseline S/S and TNF-challenged S/S mice (bottom). (D) UMAP showing a total of 19 cell clusters (0-18) derived from the livers of TNF-challenged 2-month-old A/A (n = 2) and S/S mice (n = 2). (E) Heat map showing the differentially expressed genes across subsets of macrophages in the liver. Seven groups of transcriptionally distinct macrophages were identified in the liver of TNF-challenged A/A and S/S mice. The color key to the right of the heat map indicates the gene expression levels (high-to-low expression corresponding to yellow to cyan). (F) Trajectory analysis of the different macrophage subsets. The differences in cell distribution between TNF-challenged A/A (blue) and S/S (orange) mice are shown in the t-distributed stochastic neighbor embedding (t-SNE) map, and the cell cluster exhibiting the most different transcriptomic profile is circled in red, which corresponds to Kupffer cells (cluster 2). (G) Bubble plots showing functional annotations of the upregulated biological processes (top) and KEGG pathways (bottom) in Kupffer cells from the livers of TNF-challenged S/S mice when compared with those from the livers of TNF-challenged A/A mice. In the bubble plots, the bubble size represents the number of enriched genes whereas the bubble color represents the P-value. Mono/mac, monocytes/macrophages; pMac, peritoneal macrophages.
scRNA-seq reveals transcriptionally distinct monocyte or macrophage populations in the liver of A/A and S/S mice. (A) Dot plot showing the expression of monocyte or macrophage makers in different cell clusters identified using liver single cells from 4 groups of mice (2-month-old): A/A and S/S mice at baseline (n = 2 mice per genotype), and A/A and S/S mice after TNF challenge (n = 2 mice per genotype). (B) Uniform Manifold Approximation and Projection (UMAP) showing the monocyte and macrophage populations from panel A. (C) Comparison of the monocyte or macrophage numbers between baseline A/A and S/S mice (top), and between baseline S/S and TNF-challenged S/S mice (bottom). (D) UMAP showing a total of 19 cell clusters (0-18) derived from the livers of TNF-challenged 2-month-old A/A (n = 2) and S/S mice (n = 2). (E) Heat map showing the differentially expressed genes across subsets of macrophages in the liver. Seven groups of transcriptionally distinct macrophages were identified in the liver of TNF-challenged A/A and S/S mice. The color key to the right of the heat map indicates the gene expression levels (high-to-low expression corresponding to yellow to cyan). (F) Trajectory analysis of the different macrophage subsets. The differences in cell distribution between TNF-challenged A/A (blue) and S/S (orange) mice are shown in the t-distributed stochastic neighbor embedding (t-SNE) map, and the cell cluster exhibiting the most different transcriptomic profile is circled in red, which corresponds to Kupffer cells (cluster 2). (G) Bubble plots showing functional annotations of the upregulated biological processes (top) and KEGG pathways (bottom) in Kupffer cells from the livers of TNF-challenged S/S mice when compared with those from the livers of TNF-challenged A/A mice. In the bubble plots, the bubble size represents the number of enriched genes whereas the bubble color represents the P-value. Mono/mac, monocytes/macrophages; pMac, peritoneal macrophages.
Further comparison of the hepatic monocytes or macrophages between TNF-challenged A/A and S/S mice identified 19 cell clusters (Figure 2D; supplemental Figure 5A). Differentially expressed genes across these clusters are shown in a heat map (supplemental Figure 5B), and transcriptionally distinct monocytes or macrophages were identified in the liver (Table 1; Figure 2E; supplemental Figure 5C). Among them, cluster 2 specifically expresses a high level of Clec4f, a definitive mouse Kupffer cell marker, indicating its Kupffer cell identity (Figure 2E; supplemental Figure 5D). To characterize these different monocyte or macrophage subsets, trajectory analysis was performed. Kupffer cells (cluster 2) were positioned quite differently between A/A and S/S mice, with minimal overlapping between each other along the trajectory, indicating their distinct transcriptomic signatures (Figure 2F; supplemental Figure 5E).
scRNA-seq reveals transcriptionally distinct monocyte or macrophage populations in the liver of TNF-challenged 2-month-old A/A and S/S mice
| Cluster . | Markers . |
|---|---|
| 0 | Marcksl1+, TNFhigh, Ccl3high, and Il1bhigh |
| 2 | Kupffer cell: Clec4f+ and Marcohigh |
| 4 | Mmp9+, Gda+, Ankrd22+, and Gpr27+ |
| 7 | Ly6c2high, F10+, F13a1+, Lyz2high, and Clec4a1high |
| 10 | Tmem176a/bhigh, Tgfbi+, and Mmp12+ |
| 16 | CD36high, Ear2high, Adgre4high, and Clec4a1high |
| 18 | Peritoneal macrophage: Marcohigh, Gata6+, Selp+, F5+, and Ltbp1+ |
Further comparisons revealed significantly up or downregulated genes in Kupffer cells from S/S mice when compared with those from A/A mice (supplemental Figure 6A). Functional annotation and Kyoto Encyclopedia of Genes and Genomes (KEGG) pathway analyses showed that the most upregulated biological processes in Kupffer cells from S/S liver included leukocyte cell-cell adhesion, leukocyte migration, and cytokine-mediated signaling pathway, whereas the significantly upregulated KEGG pathways included C-type lectin receptor signaling pathway, glutathione metabolism, and interleukin-17 signaling pathway (Figure 2G). Downregulated biological processes and KEGG pathways were also revealed (supplemental Figure 6B). Collectively, our study characterized transcriptionally distinct monocyte or macrophage populations, especially Kupffer cells, in the S/S liver.
Spatial transcriptomic profiling of distinct monocyte or macrophage populations in the S/S liver
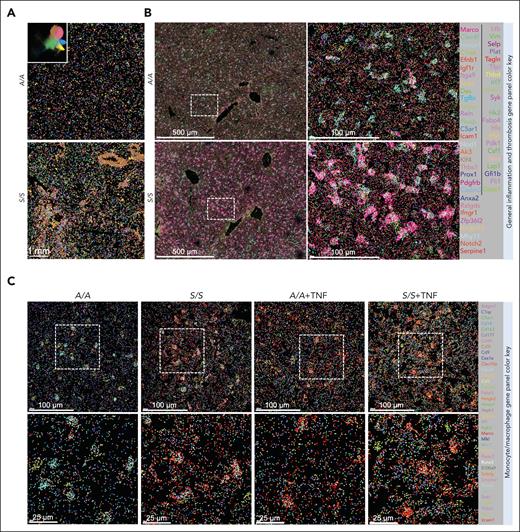
Compared with scRNA-seq, MERFISH can preserve cell spatial context and provide nanometer-scale resolution of RNA distribution, which is important to understand the intercellular communications. Additionally, MERFISH can minimize gene expression alternation during sample collection, such as artificial activation of immediate early response genes. Therefore, we used MERFISH to map distinct monocyte or macrophage populations in the liver to complement the scRNA-seq data. First, MERFISH experiment was performed (supplemental Figure 2A) on liver samples from a pair of 1.5-month-old A/A and S/S mice at baseline using a 300-general inflammation and thrombosis gene panel (supplemental Table 1). The analysis identified a total of 940 607 cells, which were clustered into 24 distinct cellular subsets (supplemental Figure 7A). There was a completely different spatial transcriptomic profile in the liver of S/S mice compared with A/A liver (Figure 3A-B). Analysis of the MERFISH data uncovered 5 populations of macrophages, which displayed different spatial distributions and quantities in the liver (Figure 3A) as well as differentially expressed gene profiles (supplemental Figure 7B). The overall macrophage number was increased and many macrophages accumulated around the vessel wall in the S/S liver, suggesting them to be monocyte-derived macrophages (Figure 3A), which is consistent with the immunofluorescence staining data (Figure 1B). These data demonstrate completely different macrophage localization and composition as well as variations in gene expressions in the S/S liver relative to A/A liver.
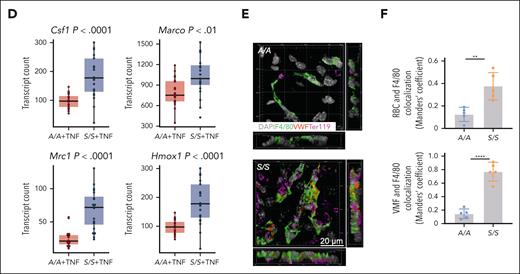
Macrophage transcriptomic profiling shows enhanced macrophage scavenging activity in the liver of S/S mice. (A) Five macrophage subsets identified by MERFISH of liver tissues from 1.5-month-old A/A and S/S mice at baseline, visualized in UMAP (white-line boxed inset) and liver tissues in situ. Each color represents 1 macrophage subtype. Each dot represents 1 cell. These images show significantly increased monocytes or macrophages in the liver of S/S mouse, with remarkable accumulation around the vessels. (B) Comparisons of hepatic spatial transcriptomic profiles between 1.5-month-old A/A and S/S mice using the 300-general inflammation and thrombosis MERFISH gene panel. Each color and its corresponding RNA species are shown in the gene color key box on the right. Each dot represents 1 RNA molecule. (C) Comparisons of hepatic macrophage transcriptomic profiles between 4 groups of mice, 2-month-old A/A and S/S mice at baseline and 2-month-old A/A and S/S mice after TNF challenge using the 140-monocyte or macrophage MERFISH gene panel. Each color and its corresponding RNA species are shown on the right in the gene color key box. Each dot represents 1 RNA molecule. (D) Quantifications of transcript numbers per cell for Csf1, Marco, Mrc1, and Hmox1 genes between the livers of A/A and S/S mice in (C). Welch 2-sample t test. (E) Three-dimensional (3D) rendering of confocal images showing the clearance of VWF and erythrocytes by macrophages in the liver of A/A and S/S mice. Side views are shown on the right and bottom. DAPI cell nuclear staining (n = 3 mice per group). (F) Quantification of the colocalization of F4/80+ macrophages with VWF (bottom) and erythrocytes (top). These images demonstrate the increased clearance of VWF and erythrocytes by macrophages in the liver of S/S mice. Data represent mean ± standard deviation. ∗∗P < .01; ∗∗∗∗P < .0001, 2-tailed, unpaired Student t test. F4/80, macrophage marker; RBC, red blood cell; Ter119, erythrocyte marker.
Macrophage transcriptomic profiling shows enhanced macrophage scavenging activity in the liver of S/S mice. (A) Five macrophage subsets identified by MERFISH of liver tissues from 1.5-month-old A/A and S/S mice at baseline, visualized in UMAP (white-line boxed inset) and liver tissues in situ. Each color represents 1 macrophage subtype. Each dot represents 1 cell. These images show significantly increased monocytes or macrophages in the liver of S/S mouse, with remarkable accumulation around the vessels. (B) Comparisons of hepatic spatial transcriptomic profiles between 1.5-month-old A/A and S/S mice using the 300-general inflammation and thrombosis MERFISH gene panel. Each color and its corresponding RNA species are shown in the gene color key box on the right. Each dot represents 1 RNA molecule. (C) Comparisons of hepatic macrophage transcriptomic profiles between 4 groups of mice, 2-month-old A/A and S/S mice at baseline and 2-month-old A/A and S/S mice after TNF challenge using the 140-monocyte or macrophage MERFISH gene panel. Each color and its corresponding RNA species are shown on the right in the gene color key box. Each dot represents 1 RNA molecule. (D) Quantifications of transcript numbers per cell for Csf1, Marco, Mrc1, and Hmox1 genes between the livers of A/A and S/S mice in (C). Welch 2-sample t test. (E) Three-dimensional (3D) rendering of confocal images showing the clearance of VWF and erythrocytes by macrophages in the liver of A/A and S/S mice. Side views are shown on the right and bottom. DAPI cell nuclear staining (n = 3 mice per group). (F) Quantification of the colocalization of F4/80+ macrophages with VWF (bottom) and erythrocytes (top). These images demonstrate the increased clearance of VWF and erythrocytes by macrophages in the liver of S/S mice. Data represent mean ± standard deviation. ∗∗P < .01; ∗∗∗∗P < .0001, 2-tailed, unpaired Student t test. F4/80, macrophage marker; RBC, red blood cell; Ter119, erythrocyte marker.
Macrophage transcriptomic profiling shows enhanced macrophage phagocytic activity in the S/S liver
VWF clearance is one of the important regulatory mechanisms to maintain a VWF–ADAMTS13 balance, and resident macrophages represent one of the major cell types to recognize and clear VWF.39-43 Our MERFISH results (300-gene panel) showed increased expression of genes contributing to the scavenging function of macrophages (Figure 3B), and genes related to VWF clearance (supplemental Figure 7C). Consistently, immunofluorescence staining of liver tissues showed increased clearance of VWF in hepatic macrophages of S/S mice when compared with A/A mice (supplemental Figure 8A).
To further characterize hepatic monocytes or macrophages in SCA, we designed a targeted monocyte or macrophage 140-gene panel (supplemental Table 2) based on (1) differentially expressed genes revealed by our scRNA-seq data, (2) common monocyte and macrophage markers, (3) established gene signatures for anti or proinflammatory macrophages, (4) genes related to macrophage scavenging functions, and (5) genes associated with macrophage proliferation, migration, and metabolism. MERFISH experiments including 4 groups of mice with same age and treatment as the scRNA-seq study, that is, 2-month-old A/A and S/S mice at baseline and 2-month-old A/A and S/S mice after TNF challenge, were analyzed using the 140-monocyte or macrophage gene panel (supplemental Figure 2A). The results showed that both baseline and TNF-challenged S/S mice had completely different transcriptomic profiles when compared with baseline and TNF-challenged A/A mice, respectively (Figure 3C). Some differentially expressed genes, including those related to macrophage scavenging functions and VWF clearance, are presented in Figure 3C. Transcript quantification showed some significantly upregulated genes in the S/S liver when compared with the A/A liver (Figure 3D), including Csf1, a stimulator of monocyte proliferation and differentiation. CSF1 binding to its receptor on macrophages regulates the acquisition of phagocytic functions in macrophages44 and the transcription of genes involved in phagosome formation. Marco45 and Mrc1,46 which regulate macrophage phagocytosis activity, were also upregulated in the S/S liver (Figure 3D). Consistently, 3-dimensional rendering of the confocal images exhibited increased clearance of VWF and erythrocytes in the liver of S/S mice when compared with A/A mice (Figure 3E-F).
There were high correlations in transcript copy numbers per cell between (1) 300- and 140-gene panels (supplemental Figure 8B) and (2) 1.5- and 2-month-old mouse samples analyzed by the 140-gene panel (supplemental Figure 8C), indicating the high reliability of MERFISH results in this study. supplemental Figure 8D-E, specifically, shows consistent changes in the expression of genes related to macrophage scavenging function, including Csf1, Marco, Mrc1, and Hmox1, in 1.5-month-old mice. Overall, the macrophage transcriptomic changes in the S/S liver reflect their enhanced scavenging functions, which may be a compensatory mechanism to reduce tissue damage in SCA.
Clec4f+Marcohigh Kupffer cells are major restorative macrophages to clear sickle erythrocytes
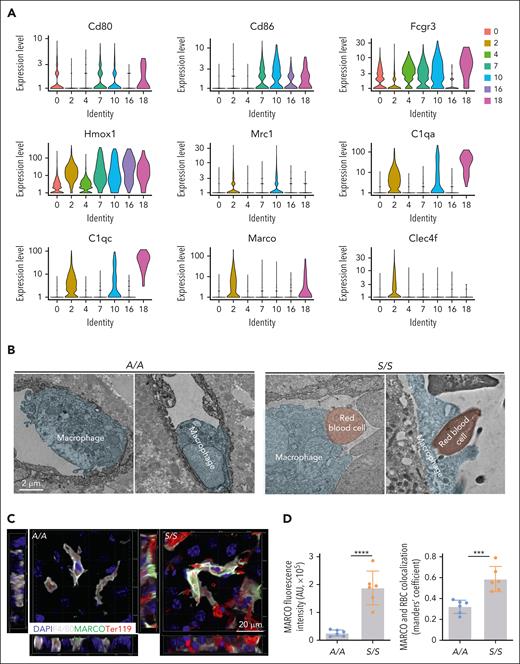
To determine specific functions of different macrophages, we further compared the transcriptomic profiles of macrophages from A/A and S/S mice. Our scRNA-seq results showed that some proinflammatory markers, such as Cd80, Cd86, and Fcgr3 were higher in macrophage clusters 7 and 10, whereas some anti-inflammatory markers, including Mrc1 and Marco, were higher in Kupffer cells (cluster 2; Figure 4A), which were consistent with MERFISH findings (Figure 3B-D; supplemental Figure 8D-E). Immunostaining results confirmed much higher level of the scavenger receptor macrophage receptor with collagenous structure (MARCO) in hepatic macrophages from the liver of S/S mice than those from the liver of A/A mice (supplemental Figure 9). Furthermore, transmission electron microscopy of the liver revealed that macrophages in the liver of S/S liver mice were engaged in active erythrophagocytosis (Figure 4B), which might partially explain their hypertrophy. Costaining the liver sections for F4/80, MARCO, and erythrocytes showed remarkable erythrocyte phagocytosis by Marcohigh macrophages in the liver of S/S mice (Figure 4C-D). Taken together, these results show that Clec4f+Marcohigh Kupffer cells are distinct reparative macrophages in the liver of S/S mice.
Clec4f+Marcohigh macrophages are important for erythrocyte clearance. (A) Comparisons of the expression levels of proinflammatory and anti-inflammatory markers in 7 distinct macrophage subsets identified by scRNA-seq of liver cells from TNF-challenged 2-month-old A/A (n = 2) and S/S mice (n = 2). Among them, the Clec4f+ Kupffer cells expressed higher levels of Mrc1 and Marco than of other groups, identifying them as restorative macrophages. (B) Representative transmission electron microscopic images showing increased erythrophagocytosis in hepatic macrophages of S/S mice than those in A/A mice. There were dramatically increased interactions between erythrocytes (red) and macrophages (blue) and phagocytosis of erythrocytes by macrophages in the liver of S/S mice. (C) 3D rendering of confocal images showing the clearance of erythrocytes by macrophages in the liver of A/A and S/S mice. Side views are shown on the left and bottom. The sections were stained with primary antibodies to MARCO (a scavenger receptor), macrophages (F4/80), and erythrocytes (Ter119). There was a dramatic increase of Marcohigh macrophages in the liver of S/S mice and these Marcohigh macrophages showed increased clearance of erythrocytes in the liver of S/S mice. DAPI cell nuclear staining (n = 3 mice per group). (D) Quantification of MARCO fluorescence intensity (left) and the colocalization of MARCO+ macrophages with erythrocytes (right). Data represent mean ± standard deviation. ∗∗∗P < .001; ∗∗∗∗P < .0001, 2-tailed, unpaired Student t test.
Clec4f+Marcohigh macrophages are important for erythrocyte clearance. (A) Comparisons of the expression levels of proinflammatory and anti-inflammatory markers in 7 distinct macrophage subsets identified by scRNA-seq of liver cells from TNF-challenged 2-month-old A/A (n = 2) and S/S mice (n = 2). Among them, the Clec4f+ Kupffer cells expressed higher levels of Mrc1 and Marco than of other groups, identifying them as restorative macrophages. (B) Representative transmission electron microscopic images showing increased erythrophagocytosis in hepatic macrophages of S/S mice than those in A/A mice. There were dramatically increased interactions between erythrocytes (red) and macrophages (blue) and phagocytosis of erythrocytes by macrophages in the liver of S/S mice. (C) 3D rendering of confocal images showing the clearance of erythrocytes by macrophages in the liver of A/A and S/S mice. Side views are shown on the left and bottom. The sections were stained with primary antibodies to MARCO (a scavenger receptor), macrophages (F4/80), and erythrocytes (Ter119). There was a dramatic increase of Marcohigh macrophages in the liver of S/S mice and these Marcohigh macrophages showed increased clearance of erythrocytes in the liver of S/S mice. DAPI cell nuclear staining (n = 3 mice per group). (D) Quantification of MARCO fluorescence intensity (left) and the colocalization of MARCO+ macrophages with erythrocytes (right). Data represent mean ± standard deviation. ∗∗∗P < .001; ∗∗∗∗P < .0001, 2-tailed, unpaired Student t test.
Clec4f+ macrophage-mediated clearance of VWF is critical for the protective effect of ADAMTS13 in VOEs
Our previous study shows that administering the recombinant human ADAMTS13 reduced plasma VWF levels, decreased vaso-occlusion, and alleviated organ damage during VOE in S/S mice.27 Interestingly, further analysis revealed no significant difference in plasma VWF multimeric composition between ADAMTS13- or vehicle-treated S/S mice (supplemental Figure 10A), suggesting efficient clearance of the ADAMTS13-cleaved VWF from the circulation in S/S mice. This is supported by immunostaining data that showed a dramatic increase in VWF colocalization with macrophages in the liver but not in the spleen, lung, or brain of ADAMTS13-treated mice when compared with vehicle-treated mice (supplemental Figure 10B).
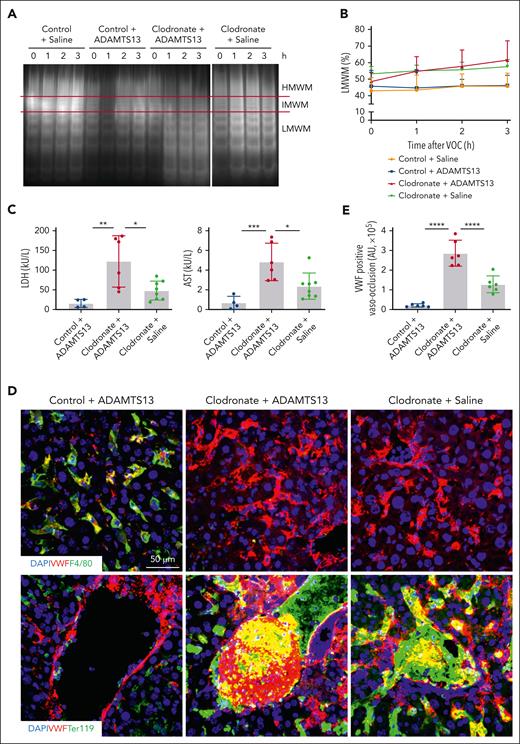
To determine the role of macrophage-mediated VWF clearance in VOEs, we depleted macrophages by IV injection of clodronate liposomes 2 days before VOE induction in S/S mice (supplemental Figure 11A-B). Multimeric VWF analysis showed that the proportion of low molecular weight VWF multimers was increased in macrophage-depleted mice (Figure 5A-B). Measurements of lactate dehydrogenase and aspartate aminotransferase documented that under the condition of macrophage depletion, administering ADAMTS13 exacerbated VOE in S/S mice, which is in sharp contrast to its protective role in the control liposome-treated S/S mice (Figure 5C). This finding indicates that the smaller VWF molecules are pathogenic during VOE before its clearance from the circulation. Consistently, immunofluorescence staining demonstrated that macrophage depletion not only abolished the ADAMTS13-mediated reduction of VWF-rich vaso-occlusions in VOEs but also increased tissue damage (Figure 5D-E; supplemental Figure 11C-D).
Macrophages are required for the protective effect of ADAMTS13. (A) Plasma VWF multimeric compositions from 4 groups of S/S mice at basal level and at different time points after VOE induction (1, 2, and 3 hours). Control + saline, S/S mice treated with saline and control liposomes; control + ADAMTS13, S/S mice treated with ADAMTS13 and control liposomes; clodronate + ADAMTS13, S/S mice treated with ADAMTS13 after clodronate-mediated macrophage depletion; and clodronate + saline, S/S mice treated with saline after clodronate-mediated macrophage depletion. Data represent at least 4 independent experiments. HMWM, IMWM, or LMWM represents high, intermediate, or low molecular weight VWF multimers, respectively (denoted by red lines). (B) The percentage of LMWM among total VWF at each time point was quantified based on densitometry. Data represent at least 4 independent experiments. (C) Plasma levels of lactate dehydrogenase (LDH) and aspartate transaminase (AST) at 3 hours after VOE induction in different groups of S/S mice treated as described in panel A. Each dot represents 1 mouse. Data represent mean ± standard deviation. ∗P < .05; ∗∗P < .01; ∗∗∗P < .001, 1-way ANOVA. (D) Representative confocal microscopic images of liver cryosections from different groups of S/S mice. These sections were stained with primary antibodies to VWF, macrophages (F4/80), and erythrocytes (Ter119). DAPI cell nuclear staining. The top panel shows efficient depletion of F4/80-positive macrophages in clodronate-treated mice. Bottom panel highlights that ADAMTS13 reduced VWF-positive vaso-occlusion and colocalization (yellow) of VWF with sickle erythrocytes (Ter119), which was abolished by clodronate-mediated depletion of macrophages. Data represent at least 4 independent experiments. (E) Quantification of VWF-positive vaso-occlusions in (D). Data represent at least 4 independent experiments. Data represent mean ± standard deviation. ∗∗∗∗P < .0001, 1-way ANOVA.
Macrophages are required for the protective effect of ADAMTS13. (A) Plasma VWF multimeric compositions from 4 groups of S/S mice at basal level and at different time points after VOE induction (1, 2, and 3 hours). Control + saline, S/S mice treated with saline and control liposomes; control + ADAMTS13, S/S mice treated with ADAMTS13 and control liposomes; clodronate + ADAMTS13, S/S mice treated with ADAMTS13 after clodronate-mediated macrophage depletion; and clodronate + saline, S/S mice treated with saline after clodronate-mediated macrophage depletion. Data represent at least 4 independent experiments. HMWM, IMWM, or LMWM represents high, intermediate, or low molecular weight VWF multimers, respectively (denoted by red lines). (B) The percentage of LMWM among total VWF at each time point was quantified based on densitometry. Data represent at least 4 independent experiments. (C) Plasma levels of lactate dehydrogenase (LDH) and aspartate transaminase (AST) at 3 hours after VOE induction in different groups of S/S mice treated as described in panel A. Each dot represents 1 mouse. Data represent mean ± standard deviation. ∗P < .05; ∗∗P < .01; ∗∗∗P < .001, 1-way ANOVA. (D) Representative confocal microscopic images of liver cryosections from different groups of S/S mice. These sections were stained with primary antibodies to VWF, macrophages (F4/80), and erythrocytes (Ter119). DAPI cell nuclear staining. The top panel shows efficient depletion of F4/80-positive macrophages in clodronate-treated mice. Bottom panel highlights that ADAMTS13 reduced VWF-positive vaso-occlusion and colocalization (yellow) of VWF with sickle erythrocytes (Ter119), which was abolished by clodronate-mediated depletion of macrophages. Data represent at least 4 independent experiments. (E) Quantification of VWF-positive vaso-occlusions in (D). Data represent at least 4 independent experiments. Data represent mean ± standard deviation. ∗∗∗∗P < .0001, 1-way ANOVA.
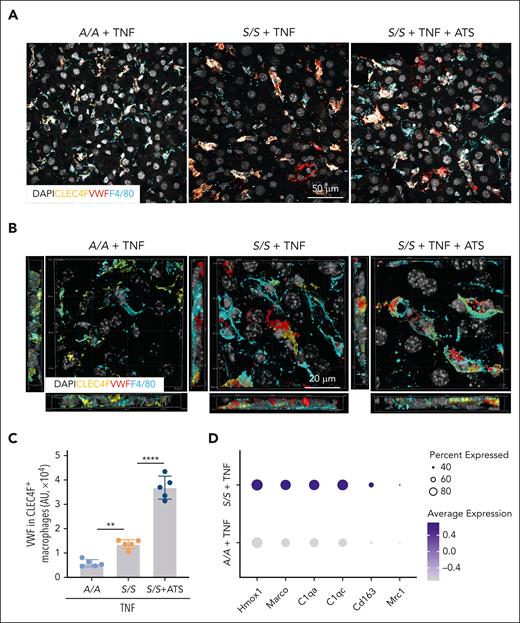
According to our scRNA-seq analysis, the Clec4f+Marcohigh macrophages are restorative in SCA (Figure 4A). Immunofluorescence staining showed that ADAMTS13 treatment increased the colocalization of VWF with macrophages, especially with Clec4f+ Kupffer cells when compared with F4/80+Clec4flow macrophages (Figure 6A-C). Comparison of the scRNA-seq data of Clec4f+ Kupffer cells from TNF-challenged A/A and S/S mice showed upregulated scavenging and anti-inflammatory gene expression in Clec4f+ Kupffer cells of the S/S mice (Figure 6D). These data strongly suggest that the protective effect of ADAMTS13 in VOEs is associated with efficient clearance of VWF by Clec4f+Marcohigh macrophages, and shorter forms of VWF molecules are pathogenic during VOEs if not efficiently cleared from the circulation.
Clec4f+ Kupffer cells are an important restorative macrophage subset with increased VWF clearance activity. (A) Representative confocal microscopic images and (B) 3D rendering of confocal images of liver cryosections from TNF-challenged A/A mice, S/S mice, and S/S mice with ADAMTS13 (ATS) treatment. The sections were stained with primary antibodies to VWF, CLEC4F (Kupffer cell marker), and F4/80 (macrophage marker) (n = 5 mice per group). DAPI cell nuclear staining. (C) Quantification of the amount of VWF in CLEC4F+ macrophages of the 3D rendering confocal images in (B) (ie, cells stained positive for both VWF and CLEC4F). There was increased clearance of VWF in CLEC4F+ macrophages in the S/S mouse liver, which further increased after ATS treatment. Data represent mean ± standard deviation. ∗∗P < .01; ∗∗∗∗P < .0001, 1-way ANOVA. (D) Representative differentially expressed genes related to scavenging and anti-inflammatory functions between Kupffer cells from A/A and S/S mice challenged with TNF. For scRNA-seq, n = 2 mice per group.
Clec4f+ Kupffer cells are an important restorative macrophage subset with increased VWF clearance activity. (A) Representative confocal microscopic images and (B) 3D rendering of confocal images of liver cryosections from TNF-challenged A/A mice, S/S mice, and S/S mice with ADAMTS13 (ATS) treatment. The sections were stained with primary antibodies to VWF, CLEC4F (Kupffer cell marker), and F4/80 (macrophage marker) (n = 5 mice per group). DAPI cell nuclear staining. (C) Quantification of the amount of VWF in CLEC4F+ macrophages of the 3D rendering confocal images in (B) (ie, cells stained positive for both VWF and CLEC4F). There was increased clearance of VWF in CLEC4F+ macrophages in the S/S mouse liver, which further increased after ATS treatment. Data represent mean ± standard deviation. ∗∗P < .01; ∗∗∗∗P < .0001, 1-way ANOVA. (D) Representative differentially expressed genes related to scavenging and anti-inflammatory functions between Kupffer cells from A/A and S/S mice challenged with TNF. For scRNA-seq, n = 2 mice per group.
Shorter forms of VWF are adhesive to erythrocytes and cleared in a desialylation-dependent manner in the liver of S/S mice
Sialylation has been shown to regulate VWF clearance,47,48 but whether desialylation-dependent VWF clearance is important for VOE pathogenesis is unknown. To address this question, we administered asialofetuin, which functions as a competitor for binding the Gal/GalNAc receptors, to block the potential desialylated glycan and receptor interactions. Administering asialofetuin reduced the colocalization of VWF with macrophages in mouse liver after ADAMTS13 treatment (Figure 7A-B). Furthermore, asialofetuin injection abolished the ADAMTS13-mediated reduction of VWF-rich vaso-occlusions (Figure 7A-B). To determine whether clearance of VWF fragments by liver macrophages is also important for the protective effects of ADAMTS13 treatment in other VOE models, we treated 2-month-old S/S mice challenged with hypoxia followed by reoxygenation with ADAMTS13 or vehicle. In some ADAMTS13-treated mice, asialofetuin was injected to inhibit the clearance of VWF by macrophages. ADAMTS13 reduced VWF-positive vaso-occlusions, and this protective effect was blocked by asialofetuin-mediated blockage of VWF clearance in macrophages (supplemental Figure 12). These data demonstrate that desialylation-dependent clearance of ADAMTS13-cleaved VWF is important during the treatment of VOE.
Shorter forms of VWF are adhesive to erythrocytes and cleared in a desialylation-dependent manner. (A) Representative confocal microscopic images comparing VWF clearance (left) and vaso-occlusion (middle and right) in the liver of ADAMTS13-treated S/S mice with fetuin or asialofetuin coinjection. White arrow indicates shorter forms of VWF. The sections were stained with primary antibodies to erythrocytes (Ter119), macrophages (F4/80), and VWF. Data represent at least 4 independent experiments. DAPI, cell nuclear staining. (B) Quantification of VWF clearance and VWF-positive vaso-occlusion in panel A, showing that asialofetuin injection reduced colocalization of VWF with macrophages and abolished the ADAMTS13-mediated reduction of VWF-rich vaso-occlusions. ∗∗P < .01; ∗∗∗P < .001, 2-tailed, unpaired Student t test. (C) Multimer analysis of purified mouse VWF with or without ADAMTS13 cleavage. Lanes 1 and 2 represent reaction mix without ADAMTS13 before and after overnight incubation at 37 °C, respectively. Lanes 3 and 4 represent reaction mix with ADAMTS13 before and after overnight incubation at 37°C, respectively. (D) Comparison of erythrocyte adhesion to flow chambers coated with ADAMTS13 (ATS)-treated or untreated VWF. Some sickle erythrocytes were preincubated with integrin blockers (20 μg/mL bocking antibody to mouse β2 [clone GAME-46], 20 μg/mL arginylglycylaspartic acid (RGD) peptide, or 20 μg/mL bocking antibody to mouse β1 [clone HM β1-1]). Data represent 3 independent experiments. (E) Quantification of adherent sickle erythrocytes per field of view (FOV). ∗∗∗∗P < .0001; 1-way ANOVA. mAb, monoclonal antibody; ns, nonsignificant.
Shorter forms of VWF are adhesive to erythrocytes and cleared in a desialylation-dependent manner. (A) Representative confocal microscopic images comparing VWF clearance (left) and vaso-occlusion (middle and right) in the liver of ADAMTS13-treated S/S mice with fetuin or asialofetuin coinjection. White arrow indicates shorter forms of VWF. The sections were stained with primary antibodies to erythrocytes (Ter119), macrophages (F4/80), and VWF. Data represent at least 4 independent experiments. DAPI, cell nuclear staining. (B) Quantification of VWF clearance and VWF-positive vaso-occlusion in panel A, showing that asialofetuin injection reduced colocalization of VWF with macrophages and abolished the ADAMTS13-mediated reduction of VWF-rich vaso-occlusions. ∗∗P < .01; ∗∗∗P < .001, 2-tailed, unpaired Student t test. (C) Multimer analysis of purified mouse VWF with or without ADAMTS13 cleavage. Lanes 1 and 2 represent reaction mix without ADAMTS13 before and after overnight incubation at 37 °C, respectively. Lanes 3 and 4 represent reaction mix with ADAMTS13 before and after overnight incubation at 37°C, respectively. (D) Comparison of erythrocyte adhesion to flow chambers coated with ADAMTS13 (ATS)-treated or untreated VWF. Some sickle erythrocytes were preincubated with integrin blockers (20 μg/mL bocking antibody to mouse β2 [clone GAME-46], 20 μg/mL arginylglycylaspartic acid (RGD) peptide, or 20 μg/mL bocking antibody to mouse β1 [clone HM β1-1]). Data represent 3 independent experiments. (E) Quantification of adherent sickle erythrocytes per field of view (FOV). ∗∗∗∗P < .0001; 1-way ANOVA. mAb, monoclonal antibody; ns, nonsignificant.
Further analysis showed that the majority of the VWF detected in the occluded vessels appeared to be shorter forms (white arrows, Figure 7A), supporting the previously unrecognized pathological role of smaller-sized VWF in VOEs. To further test this, we expressed recombinant murine VWF and generated cleaved VWF by ADAMTS13 digestion in vitro (Figure 7C). In a flow-chamber assay, sickle erythrocytes from S/S mice were perfused over the coverslips coated with ADAMTS13-treated or untreated VWF. Adhesion of sickle erythrocytes to ADAMTS13-treated VWF was higher than to untreated murine VWF (Figure 7D-E). Additionally, interaction between sickle erythrocytes and shorter forms of VWF was not inhibited by preincubation of sickle erythrocytes with blockers to integrins β1, β2, or β3 (Figure 7D-E).
Macrophage phagocytosis and efferocytosis can be modulated by several regulators, including plasminogen.49,50 Plasminogen exerts proefferocytic effects via annexin A1,50 and the annexin A1–derived peptide Ac2-26 has been shown to stimulate the phagocytosis activity of wild-type bone marrow–derived macrophages.51,52 Because the clearance of VWF is key to the protective effect of ADAMTS13 in VOE, we treated TNF-challenged S/S mice with Ac2-26 or vehicle. Immunofluorescence staining indicated that the colocalization of VWF with macrophages was increased, whereas VWF-rich vaso-occlusion was reduced in Ac2-26–treated mice relative to that in vehicle-treated mice (supplemental Figure 13A-B). This result provides a potential new therapeutic option for the treatment of VOE.
Discussion
In this study, we combined scRNA-seq and MERFISH spatial transcriptomic technologies to profile the monocyte or macrophage populations in the S/S mouse liver. The scRNA-seq provides unbiased cellular transcriptomic data, whereas MERFISH reveals the transcripts in situ with subcellular resolution, therefore retaining cellular spatial information. These complementary analyses allowed us to document transcriptionally distinct hepatic monocytes or macrophages, with some of them displaying enhanced clearance of VWF and erythrocytes in S/S mice.
A striking finding is the significant upregulation of the scavenger receptor Marco in macrophages from the liver of S/S mice as revealed by scRNA-seq, MERFISH, and immunofluorescence staining. Marco is critical in host immune defense against bacteria53 and viruses,54 and its upregulation is associated with stronger macrophage phagocytic activity.55 In mouse models of spherocytosis, hemolysis has been shown to reprogram hepatic macrophages into Marcohigh anti-inflammatory erythrophagocytes.56 Here, we found Marco upregulation in the liver of S/S mice, which was also associated with increased erythrophagocytosis. Moreover, scRNA-seq analysis showed that the Marcohigh macrophages are primarily Clef4f+ Kupffer cells and Gata6+ peritoneal macrophages, with the Clef4f+ Kupffer cells being the major cell type (accounting for ∼98%). Therefore, the Clef4f+Marcohigh Kupffer cells are the major reparative macrophage population that may help reduce tissue damage by scavenging sickle erythrocytes and VWF in S/S mice. These Clef4f+Marcohigh cells may be resident Kupffer cells or differentiated from monocyte-derived macrophages as shown by our trajectory analysis. One potential limitation of this study is the fewer number of mice used for MERFISH experiments. Nevertheless, we observed consistent and interesting findings among scRNA-seq, MERFISH, and immunofluorescence staining experiments. These findings suggest substantial dynamic changes in hepatic monocyte or macrophage populations and their different effects in SCA pathology.
Currently, Food and Drug Administration–approved hydroxyurea, l-glutamine, and crizanlizumab have been shown to reduce VOE frequency.57,58 Despite these advances, many patients still develop VOEs, which now can only be managed by supportive measures, such as analgesia and hydration.59 Recently, we and others have shown the pathological role of VWF in SCA and that ADAMTS13 supplementation reduces VOE-related tissue damage.27-29 A phase 1 clinical trial (NCT03997760) has been conducted to evaluate recombinant ADAMTS13 as a therapy for SCA.60 These data demonstrate the importance of the VWF-ADAMTS13 balance in SCA pathogenesis.30,61,62 Here, we found that macrophage-mediated clearance of VWF was increased in ADAMTS13-treated S/S mice. Depletion of macrophages or injection of asialofetuin abolished the protective effect of ADAMTS13. These data underscore the importance of VWF clearance by hepatic macrophages in SCA.
Unexpectedly, our study discovers a new pathological role of lower molecular weight VWF fragments during VOEs. In VWF biology, the well-established dogma is that only high molecular weight VWF multimers are important for mediating platelet adhesion at vascular injury sites.19,20 Increased high molecular weight VWF multimers are responsible for the pathogenesis of thrombotic disorders, such as thrombotic thrombocytopenic purpura.19,63 In contrast, the lower molecular weight VWF fragments have been less studied because of their lower hemostatic capability.64,65 According to our study, ADAMTS13-treated VWF fragments bind to sickle erythrocytes and aggravate VOE if not efficiently cleared from circulation. This is consistent with previous studies that indicate direct interactions between normal erythrocytes and VWF.66,67 In addition, it is reported that normal erythrocytes interact with intermediate molecular weight VWF with higher affinity than other VWF fragments.67 This at least partially explains the worsened phenotypes of macrophage-depleted S/S mice and provides evidence for the pathological significance of interaction between S/S erythrocytes and smaller VWF molecules. Furthermore, the erythrocyte-VWF interaction, which is different from the interaction between platelet glycoprotein 1b, alpha polypeptide (GPIbα) and high molecular weight VWF multimers, was previously found to be increased with flow reduction.67 Because circulatory stasis is characteristic in SCA, this effect may contribute to the increased S/S erythrocyte binding to smaller VWF. Our study demonstrates the previously unrecognized pathological significance of lower molecular weight VWF.
Multiple factors regulate VWF clearance, including genetic variants, ABO blood group, and sialylation.33,68,69 Hepatic macrophages express several lectin-type clearance receptors, such as MGL40 and ASGR1,43 to recognize desialylated glycan epitopes (ie, β-Gal or β-GalNAc) on VWF to mediate its clearance. In our study, injection of asialofetuin, which competitively blocked the desialylation-dependent VWF clearance,69 reduced VWF clearance in macrophages and worsened vaso-occlusion, supporting the importance of desialylation-dependent VWF clearance by hepatic macrophages during VOE. Two complex-type N-glycans on N1515 and N1574 that are close to the ADAMTS13 cleavage site on VWF (Tyr 1605-Met1606)70 protect VWF from clearance by Kupffer cells.71 These 2 N-glycans may be exposed for neuraminidase-mediated desialylation after VWF cleavage by ADAMTS13 in vivo, thus increasing desialylation-dependent VWF clearance in the mouse liver.
The increased clearance of sickle erythrocytes and VWF by Clef4f+Marcohigh Kupffer cells may also be due to the coclearance of sickle erythrocytes and VWF because sickle erythrocytes exhibit increased adhesion to ADAMTS13-treated VWF. As discussed earlier, these VWF fragments might have increased exposure of desialylated glycan epitopes for lectin-type clearance receptors, such as MGL40 and ASGR143 on Kupffer cells, which promotes the endocytosis of both VWF and VWF-adherent erythrocytes. The adherent VWF on sickle erythrocytes may interact with P-selectin and β3 integrin on activated endothelial cells to mediate sickle erythrocyte adhesion and vaso-occlusion. Therefore, clearance of the sickle erythrocyte–VWF complexes via the enhanced scavenging machinery of Clef4f+Marcohigh Kupffer cells may offset the harmful effects of these sickle erythrocyte–VWF complexes during VOE.
Ac2-26 has been found to promote the resolution of neutrophil-dependent thromboinflammation in SCA.72 Ac2-26 acts primarily through the G-protein coupled formyl peptide receptor 2 (ALX/FPR2), which is one of the important receptors expressed on macrophages. Indeed, Ac2-26 stimulates the phagocytosis activity of bone marrow–derived macrophages.51,52 ALX/FPR2 can physically and functionally interact with the scavenger receptor MARCO on microglia, a specialized macrophage type in the brain.73,74 Our scRNA-seq and MERFISH data showed enhanced expression of MARCO on Kupffer cells of S/S mouse liver. These MARCOhigh Kupffer cells interact with and internalize both sickle erythrocytes and VWF in S/S mice. In the future, it would be important to investigate (1) whether Ac2-26 enhanced VWF clearance by MARCOhigh Kupffer cells via promoting interactions of ALX/FPR2 with MARCO and/or other VWF scavenger receptors, such as LRP-1,39 MGL,40 SR-A1,41 Siglec-5,42 and ASGR143 and (2) whether these interactions regulate cellular internalization components, such as clathrin, caveolin, Cdc42, Rac1, RhoA, and MYH9.
In summary, we identify transcriptionally distinct monocyte or macrophage populations, including the restorative Clec4f+Marcohigh subset, in the liver of S/S mice using scRNA-seq and MERFISH spatial transcriptomics. Our data show that efficient clearance of VWF by Clec4f+ Kupffer cells is required for ADAMTS13’s protective effects in VOEs. Furthermore, our study demonstrates that targeting hepatic macrophages and promoting VWF clearance may be a novel therapeutic option for SCA.
Acknowledgments
The authors thank Pengchun Yu for technical support and the Center for Biomedical Data Sciences (Christopher Bottoms, Nic Cejda, David Stanford, and Nathan Pezant) at Oklahoma Medical Research Foundation for assistance in scRNA-seq and MERFISH data analysis. The visual abstract and supplemental Figure 2A were created using BioRender.
This study was supported by grants from the National Institutes of Health, National Heart, Lung, and Blood Institute (HL149860, HL153728), Presbyterian Health Foundation, and Oklahoma Center for Adult Stem Cell Research.
Authorship
Contribution: H.S. and L.X. designed research and wrote the manuscript; H.S., L.G., N.K., B.S., X.S., M.K., R.S., J.M.M., M.Z., and S.M. performed experiments and analyzed data; F.L., W.J., and A.C. contributed to data analysis; and J.N.G. contributed to the manuscript preparation.
Conflict-of-interest disclosure: The authors declare no competing financial interests.
The current affiliation for B.S. is Lindsley F. Kimball Research Institute of New York Blood Center, New York, NY.
Correspondence: Lijun Xia, Cardiovascular Biology Research Program, Oklahoma Medical Research Foundation, 825 NE 13th St, Oklahoma City, OK 73104; email: lijun-xia@omrf.org.
References
Author notes
H.S. and L.G. contributed equally to this work.
The scRNA-seq data reported in this article have been deposited in the Gene Expression Omnibus database (accession number GSE250171).
The MERFISH data reported in this article have been deposited at Zenodo at https://doi.org/10.5281/zenodo.10381341.
Original data are available on request from the corresponding author, Lijun Xia (lijun-xia@omrf.org).
The online version of this article contains a data supplement.
There is a Blood Commentary on this article in this issue.
The publication costs of this article were defrayed in part by page charge payment. Therefore, and solely to indicate this fact, this article is hereby marked “advertisement” in accordance with 18 USC section 1734.

![Shorter forms of VWF are adhesive to erythrocytes and cleared in a desialylation-dependent manner. (A) Representative confocal microscopic images comparing VWF clearance (left) and vaso-occlusion (middle and right) in the liver of ADAMTS13-treated S/S mice with fetuin or asialofetuin coinjection. White arrow indicates shorter forms of VWF. The sections were stained with primary antibodies to erythrocytes (Ter119), macrophages (F4/80), and VWF. Data represent at least 4 independent experiments. DAPI, cell nuclear staining. (B) Quantification of VWF clearance and VWF-positive vaso-occlusion in panel A, showing that asialofetuin injection reduced colocalization of VWF with macrophages and abolished the ADAMTS13-mediated reduction of VWF-rich vaso-occlusions. ∗∗P < .01; ∗∗∗P < .001, 2-tailed, unpaired Student t test. (C) Multimer analysis of purified mouse VWF with or without ADAMTS13 cleavage. Lanes 1 and 2 represent reaction mix without ADAMTS13 before and after overnight incubation at 37 °C, respectively. Lanes 3 and 4 represent reaction mix with ADAMTS13 before and after overnight incubation at 37°C, respectively. (D) Comparison of erythrocyte adhesion to flow chambers coated with ADAMTS13 (ATS)-treated or untreated VWF. Some sickle erythrocytes were preincubated with integrin blockers (20 μg/mL bocking antibody to mouse β2 [clone GAME-46], 20 μg/mL arginylglycylaspartic acid (RGD) peptide, or 20 μg/mL bocking antibody to mouse β1 [clone HM β1-1]). Data represent 3 independent experiments. (E) Quantification of adherent sickle erythrocytes per field of view (FOV). ∗∗∗∗P < .0001; 1-way ANOVA. mAb, monoclonal antibody; ns, nonsignificant.](https://ash.silverchair-cdn.com/ash/content_public/journal/blood/143/13/10.1182_blood.2023021583/1/m_blood_bld-2023-021583-gr7.jpeg?Expires=1770269210&Signature=FxR0sQu31XwI0TOz4ln5P9zuxOqMSehS1Qp-WCzFmn9hmbS~stYaCQTTZtJAIMowyxtqSsYBfDEDP7sz~-lZ2YF5bzto3Exd9QEd0zRCrMCVgd4fIgaAm-OIC4CkEc7wKvRAgG7PITBYLviSkFFAQ5pwcNCSJLdeC1cT~kiqwEPL2Vt1~NIkxm7ey1NsnM5A~MfjtHAXYOHIsy4O1Tj5lgGC08PLnUelAGh0P-y99iZGVZjOyIIn7na70t~m-uas3MJogFy5KApPYDV2vaXudVIapsDPUjstFnhlcIy~3axb4BWkYec1M6SWQaJ2~1ZSDb1SDryTWqQiD7VlFjasCw__&Key-Pair-Id=APKAIE5G5CRDK6RD3PGA)
This feature is available to Subscribers Only
Sign In or Create an Account Close Modal