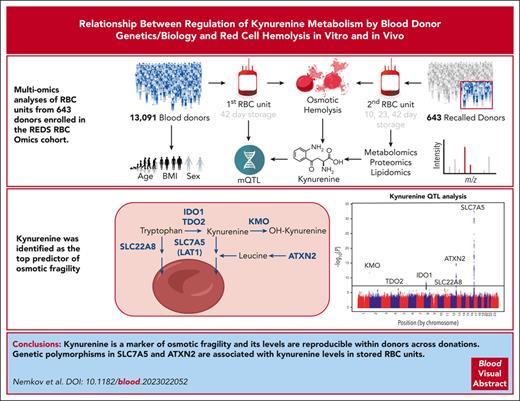
Kynurenine is a marker of osmotic fragility, and its levels are reproducible within a donor across donations.
Polymorphisms in SLC7A5, ATXN2 are associated with kynurenine levels in stored RBCs, Hgb increments, and in vivo hemolysis upon transfusion.
Visual Abstract
In the field of transfusion medicine, the clinical relevance of the metabolic markers of the red blood cell (RBC) storage lesion is incompletely understood. Here, we performed metabolomics of RBC units from 643 donors enrolled in the Recipient Epidemiology and Donor Evaluation Study, REDS RBC Omics. These units were tested on storage days 10, 23, and 42 for a total of 1929 samples and also characterized for end-of-storage hemolytic propensity after oxidative and osmotic insults. Our results indicate that the metabolic markers of the storage lesion poorly correlated with hemolytic propensity. In contrast, kynurenine was not affected by storage duration and was identified as the top predictor of osmotic fragility. RBC kynurenine levels were affected by donor age and body mass index and were reproducible within the same donor across multiple donations from 2 to 12 months apart. To delve into the genetic underpinnings of kynurenine levels in stored RBCs, we thus tested kynurenine levels in stored RBCs on day 42 from 13 091 donors from the REDS RBC Omics study, a population that was also genotyped for 879 000 single nucleotide polymorphisms. Through a metabolite quantitative trait loci analysis, we identified polymorphisms in SLC7A5, ATXN2, and a series of rate-limiting enzymes (eg, kynurenine monooxygenase, indoleamine 2,3-dioxygenase, and tryptophan dioxygenase) in the kynurenine pathway as critical factors affecting RBC kynurenine levels. By interrogating a donor-recipient linkage vein-to-vein database, we then report that SLC7A5 polymorphisms are also associated with changes in hemoglobin and bilirubin levels, suggestive of in vivo hemolysis in 4470 individuals who were critically ill and receiving single-unit transfusions.
Introduction
Blood transfusion is a life-saving intervention for millions of patients worldwide, every year, and the most common in-hospital medical procedure after vaccination. More than 100 million units of packed red blood cells (pRBCs) are stored and transfused annually around the world. Refrigerated blood-bank storage conditions promote a series of biochemical and morphological changes in pRBCs, collectively referred to as storage lesion(s).1 These changes ultimately affect the capacity of RBC to circulate in the bloodstream of recipients,2,3 thereby impairing oxygen transport and delivery, with an additional contribution to immunomodulation in the recipient.4 Recently, omics studies in transfusion medicine have improved our understanding of the pRBC storage lesion(s).5 A growing body of studies has shown that the metabolism of pRBCs is affected by storage duration,6 processing strategies (eg, leukofiltration,7 irradiation, and pathogen reduction), and donor exposures (exposome). Donor exposures include diet (eg, fatty acid composition8); consumption of alcohol,9 caffeine,10 and taurine-rich caffeinated beverages11; smoking12; and over-the-counter drugs that do not result in donor deferral.13 Furthermore, donor genetics (eg, sex,14 ethnicity,15 glucose 6-phosphate dehydrogenase status, and many other genetic traits in RBC proteins16) and other biological factors (eg, age and body mass index [BMI]17) affect pRBC storage and transfusion efficacy. Despite significant advances in the characterization of pRBC quality over and above regulatory agency–defined storage conditions or durations, most omics studies have been limited in scale to tens of pRBC units and, thus, failed to grasp the extent to which donor biology, processing strategies, or genetics affect the metabolic age of stored units (as opposed to the chronological age, ie, days elapsed since donation),18 and whether or to what extent donor genetics influences the hemolytic propensity and posttransfusion efficacy of RBC units. To bridge this gap, we leveraged the Recipient Epidemiology and Donor Evaluation Study-III (REDS-III)19 and REDS-IV-Pediatric (REDS-IV-P) research programs, both of which aimed to improve blood donor safety and optimize transfusion outcomes.20 Through integrated multiomics analyses, we identify alterations to the kynurenine pathway that are dependent on factors such as donor biology (age, BMI, and sex) and genetics and serve as a marker of in vitro and in vivo hemolytic propensity of stored RBCs upon transfusion in both murine models and in thousands of patients receiving products from donors enrolled in the REDS RBC Omics cohort.
Methods
Donor recruitment in the REDS RBC Omics study
Index donors
A total of 13 758 donors were enrolled in the REDS RBC Omics at 4 different blood centers across the United States (https://biolincc.nhlbi.nih.gov/studies/reds_iii/). Of these, 13 403 (97%) provided informed consent and 13 091 were available for metabolomics analyses in this study, henceforth referred to as “index donors.” A subset of these donors was evaluable for hemolysis parameters, including spontaneous (n = 12 753) and stress (oxidative and osmotic) hemolysis analysis (n = 10 476 and 12 799, respectively) in ∼42-day stored, leukocyte-filtered, pRBCs derived from whole-blood donations from this cohort.21 Methods for the determination of Food and Drug Administration–standard spontaneous (storage) hemolysis, osmotic hemolysis (pink test), and oxidative hemolysis upon challenge with 2,2′-azobis(2-amidinopropane) dihydrochloride have been described elsewhere.15
Recalled donors
A total of 643 donors in the 5th and 95th percentile for hemolysis parameters at the index phase of the study were invited to donate a second unit of pRBCs, a cohort henceforth referred to as “recalled donors.” These units were assayed on storage days 10, 23, and 42 for hemolytic parameters and mass spectrometry–based high-throughput metabolomics.22 A pilot study was performed on a total of 599 samples as a part of the REDS-III RBC Omics project,21 whereas the entire recalled donor cohort was assayed under a continuation of this project as part of the larger REDS-IV-P program.20 In total, 1929 serial samples (n = 643 units at 3 time points, ie, storage days 10, 23, and 42) were tested.
High-throughput metabolomics and lipidomics
Metabolomics and lipidomics analyses were performed as previously reported.22-26 Extensive details are provided in supplemental Materials and methods, available on the Blood website. For 13C1115N2-tryptophan studies (1 mM; no. 574597, Sigma), leukocyte-filtered pRBCs were incubated at 37°C for 5 minutes, 1 hour, and 16 hours.
High-throughput proteomics
Proteomics analyses were performed as described.27 Extensive details are provided in supplemental Materials and methods.
mQTL analysis
The workflow for the kynurenine metabolite quantitative trait loci (mQTL) analysis is consistent with previously described methods from our pilot mQTL study on 250 recalled donors.28 Details of the genotyping and imputation of the RBC Omics study participants have been previously described by Page et al.29 In brief, genotyping was performed using a transfusion medicine microarray,30 and the data are available in Database of Genotypes and Phenotypes (accession number phs001955.v1.p1). Imputation was performed using 811 782 single nucleotide polymorphisms (SNPs) that passed quality control. After phasing using Shape-IT,31 imputation was performed using Impute232 with the 1000 Genomes Project phase 332 all-ancestry reference haplotypes. We used the R package SNPRelate33 to calculate principal components (PCs) of ancestry. We performed association analyses for kynurenine using an additive SNP model in the R package ProbABEL34 and 13 091 study participants who had both metabolomics data and imputation data on serial samples from stored RBC components that passed respective quality control procedures. We adjusted for sex, age (continuous), and frequency of blood donation in the past 2 years (continuous), blood donor center, and 10 ancestry PCs. Statistical significance was determined using a P value threshold of 5 × 10⁻⁸. We only considered variants with a minimum minor allele frequency of 1% and a minimum imputation quality score of 0.80. The Omics Analysis, Search and Information System, a Trans-Omics for Precision Medicine Program-funded resource,35 was used to annotate the top SNPs. Omics Analysis, Search and Information System annotation includes information on position, chromosome, allele frequencies, closest gene, type of variant, position relative to closest gene model, prediction to functionally consequential, tissues-specific gene expression, and other information.
Mouse RBC storage and PTR
Mouse RBC storage and posttransfusion recovery (PTR) studies were performed as previously described,36 leveraging a population of 350 diversity outbred mice (The Jackson Laboratory Diversity Outbred) derived from extensive breeding of 8 founder strains with genetically diverse backgrounds, as described.37 All animal procedures were approved by the University of Virginia Institutional Animal Care and Use Committee (protocol no. 4269).
Determination of hemoglobin and bilirubin increment via the vein-to-vein database
Data analysis
Statistical analyses, including hierarchical clustering analysis, PC analysis, partial least square–discriminant analysis, uniform manifold approximation and projection (uMAP), correlation analyses, and Lasso regression, were performed using both MetaboAnalyst 5.039 and in-house–developed code in R (4.2.3 2023-03-15).
Results
RBC metabolism is affected by storage duration and additive solutions
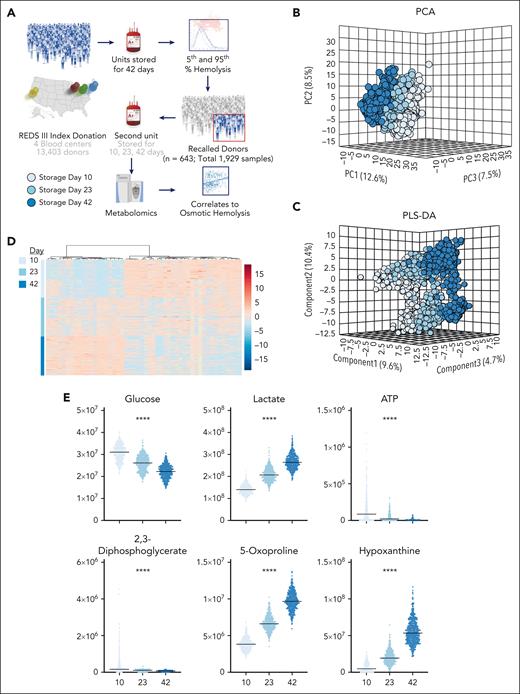
Metabolomics analyses were performed on 643 pRBCs from the recalled donor cohort on storage days 10, 23, and 42 (Figure 1A). Multivariate analyses, including PC analysis, partial least square–discriminant analysis, and hierarchical clustering analysis (Figure 1B-D) showed clustering of the 1929 samples based on storage duration and storage additive solutions, each factor explaining ∼10% of the total metabolic variance across samples. Storage significantly affected the previously identified metabolic markers of the storage lesion,40 including depletion in the levels of glucose, 2,3-diphosphoglycerate, and adenosine triphosphate and accumulation of lactate, 5-oxoproline, and hypoxanthine (Figure 1E). Further uMAP analysis suggested confirmed storage duration and additive solution as contributors to the major clustering across samples: 3 separate clusters were identified despite similar storage duration, a clustering mostly explained by a different additive solution (AS-1 vs AS-3; Figure 1F-G). Indeed, the main metabolic discriminants among these groups were AS components mannitol (highest in AS-1 in this study) and citrate (highest in AS-3, which is mannitol free; Figure 1H).
Metabolomics of the REDS RBC Omics recalled donor population. An initial screening for hemolytic propensity of RBCs at the end of storage (day 42) was performed on 13 403 index donors who were enrolled at 4 different American blood centers. Donors with the highest and lowest hemolytic parameters (5th and 95th percentile) were invited to donate a second unit of blood, and metabolomics analyses were performed on RBC units from 643 recalled donors on storage days 10, 23, and 42 (A). Unsupervised (principal component analysis [PCA]) (B), partially supervised (partial least square–discriminant analysis [PLS-DA]), (C) and hierarchical clustering analysis. Top 50 metabolites by time series analysis of variance in (D) showed a significant impact of storage duration and storage additive solutions on the metabolic variance across the 1929 samples tested in this study. Previously reported metabolic markers of the storage lesion were confirmed among the top variables increasing and decreasing over storage (E). uMAP confirmed a strong impact of storage duration and additives, though an additional subgroup was identified; 3-dimensional [3D] and 2D views (F-G). Top discriminants across these groups were AS components citrate (highest in AS-3) and mannitol (highest in AS-1 in this study) (H). ATP, adenosine triphosphate.
Metabolomics of the REDS RBC Omics recalled donor population. An initial screening for hemolytic propensity of RBCs at the end of storage (day 42) was performed on 13 403 index donors who were enrolled at 4 different American blood centers. Donors with the highest and lowest hemolytic parameters (5th and 95th percentile) were invited to donate a second unit of blood, and metabolomics analyses were performed on RBC units from 643 recalled donors on storage days 10, 23, and 42 (A). Unsupervised (principal component analysis [PCA]) (B), partially supervised (partial least square–discriminant analysis [PLS-DA]), (C) and hierarchical clustering analysis. Top 50 metabolites by time series analysis of variance in (D) showed a significant impact of storage duration and storage additive solutions on the metabolic variance across the 1929 samples tested in this study. Previously reported metabolic markers of the storage lesion were confirmed among the top variables increasing and decreasing over storage (E). uMAP confirmed a strong impact of storage duration and additives, though an additional subgroup was identified; 3-dimensional [3D] and 2D views (F-G). Top discriminants across these groups were AS components citrate (highest in AS-3) and mannitol (highest in AS-1 in this study) (H). ATP, adenosine triphosphate.
Metabolic markers of the storage lesion are poor correlates to hemolytic propensity in the REDS RBC Omics recalled donor cohort
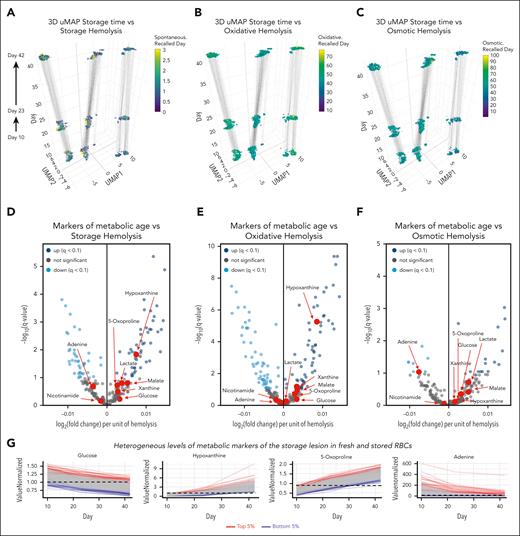
After confirming that our results were consistent with the extensive literature on the metabolic storage lesion, despite a greater than threefold larger sample size (1929 samples vs 599 of the second largest study of this kind in the literature14), we set out to determine whether the metabolic changes in stored units were associated to functional outcomes such as hemolysis. First, hemolytic parameters, including storage and oxidative and osmotic hemolysis were used to inform color coding of uMAPs of the recalled donor samples (Figure 2A-C). Although storage and oxidative hemolysis tended to increase as a function of storage duration, no significant storage duration–dependent change was observed for osmotic hemolysis (the same results are presented as line plots in supplemental Figure 1A-C). Correlation of metabolite levels to hemolysis parameters showed that of all the metabolic markers of the storage lesion,40 only increased hypoxanthine and depleted adenine were significantly associated with increased oxidative and storage hemolysis, respectively, with no significance observed for any other metabolic marker of the storage lesion (Figure 2D-F). Of note, despite significant and comparable trends across all donors over time for these metabolites, donors who ranked in the 5th or 95th percentile for select metabolic markers of the storage lesion at the earliest time point (day 10) maintained this ranking across all the 3 time points tested in this study (ie, storage days 10, 23, and 42; Figure 2G). In other terms, end-of-storage levels for a given metabolite, such as hypoxanthine were lower in donors ranking in the bottom fifth abundance percentile for hypoxanthine than they were during the early storage for donors ranking in top fifth abundance percentile (Figure 2G).
Metabolic markers of the storage lesion are poor correlates to hemolytic propensity in the REDS RBC Omics recalled donor cohort. (A-C) 3D uMAPs are color coded as a function of storage (spontaneous), oxidative, or osmotic hemolysis in the REDS RBC Omics recalled donor cohort (z-axis represent storage day, with uMAP1 and 2 calculated via uMAP). (D-F) Volcano plots indicate metabolite associations to the same hemolysis parameters, with the x-axis indicating the Spearman-determined correlation between hemolysis and metabolite levels and the y-axis indicating the −log10 of the false discovery rate–corrected P values for such associations). (G) Line plots indicate the donors in the 5th and 95th percentile (red and blue lines) for a selected metabolic markers of the storage lesion across the 3 time points (storage day 10, 23, and 42) tested for each donor (n = 643).
Metabolic markers of the storage lesion are poor correlates to hemolytic propensity in the REDS RBC Omics recalled donor cohort. (A-C) 3D uMAPs are color coded as a function of storage (spontaneous), oxidative, or osmotic hemolysis in the REDS RBC Omics recalled donor cohort (z-axis represent storage day, with uMAP1 and 2 calculated via uMAP). (D-F) Volcano plots indicate metabolite associations to the same hemolysis parameters, with the x-axis indicating the Spearman-determined correlation between hemolysis and metabolite levels and the y-axis indicating the −log10 of the false discovery rate–corrected P values for such associations). (G) Line plots indicate the donors in the 5th and 95th percentile (red and blue lines) for a selected metabolic markers of the storage lesion across the 3 time points (storage day 10, 23, and 42) tested for each donor (n = 643).
Kynurenine is a marker of osmotic fragility of stored RBCs, affected by donor age, BMI, and sex
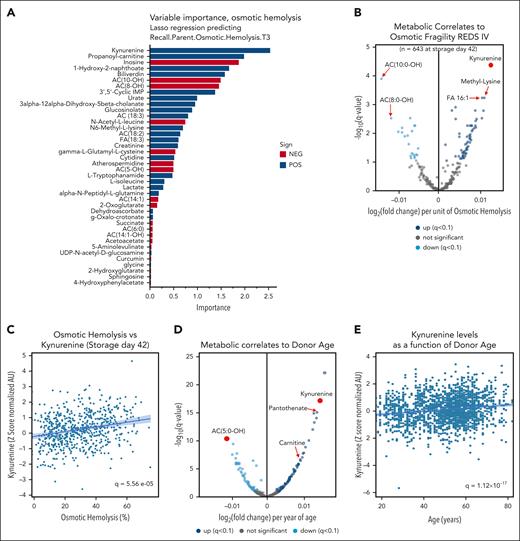
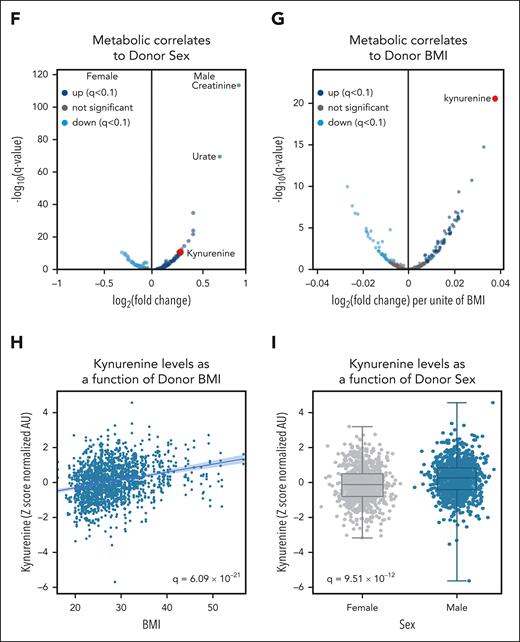
In previous studies, we and others reported on metabolic markers of storage2,41-43 and oxidative hemolysis.14 As such, here we focused on osmotic hemolysis instead and performed machine-learning Lasso regression and Spearman correlation analyses. Both approaches independently identified kynurenine as the most significant (false discovery rate–corrected P value = 5.56e−05) metabolic marker that is positively associated with osmotic fragility and hemolysis (Figure 3A-C). supplemental Figure 1D-F details the results from the machine-learning approach along with the validation testing of the Lasso regression algorithm. Kynurenine was also positively associated with oxidative hemolysis (though not as significantly, q = 2.52e-03; supplemental Figure 2A-B) but not with storage hemolysis (supplemental Figure 2C-D). The positive association between kynurenine and osmotic hemolysis held true when focusing on storage days 10, 23, or 42 (supplemental Figure 3A-C, respectively). Meta-analysis of previously published data by our group on a pilot study focusing only on 599 samples out of the 1929 of the recalled donor cohort confirmed the positive association between kynurenine levels and osmotic fragility, especially for samples stored in AS-3 (465 samples; supplemental Figure 4). Beyond processing, in the full 1929 recalled donor sample set, kynurenine levels were significantly affected by donor biology, with strong positive associations with age of the donor (second-highest ranking correlate; q = 1.12e−17) and BMI (highest ranking correlate; q = 6.09e−21; Figure 3D-H). Male donors showed significantly higher levels of kynurenine (q = 9.51e−12; Figure 3I) than female donors.
Kynurenine is a marker of osmotic fragility of stored RBCs and is affected by donor age, BMI, and sex. Machine-learning approaches were used to determine metabolic predictors of osmotic fragility of stored RBCs. Results identified kynurenine as the top predictor (A), which was confirmed via a Spearman correlation analyses (B). (C) Scatterplot of osmotic fragility vs kynurenine: x-axis and y-axis, respectively. (D-I) Volcano plots, scatter plots, or box and whisker plots showing the strong positive association between kynurenine levels and donor age, sex, and BMI. AC, acyl-carnitine; AU, arbitrary unit.
Kynurenine is a marker of osmotic fragility of stored RBCs and is affected by donor age, BMI, and sex. Machine-learning approaches were used to determine metabolic predictors of osmotic fragility of stored RBCs. Results identified kynurenine as the top predictor (A), which was confirmed via a Spearman correlation analyses (B). (C) Scatterplot of osmotic fragility vs kynurenine: x-axis and y-axis, respectively. (D-I) Volcano plots, scatter plots, or box and whisker plots showing the strong positive association between kynurenine levels and donor age, sex, and BMI. AC, acyl-carnitine; AU, arbitrary unit.
Multiomics analyses of the recalled donor samples provide insights on the molecular mechanisms of osmotic fragility in donor RBCs with elevated kynurenine
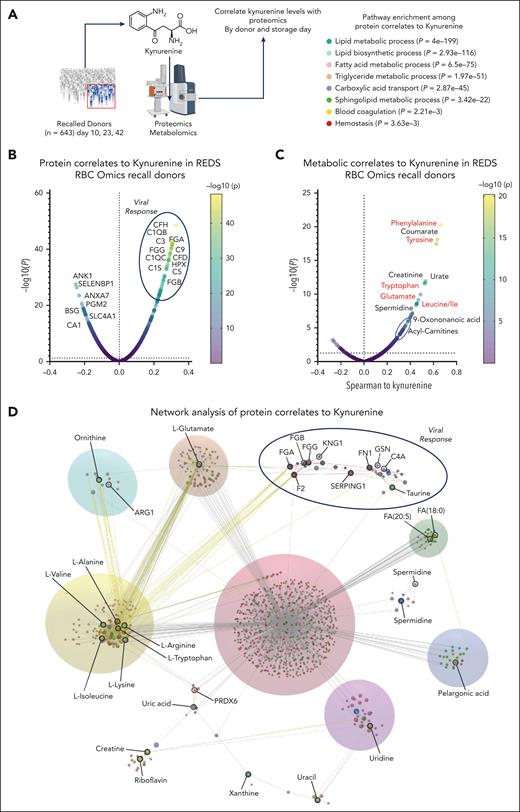
For the 643 recalled donor units (storage days 10, 23, and 42), proteomics, metabolomics, and lipidomics data were generated to identify omics correlates to kynurenine levels (Figure 4A). Results indicate a positive association between kynurenine levels and complement (C1QB, C1QC, C1SC3, C5, C9, and complement factor H) and fibrinogen alpha and gamma chains (FGA and FGG), with a parallel decrease in the levels of RBC structural and functional proteins, including osmotic fragility markers ankyrin, band 3 (SLC4A1), and associated proteins (basigin and annexin 2) (Figure 4B). At the metabolic level, increases in kynurenine were accompanied by elevation of all intracellular amino acids, especially aromatic amino acids (phenylalanine, tyrosine, and tryptophan; Figure 4C). Donors with the lowest and highest (5th and 95th percentile) osmotic fragility levels have distinct metabolic phenotypes, which are recapitulated when comparing donors with the highest and lowest kynurenine levels (supplemental Figure 5). Consistent with the correlation analyses in Figure 4C, elevated levels of both kynurenine and osmotic hemolysis were associated with higher levels of several amino acids (alanine, aspartate, citrulline, and glutamine) as well as L-carnitine and several acyl-carnitines, which are markers of damaged membrane lipid repair through the Lands cycle,44 especially hydroxyacyl-carnitines (10-OH, 12-OH, 14-OH, and 15-OH; supplemental Figure 6). Lipidomics analysis confirmed an association between increased osmotic fragility and altered lipid homeostasis at the acyl-carnitine, phosphatidylcholine, and lysophosphatidylserine level (supplemental Figure 7).
Protein and metabolite correlates to kynurenine levels in the REDS RBC Omics recalled donor cohort. (A) For the 643 recalled donor units (storage day 10, 23, and 42), proteomics and metabolomics data were generated to identify omics correlates to kynurenine levels. (B) Results indicate an enrichment between kynurenine levels and complement and fibrinogen components during a depletion in the levels of RBC structural and functional proteins. (C) At the metabolic level, increases in kynurenine were accompanied by elevation of all intracellular amino acids, especially aromatic amino acids. (D) Pathway analysis of combined metabolomics and proteomics data indicates an enrichment in components involved in viral responses, complement, and coagulation. CFD, complement factor D; CFH, complement factor H; FGA, fibrogen alpha chain; FGB, fibrinogen beta chain; FGG, fibrogen gamma chain; HPX, hemopexin.
Protein and metabolite correlates to kynurenine levels in the REDS RBC Omics recalled donor cohort. (A) For the 643 recalled donor units (storage day 10, 23, and 42), proteomics and metabolomics data were generated to identify omics correlates to kynurenine levels. (B) Results indicate an enrichment between kynurenine levels and complement and fibrinogen components during a depletion in the levels of RBC structural and functional proteins. (C) At the metabolic level, increases in kynurenine were accompanied by elevation of all intracellular amino acids, especially aromatic amino acids. (D) Pathway analysis of combined metabolomics and proteomics data indicates an enrichment in components involved in viral responses, complement, and coagulation. CFD, complement factor D; CFH, complement factor H; FGA, fibrogen alpha chain; FGB, fibrinogen beta chain; FGG, fibrogen gamma chain; HPX, hemopexin.
Integrated pathway analysis of multiomics data of 1929 RBCs from the recalled donor cohort indicates an enrichment in components involved in viral responses, complement and coagulation, and amino acid transport and metabolism (Figure 4D).
Kynurenine levels are reproducible within the same donor across multiple donation
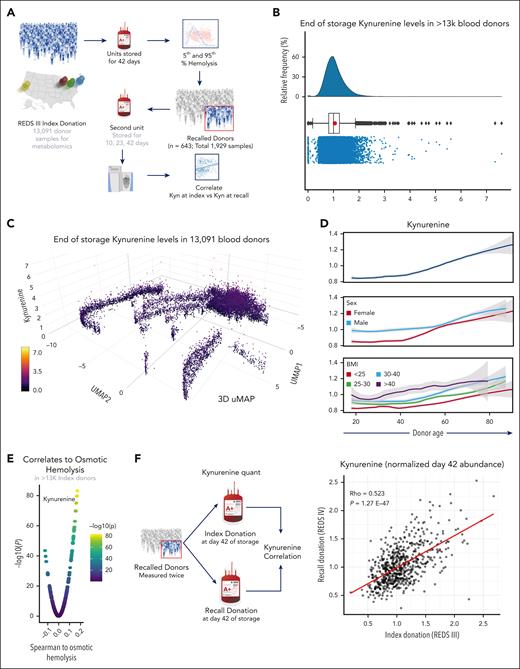
Given the identification of kynurenine as a candidate marker of osmotic fragility in the recalled donor population, we asked whether these findings could be recapitulated in samples from the 13 091 index donors for whom samples were available for targeted kynurenine measurements (Figure 5A). Kynurenine levels in the index cohort showed a rightward skewed distribution compared with median values, with up to sevenfold higher levels in some donors (Figure 5B). Unsupervised clustering of index donors by uMAP showed that kynurenine levels (z-axis) were particularly elevated in a subset of donors at the core of the clusters in the map (Figure 5C). Line plot breakdown of kynurenine level in the 13 091 index donors based on age confirmed a positive association between donor age and kynurenine (Figure 5D). Compared with female donors, male donors showed higher levels of kynurenine until the age of ∼55 years, close to the national average for menopause (age 51 years) of females in the United States (Figure 5D). Donor BMI was positively associated with kynurenine levels, further confirming the associations with those from the recalled donor cohort (Figure 3) in this 20-fold larger validation cohort. Correlation analysis to osmotic fragility showed a strong positive correlation between kynurenine levels and osmotic fragility in the index donor cohort (P = 2.02e−70; Figure 5E), validating findings in the smaller recalled donor cohort. Because 643 donors were enrolled both in the index and recalled donor cohort, day-42 levels of kynurenine in 2 independent pRBC units donated by these donors within 2-to-12-month timeframe were correlated to determine the degree of reproducibility in the end-of-storage levels of this metabolite across donations (Figure 5F). This correlation was indeed observed (ρ = 0.523; P = 1.27e−47; Figure 5F), suggesting that a potential genetic component might regulate kynurenine levels in the blood donor population.
Measurement of kynurenine levels in 13 091 donors from the REDS RBC Omics index cohort. (A) Kynurenine measurements were performed on 13 091 end-of-storage (day 42) pRBC units from the REDS RBC Omics index donor cohort. (B) Kynurenine levels were found to be nonnormally distributed in this population. (C) 3D uMAP of the 13 091 donors, based on metabolomics analyses (informing uMAP1 and uMAP2) and kynurenine levels (z-axis and color scheme). This analysis highlights a subset of donors with significant elevation in kynurenine levels compared with the rest of the population. (D) Line plots show kynurenine levels (y-axis) as a function of donor age (x-axis), either alone (top) or as a function of donor sex (middle) or BMI (bottom). (E) Kynurenine levels rank among the top correlates to osmotic fragility in the index donor cohort. (F) Correlation analyses were performed for end-of-storage (day 42) kynurenine levels of the 643 donors who were screened both at index and recalled donation (2 independent blood units). Results indicated a significant level of reproducibility for kynurenine within the same donor across multiple donations in panel F. Kyn, kynurenine.
Measurement of kynurenine levels in 13 091 donors from the REDS RBC Omics index cohort. (A) Kynurenine measurements were performed on 13 091 end-of-storage (day 42) pRBC units from the REDS RBC Omics index donor cohort. (B) Kynurenine levels were found to be nonnormally distributed in this population. (C) 3D uMAP of the 13 091 donors, based on metabolomics analyses (informing uMAP1 and uMAP2) and kynurenine levels (z-axis and color scheme). This analysis highlights a subset of donors with significant elevation in kynurenine levels compared with the rest of the population. (D) Line plots show kynurenine levels (y-axis) as a function of donor age (x-axis), either alone (top) or as a function of donor sex (middle) or BMI (bottom). (E) Kynurenine levels rank among the top correlates to osmotic fragility in the index donor cohort. (F) Correlation analyses were performed for end-of-storage (day 42) kynurenine levels of the 643 donors who were screened both at index and recalled donation (2 independent blood units). Results indicated a significant level of reproducibility for kynurenine within the same donor across multiple donations in panel F. Kyn, kynurenine.
Heterogeneity in kynurenine levels is at least partly explained by genetic factors
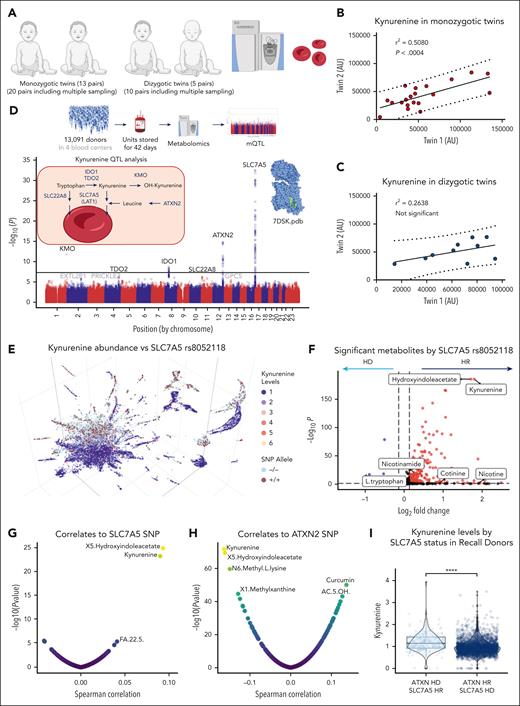
In consideration of the high degree of donor reproducibility in kynurenine levels between the REDS index and recall donor cohorts, we leveraged a cohort of monozygotic and dizygotic twins (20 and 10 samples from 13 and 5 pairs of monozygotic and dizygotic twins, respectively, owing to multiple independent sampling of most pairs) enrolled at the University of Wisconsin.42,43,45 We then performed kynurenine measurements and determined the impact of genetic backgrounds on the heritability of this metabolite (Figure 6A). Results show a significant correlation among identical twins but not among nonidentical twins (Figure 6B-C).
Interdonor heterogeneity in kynurenine levels is partly explained by genetic regulation. Kynurenine measurements in identical monozygotic twins vs nonidentical dizygotic twins (A) shows potential heritability of kynurenine levels, with stronger twin-twin correlations in the former than in the latter group (B-C). (D) mQTL analysis was performed to determine the genetic polymorphisms associated with interdonor heterogeneity in the end-of-storage kynurenine levels in the REDS RBC Omics index donor cohort (n = 13 091). (E) The 3D uMAP overlaps homozygous state for the dominant vs recessive SNP (SLC7A5, rs8052118, and intronic) associated with significant elevation in RBC kynurenine levels. (F) Volcano plot shows log2 fold-changes between the 2 groups. (G-H) Volcano plot of the Spearman association of metabolite levels to the dosage of the most significant SNP associated with kynurenine levels. (I) The lowest kynurenine levels were observed in donors who were homozygous dominant for SLC7A5 and recessive for ATXN2. FA, fatty acid; HD, homozygous dominant; HR, homozygous recessive; KMO, kynurenine monooxygenase; TDO, tryptophan dioxygenase.
Interdonor heterogeneity in kynurenine levels is partly explained by genetic regulation. Kynurenine measurements in identical monozygotic twins vs nonidentical dizygotic twins (A) shows potential heritability of kynurenine levels, with stronger twin-twin correlations in the former than in the latter group (B-C). (D) mQTL analysis was performed to determine the genetic polymorphisms associated with interdonor heterogeneity in the end-of-storage kynurenine levels in the REDS RBC Omics index donor cohort (n = 13 091). (E) The 3D uMAP overlaps homozygous state for the dominant vs recessive SNP (SLC7A5, rs8052118, and intronic) associated with significant elevation in RBC kynurenine levels. (F) Volcano plot shows log2 fold-changes between the 2 groups. (G-H) Volcano plot of the Spearman association of metabolite levels to the dosage of the most significant SNP associated with kynurenine levels. (I) The lowest kynurenine levels were observed in donors who were homozygous dominant for SLC7A5 and recessive for ATXN2. FA, fatty acid; HD, homozygous dominant; HR, homozygous recessive; KMO, kynurenine monooxygenase; TDO, tryptophan dioxygenase.
We, thus, performed an mQTL analysis based on kynurenine measurements in 13 091 index donors, from which 879 000 SNPs had been monitored through a precision transfusion medicine array.30 Previously, our pilot mQTL analysis of 250 out of the 643 recalled donors was not sufficiently powered to identify SNPs associated with heterogeneous kynurenine levels in RBC units (supplemental Figure 8). However, mQTL analysis of the larger REDS RBC Omics index donor cohort generated significant associations, among which the association with the largest magnitude was located with the coding region for the transporter for kynurenine46,47 and its precursor tryptophan,48 SLC7A5, also known as LAT1 (Figure 6D), followed by ataxin 2 (ATXN2). These hits were followed by the identification of significant SNPs on the rate-limiting enzymes for kynurenine synthesis and metabolism, kynurenine monooxygenase, indoleamine 2,3-dioxygenase (IDO1), tryptophan dioxygenase, and another tryptophan transporter, SLC22A8 (Figure 6D). Locus zoom plots for these hits are shown in supplemental Figure 9. Because SLC7A5 is a well-established transporter for tryptophan (other than branched chain amino acids),48 we incubated RBCs with 13C15N-tryptophan to determine whether labeled tryptophan uptake and conversion to kynurenine could be observed in mature RBCs (supplemental Figure 10A). Results confirmed the uptake of labeled tryptophan in mature RBCs upon a 16-hour incubation at 37°C (extract ion chromatogram and representative spectra in supplemental Figure 10B-C), with minimal (<5%) conversion to kynurenine (supplemental Figure 10D). In light of the aforementioned results, we hypothesized that the variance in RBC kynurenine levels at the time of donation could be explained by uptake of varying levels of circulating plasma kynurenine. To test this hypothesis and expand on the relevance of our findings beyond transfusion medicine, we mined publicly available databases in which metabolomics analyses had been reportedly performed by matching RBC and plasma samples, including the WALK-PhASST sickle-cell disease cohort (n = 584; supplemental Figure 11A-B)49 and the COVIDOME Explorer50 cohort (n = 65 patients with positive and negative COVID-19 statuses; supplementary Figure 11C-D). Unsupervised correlation analyses of RBC kynurenine levels to the plasma metabolome in both data sets identified plasma kynurenine as the top positive correlate (ρ = 0.4; q = 7.45e−10 and ρ = 0.6; q = 1.37e−05, respectively), followed by plasma hydroxyindoleacetate in both data sets (supplemental Figure 11).
Polymorphisms in SLC7A5 and ATXN2 are associated with high and low kynurenine levels, respectively
The uMAP of index donors color coded based on kynurenine levels showed a strong overlap with the gene dosage of the top SNP for SLC7A5 (rs8052118, intronic; Figure 6E). Indeed, kynurenine was the top metabolite that was higher in donors who were homozygous for this SNP than in those who were homozygous for the dominant variant (Figure 6F). Using quantitative data from the gene array, we confirmed that the levels of kynurenine and hydroxyindoleacetate (same metabolic pathway) ranked as the first- and second-highest positive and negative correlates to SLC7A5 and ATXN2 SNPs, respectively (Figure 6G-H). The 2 SNPs showed an additive effect on kynurenine levels, with donors carrying the combo SLC7A5 homozygous recessive and ATXN2 homozygous dominant variants showing the highest kynurenine levels altogether (Figure 6I).
Kynurenine levels and SLC7A5 SNPs are associated with poor in vivo performance of stored RBCs upon transfusion in murine models and clinical patients
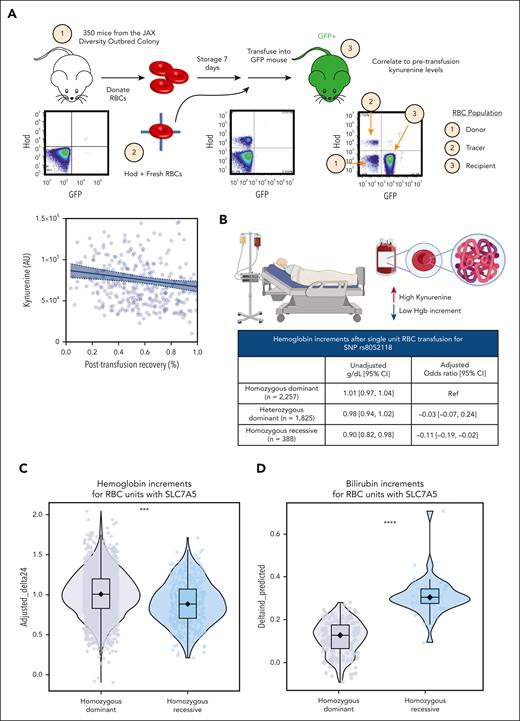
Storage and PTR studies were performed in 350 mice with extreme diverse genetics (JAX Diversity Outbred mice) to determine whether kynurenine levels in stored RBCs are not only associated with osmotic fragility in vitro but also with increased extravascular hemolysis in vivo upon transfusion (Figure 7A). Results from these extensive murine studies show a significant (P < .001) negative association between kynurenine levels and posttransfusion recoveries in mice.
Elevated kynurenine levels and associated genetic polymorphisms result in increased extravascular hemolysis and lower hemoglobin increments in murine models of storage and PTR and in patients who receive transfusion in the clinics. Storage and PTR studies were performed in 350 mice with extreme diverse genetics (JAX Diversity Outbred mice). (A) Results show a significant (P < .001) negative association between kynurenine levels and posttransfusion recoveries in mice. (B) Leveraging a vein-to-vein database, we linked kynurenine levels and associated SNP for SLC7A5 to hemoglobin and bilirubin increments in 4470 single-unit transfusion events in patients requiring transfusion from products donated by REDS RBC Omics index donors. Results indicate significantly lower hemoglobin increments (B-C) and higher bilirubin levels (D) in patients receiving transfusion with donors carrying the SLC7A5 rs8052118 SNP in homozygosity. CI, confidence interval; GFP, green fluorescence protein; HoD, hen egg lysozyme-ovalbumin-Duffy; Ref, reference.
Elevated kynurenine levels and associated genetic polymorphisms result in increased extravascular hemolysis and lower hemoglobin increments in murine models of storage and PTR and in patients who receive transfusion in the clinics. Storage and PTR studies were performed in 350 mice with extreme diverse genetics (JAX Diversity Outbred mice). (A) Results show a significant (P < .001) negative association between kynurenine levels and posttransfusion recoveries in mice. (B) Leveraging a vein-to-vein database, we linked kynurenine levels and associated SNP for SLC7A5 to hemoglobin and bilirubin increments in 4470 single-unit transfusion events in patients requiring transfusion from products donated by REDS RBC Omics index donors. Results indicate significantly lower hemoglobin increments (B-C) and higher bilirubin levels (D) in patients receiving transfusion with donors carrying the SLC7A5 rs8052118 SNP in homozygosity. CI, confidence interval; GFP, green fluorescence protein; HoD, hen egg lysozyme-ovalbumin-Duffy; Ref, reference.
To determine the translational relevance of these findings in humans, we leveraged the RBC Omics vein-to-vein database. Through this approach, we managed to link dosage of the SLC7A5 rs8052118 SNP to hemoglobin and bilirubin increments in 4470 patients requiring transfusion from products donated by REDS RBC Omics index donors (Figure 7B). Results are suggestive of hemolysis with significantly lower hemoglobin increments (Figure 7B-C) and higher bilirubin levels (Figure 7D) in patients receiving single-unit transfusion of pRBCs from donors carrying the SLC7A5 rs8052118 SNP in homozygosity.
Discussion
In this study, we identified novel metabolic and genetic markers of osmotic fragility of stored RBCs specifically related to the levels of the tryptophan catabolite kynurenine, which were observed to be dependent upon processing strategy (AS-3), donor characteristics (especially age, BMI, and, to a lesser extent, sex), and genetics (SNPs in the regions coding for SLC7A5, ATXN2, kynurenine monooxygenase, IDO1, SLC22A8, and tryptophan dioxygenase). These findings validate the utility of this novel ultrahigh-throughput metabolomics platform by providing concordant results with independent genetic screening that indicated that the regions coding for the rate-limiting genes of the kynurenine synthesis and catabolism pathways are polymorphic across the blood donor population. Of note, the most significant hits from this study (SLC7A5) validate recent results from mQTL studies in other populations51 while expanding on the translational clinical relevance with respect to in vitro and in vivo hemolysis in murine models and thousands of human transfusion recipients of units donated from volunteers carrying such polymorphisms.
This study leveraged a multiomics approach to investigate the molecular phenotype of 1929 samples from the REDS RBC Omics recalled donor cohort and combined these results with metabolomics and genomics data from 13 091 donors in the index cohort, making this study the largest multiomics basic science investigation in the fields of transfusion medicine and hematology to date, to our knowledge. The translational relevance of these findings upon transfusion in vivo was validated in appropriate murine models as well as in 4470 transfusion events in clinical recipients with units donated by the same donors characterized with our multiomics approaches. Specifically, we found that genetic polymorphisms on SLC7A5 are associated with increased kynurenine levels, twofold higher posttransfusion bilirubin increments, and 10% lower posttransfusion hemoglobin increments, the latter 2 findings consistent with an increased in vivo hemolysis of transfused RBCs. Owing to the role of in vivo hemolysis–derived iron and heme in mediating untoward sequelae to transfusion,1 these findings are suggestive not only of a loss of potency of ∼10% of the units (incidence of rs8052118 SNP in homozygosity in the REDS cohort of 13 thousand donors) but also a potential reduction in safety of transfusion of units from these donors in recipients at risk (eg, infected with siderophilic bacteria).
Of relevance beyond transfusion medicine, SLC7A5 (LAT1) is a well-established transporter for branched chain amino acids (including leucine) and tryptophan.48 Recently, LAT1 has been shown to also mediate kynurenine uptake, a process that occurs in competition to LAT1-mediated leucine uptake.46,47 In this view, it is worth noting that all LAT1 substrates were positively associated with RBC kynurenine levels in this study, including tryptophan and leucine. Even more interestingly, genetic ablation of ATXN2 in mice has been associated with altered branched chain amino acids, tryptophan, and fatty acids metabolism,52 consistent with our finding of ATXN2 SNPs as the second most significant hit from the mQTL analysis. ATXN2 had been previously associated with higher risk to develop type 1 diabetes53 and obesity,54 here shown to be strongly positively associated with kynurenine levels.
The strength of the integrated multiomics approach is evident when considering that single omics investigations, for example, those based merely on genomics data and their association to osmotic hemolysis, had not identified genetic determinants of the kynurenine pathway as critical to RBC osmotic fragility.29 Vice versa, we show that kynurenine levels are inversely associated with protein levels of the main hits detected in our previous genome-wide association studies on osmotic fragility, especially structural proteins, such as ankyrin and SLC4A1, critical to the stability of the RBC cytoskeleton55 and, thus, directly tied to RBC susceptibility to osmotic stress. The linkage between dysregulated kynurenine levels and altered RBC membrane homeostasis was further corroborated by our lipidomics findings, which showed significant perturbation of the acyl-carnitine system, a hallmark of the Lands cycle and decreased RBC deformability (eg, after perturbations, such as exercise,56,57 or in the context of hemoglobinopathies causing sickle-cell trait,58 sickle-cell disease,59,60 or kidney dysfunction61) in RBCs from donors with elevated levels of kynurenine. Of note, proteomics data on the 1929 samples from the recalled donors showed a strong positive association between kynurenine levels and complement and coagulation components. Similar phenotypes have been reported in RBCs and plasma from patients infected by severe acute respiratory syndrome coronavirus 2 (SARS-CoV-2),27,62,63 in which activation of the cyclic GMP-AMP synthase-stimulator of interferon genes (cGAS-STING)-interferon-IDO1-kynurenine axis64-66 is a hallmark of disease severity and clinical outcomes (eg, seroconversion, ventilator-free days, and mortality).67 Genetic polymorphisms in the region coding for IDO1 were associated with heterogeneity in RBC kynurenine levels in this study. Interestingly, similar RBC metabolic alterations, including elevated kynurenine and dysregulated carnitine metabolism have been reported in donors who had been infected by flaviviruses (eg, Zika virus) up to 120 days after seroconversion and viral clearance.68 Deposition of complement components and fibrinogen chains on the RBC surface have been associated with elevated erythrocyte sedimentation rates and increased fragility,69-71 consistent with the phenotypes observed here.
Here, donor biology was observed to contribute to the heterogeneity of kynurenine levels across blood units, with male donors showing higher levels than females. Activation of interferon responses to infection shows a sex dimorphism in humans, which is consistent with the clinical observation of higher levels of kynurenine and poorer outcomes in males infected by SARS-CoV-2.64 Of note, an even stronger association was observed between kynurenine levels and BMI and age. Because BMI increases with age,72 elevated BMI has been previously associated with higher RBC susceptibility to hemolysis.17 Elevated BMI has long been associated with higher basal level of inflammation, of which kynurenine levels have been reported to be a marker in the context of viral infections, such as SARS-CoV-2.64 Similarly, it has been reported that alterations of this pathway occur in the context of elevated reticulocytosis, which can increase the risk of alloimmunization in transfusion recipients.73 Indeed, the role of the kynurenine pathway in immunomodulation, not just as a downstream target of interferon responses but rather as an immunosuppressant via agonism of aryl hydrocarbon receptor, is an active area of research in immunometabolism.74,75 In this view, it could be noted that individuals with Down syndrome are characterized by elevated interferon signaling and accumulation of kynurenine and downstream metabolites in the plasma and RBCs as a result of aberrant dosage of interferon receptors on chromosome 21.76,77 Individuals with Down syndrome are accepted as routine blood donors.
Here, the mQTL studies revealed for the first time, to our knowledge, the association between polymorphisms in the genes coding for rate-limiting enzymes of the kynurenine pathway and RBC hemolytic propensity in vitro and in vivo. Although these enzymes are all known to participate in kynurenine metabolism, for example, by fueling import and/or catabolism of its precursor tryptophan, the wide genetic heterogeneity of this pathway in large populations of healthy subjects has been so far neglected, as has the role of this pathway in the context of RBC hemolysis. As such, we believe that our findings hold implications beyond RBC transfusion per se, because they could shed light on the polymorphic nature of this pathway in humans for the extent to which genetic polymorphisms could regulate kynurenine metabolism in vivo in clinically relevant contexts beyond transfusion. In addition to the aforementioned examples of SARS-CoV-2 or Zika virus infection, a relevant mention includes sickle-cell disease, in which elevated kynurenine metabolism is linked to cardiorenal dysfunction49 and the presence in mature sickle RBCs of 6 to 7 residual mitochondria.78,79 Relevant to the field of hematology beyond transfusion medicine, here, we leverage tracing experiments with stable isotope-labeled tryptophan to conclude that RBCs can indeed uptake tryptophan, but its conversion to kynurenine in the mature erythrocyte is negligible. In contrast, mining of publicly available repositories from large-scale metabolomics studies in matched plasma and RBCs from patients with COVID-1950 and sickle cell49 revealed strong positive correlations between the plasma and RBC levels of kynurenine. Altogether, these results suggest that RBC kynurenine levels may mirror (SLC7A5-dependent) uptake from the plasma, rather than de novo synthesis, consistent with a cell-extrinsic role for erythrocyte metabolism as a viable “reporter cell” to investigate systems pathophysiology.
Finally, from a transfusion medicine perspective, this study offers a reconciling view between the thousands of reports on the RBC storage lesion1 and the lack of measurable impact of the age of blood on clinical outcomes from recent randomized clinical trials80 (as reviewed previously81). Here, we show that the metabolic markers of the storage lesion do, indeed, follow consistent trends across donors, although the rate and extent of the consumption or accumulation of metabolites during storage is dictated by the heterogeneity in the levels of these very metabolites at the earliest time points upon donation. As such, metabolites, such as kynurenine, have been hitherto ignored in small scale, basic science studies on blood storage, for the simple reason that their levels did not change significantly as a function of storage duration.
Acknowledgments
This work was supported by the REDS RBC Omics and REDS-IV-P CTLS programs, sponsored by the National Heart, Lung, and Blood Institute (NHLBI), National Institutes of Health contract 75N2019D00033 and from the NHLBI REDS-III RBC Omics project, which was supported by NHLBI contracts HHSN2682011-00001I, -00002I, -00003I, -00004I, -00005I, -00006I, -00007I, -00008I, and -00009I. A.D. was supported by funds from the NHLBI, National Institutes of Health (R21HL150032, R01HL146442, R01HL149714, R01HL148151, and R01HL161004). NR was supported by funds from the NHLBI, National Institutes of Health (R01HL126130). The content is solely the responsibility of the authors and does not necessarily represent the official views of the National Institutes of Health.
Authorship
Contribution: T.N., D.S., and A.D. performed the metabolomics analyses; M.D. and K.C.H. performed proteomics analyses; C.E., A.K., A.M., E.J.E., G.P.P., I.S.L., X.D., N.R., and A.D. performed biostatistical and bioinformatical analyses; M.S., S.K., M.P.B., and P.J.N. performed REDS RBC Omics analyses; J.C.Z. carried out animal studies; N.R. performed vein-to-vein database analyses; T.R. performed twin studies; A.M. and G.P.P. performed mQTL analyses; T.N., C.E., and A.D. prepared figures; and A.D. wrote the manuscript.
Conflict-of-interest disclosure: T.N. and A.D. are founders of Omix Technologies Inc and Altis Biosciences LLC. A.D. is a scientific advisory board member for Hemanext Inc and Macopharma Inc. The remaining authors declare no competing financial interests.
Correspondence: Angelo D’Alessandro, Department of Biochemistry and Molecular Genetics, University of Colorado Anschutz Medical Campus, 12801 East 17th Ave, Aurora, CO 80045; email: angelo.dalessandro@cuanschutz.edu.
References
Author notes
∗D.S. and T.N. contributed equally and are joint first authors.
The metabolomics data associated with this study are deposited in the Metabolic Investigations of Red Blood Cells as a Function of Aging, Genetics, Environment and Storage portal at https://mirages.shinyapps.io/REDS/.
The genomics data associated with this study were described by Page et al29 and are publicly available through the Trans-Omics for Precision Medicine REDS RBC Omics program.
The online version of this article contains a data supplement.
The publication costs of this article were defrayed in part by page charge payment. Therefore, and solely to indicate this fact, this article is hereby marked “advertisement” in accordance with 18 USC section 1734.

![Metabolomics of the REDS RBC Omics recalled donor population. An initial screening for hemolytic propensity of RBCs at the end of storage (day 42) was performed on 13 403 index donors who were enrolled at 4 different American blood centers. Donors with the highest and lowest hemolytic parameters (5th and 95th percentile) were invited to donate a second unit of blood, and metabolomics analyses were performed on RBC units from 643 recalled donors on storage days 10, 23, and 42 (A). Unsupervised (principal component analysis [PCA]) (B), partially supervised (partial least square–discriminant analysis [PLS-DA]), (C) and hierarchical clustering analysis. Top 50 metabolites by time series analysis of variance in (D) showed a significant impact of storage duration and storage additive solutions on the metabolic variance across the 1929 samples tested in this study. Previously reported metabolic markers of the storage lesion were confirmed among the top variables increasing and decreasing over storage (E). uMAP confirmed a strong impact of storage duration and additives, though an additional subgroup was identified; 3-dimensional [3D] and 2D views (F-G). Top discriminants across these groups were AS components citrate (highest in AS-3) and mannitol (highest in AS-1 in this study) (H). ATP, adenosine triphosphate.](https://ash.silverchair-cdn.com/ash/content_public/journal/blood/143/5/10.1182_blood.2023022052/1/m_blood_bld-2023-022052-gr1b.jpeg?Expires=1767752465&Signature=Z~rXrPeTkuZ~NlOHOr5mXfKkWDLLOLraXqe9vt76vwyQvs8W8Vc7KPch~rFx0xoWgPRACCPK5q3bU9TSIyQbNErtW3cz5qm6vxfqc3LnBaZ2v27Dq7Jv-tZFx-P1Ii4ARmtDBQ8-yCWnQY9twkJPUAQzpXMO6JbaloMx8vISl2xkV743ldtuW5LYi1iLSYWGSeBfXbedkV1Jy2ZHzLbM1By0pipxTUFjfZZIyAQJgoJbM9qN32lJu7-N0u5IbVMwfB1v7xoYtttAetgiI1hUgqln3uSk7kM2npLaQDILURH93mD0~5E8i1Zfua5mbDgzRWXj8gNXXBP0RS~bTM30fw__&Key-Pair-Id=APKAIE5G5CRDK6RD3PGA)
This feature is available to Subscribers Only
Sign In or Create an Account Close Modal