Key Points
sBCMA, surface antigen density, effector-to-target ratio, and TCE dose collectively mediate primary refractoriness to anti-BCMA TCE.
Strategies that reduce sBCMA shedding or enhance effector-to-target ratio circumvent primary refractoriness to anti-BCMA TCE.
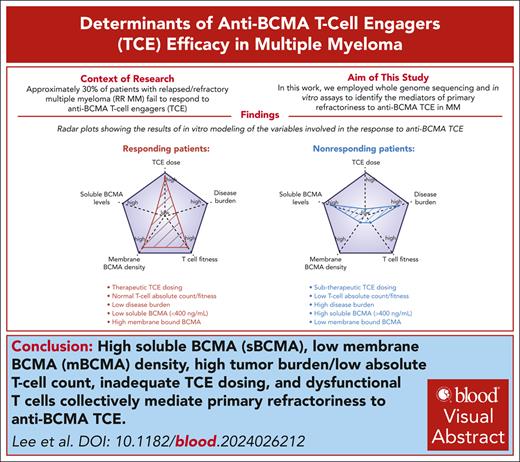
Visual Abstract
Adoptive T-cell therapy is a promising therapy for multiple myeloma (MM), but its efficacy hinges on understanding the relevant biologic and predictive markers of response. B-cell maturation antigen (BCMA) is a key target antigen in MM with active development of multiple anti-BCMA T-cell engagers (TCEs) and chimeric antigen receptor T-cell therapies. The regulation of surface BCMA expression by MM cells, which leads to shedding of soluble BCMA (sBCMA), has triggered debate about the significance of sBCMA as a predictive marker and its potential impact on treatment outcomes. To address this, we leveraged whole-genome sequencing and in vitro assays to demonstrate that sBCMA may independently predict primary refractoriness to anti-BCMA therapies. In addition to sBCMA, tumor burden and surface BCMA antigen density collectively influenced the anti-BCMA TCE cytotoxic efficacy. Correlative analyses of 163 patients treated with the anti-BCMA TCE teclistamab validated and further underscored the association between elevated baseline sBCMA (>400 ng/mL) and refractoriness. Importantly, increasing the TCE dose, using TCE against alternative targets (eg, GPRC5D), and gamma secretase inhibitors were able to overcome the high sBCMA levels. These findings highlight the importance of taking into account the baseline sBCMA levels, disease burden, and TCE dose intensity when administering anti-BCMA TCEs, thereby offering critical insights for optimizing therapeutic strategies to overcome specific high-risk features and primary anti-BCMA TCE refractoriness.
Medscape Continuing Medical Education online

In support of improving patient care, this activity has been planned and implemented by Medscape, LLC and the American Society of Hematology. Medscape, LLC is jointly accredited with commendation by the Accreditation Council for Continuing Medical Education (ACCME), the Accreditation Council for Pharmacy Education (ACPE), and the American Nurses Credentialing Center (ANCC), to provide continuing education for the healthcare team.
Medscape, LLC designates this Journal-based CME activity for a maximum of 1.0 AMA PRA Category 1 Credit(s)™. Physicians should claim only the credit commensurate with the extent of their participation in the activity.
Successful completion of this CME activity, which includes participation in the evaluation component, enables the participant to earn up to 1.0 MOC points in the American Board of Internal Medicine's (ABIM) Maintenance of Certification (MOC) program. Participants will earn MOC points equivalent to the amount of CME credits claimed for the activity. It is the CME activity provider's responsibility to submit participant completion information to ACCME for the purpose of granting ABIM MOC credit.
All other clinicians completing this activity will be issued a certificate of participation. To participate in this journal CME activity: (1) review the learning objectives; (2) study the education content; (3) take the post-test with a 75% minimum passing score and complete the evaluation at https://www.medscape.org/journal/blood; and (4) view/print certificate. For CME questions, see page 2683.
Disclosures
CME questions author Laurie Barclay, freelance writer and reviewer, Medscape, LLC, declares no competing financial interests.
Learning objectives
Upon completion of this activity, participants will:
Describe the predictive value of soluble B-cell maturation antigen (sBCMA) for identifying primary refractoriness to anti-BCMA therapies in multiple myeloma (MM) and the role of structural mutations in TNFRSF17 in anti-BCMA therapy–resistant MM, based on a genetic study using whole-genome sequencing (WGS) and in vitro assays
Determine other factors mediating primary refractoriness to anti-BCMA therapies in MM, based on a genetic study using WGS and in vitro assays
Identify clinical implications of the predictive value of sBCMA and other factors for identifying primary refractoriness to anti-BCMA therapies in MM, based on a genetic study using WGS and in vitro assays
Release date: December 19, 2024; Expiration date: December 19, 2025
Introduction
Although bispecific T-cell engagers (TCE) have yielded remarkable efficacy in multiple myeloma (MM), approximately one-third of patients are primary refractory, and the majority of responding patients eventually relapse.1-8 The mechanisms that underlie primary and secondary resistance to anti- B-cell maturation antigen (BCMA) TCEs remain only partially defined. An exhausted host T-cell repertoire before therapy initiation portends poor clinical response to TCEs in MM.9 Clinical trials have also highlighted that patient subgroups characterized by extramedullary plasmacytoma (EMD), stage III Revised International Staging System disease, or increased marrow plasmacytosis have subpar outcomes in response to anti-BCMA TCEs.1,2,4 Meanwhile, the emergence of antigen escape clones represents a recurrent mechanism of secondary resistance to anti-BCMA chimeric antigen receptor T-cell (CAR T) or TCE therapy.10-13 BCMA antigen escape occurs through biallelic deletions of TNFRSF17 or monoallelic deletion, coupled with BCMA extracellular domain (ECD) mutations. BCMA ECD mutations confer selective loss of epitopes and hence lead to the differential abrogation of anti-BCMA TCE efficacies while retaining BCMA surface expression.10
In this study, we set out to investigate the mediators of primary refractoriness to anti-BCMA TCE. Our in vitro modelling studies corroborated a cooperative effect among soluble BCMA (sBCMA), surface BCMA density, tumor burden, and TCE dose intensity as cocatalysts of primary resistance. Importantly, we clinically validated the baseline sBCMA level as a predictor of response to and survival in the presence of anti-BCMA TCE.
Methods
Patient CD138+ MM sample collection, whole-genome sequencing (WGS), and analysis
Detailed methods are outlined in the supplemental Data (available on the Blood website).
All work involving human samples was approved by the conjoint health research ethics board at the University of Calgary and are consistent with the Declaration of Helsinki. After written informed consent was obtained, serial bone marrow aspirates were collected from patients treated with anti-BCMA CAR T/TCE (supplemental Table 1).
CD138+ MM cells were isolated as previously described.10 The supplier information for reagents and antibodies used in this study are listed in supplemental Table 2. Whole-genome sequencing was performed as previously reported.10 WGS data were uploaded to the European Genome-phenome Archive (EGA) under the follow study ID: EGAS50000000546.
Our study also included a data set generated by the Multiple Myeloma Research Foundation Personalized Medicine Initiative (https://research.themmrf.org) with newly diagnosed patients with MM who were enrolled in the CoMMpass trial14 (phs000748.v1.p1).
Cell lines
OPM2_BCMAhigh cells were generated by cloning the TNFRSF17 complementary DNA sequence15 into a pLX307 lentiviral plasmid backbone. Lentiviral packaging was performed using HEK293T cells using a calcium phosphate transfection kit. The supernatant was collected after 48 hours and filtered using a 0.45-μm filter, followed by ultracentrifugation at 90 000g. The lentivirus pellet was resuspended in RPMI media and added to OPM2 cells. Transduced cells were cultured in RPMI media with puromycin.
TCE binding assay
OPM2 cells were resuspended in cell staining buffer that contained sBCMA and were incubated with TCE. The cells were washed, resuspended in cell staining buffer, and incubated with the respective secondary anti-immunoglobulin G subclass antibodies for 15 minutes at 4°C. Using flow cytometry, the anti-immunoglobulin G antibody expression levels were determined using median fluorescent intensities on single parameter histograms.
TCE and CAR T-cell cytotoxicity assay
MM cells were stained with CellTrace Violet per manufacturer protocol. Peripheral blood mononuclear cells (PBMCs) were cocultured with CellTrace Violet–stained MM cells with or without TCE for 48 hours. Calcein AM and propidium iodide were used to stain the cells to assess the target cell viabilities.
Results
Patient cohort
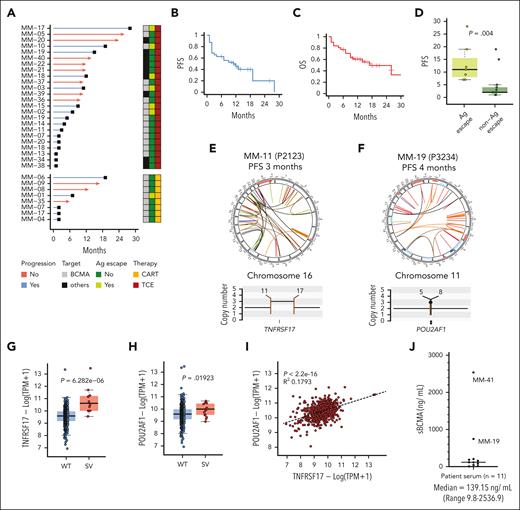
Bulk WGS of CD138+-sorted MM cells was performed on 40 samples from 27 patients with relapsed refractory MM who were treated with CAR T/TCE (median coverage, 100×; supplemental Table 1). A total of 24 patients had samples collected before treatment and 12 had samples collected at progression. Overall, 10 patients had WGS from serial samples (n = 22). Five patients (MM-07, MM-17, MM-18, MM-19, and MM-20) received >1 CAR T and/or TCE product. In terms of treatment, 22, 7, and 2 patients were treated with anti-BCMA, anti-GPRC5D, and anti-FCRL5 CAR T/TCE, respectively. The median progression-free survival (PFS) and overall survival in the 27 patients were 10 and 12 months, respectively (Figure 1A-C). Eleven patients were in remission at the last follow-up. Among 18 patients who relapsed, 12 relapsed in <6 months and were considered to have MM refractory to CAR T/TCE. Patients who were considered primary refractory to anti-BCMA CAR T/TCE are indicated in yellow in supplemental Table 1. Clinical data of the entire patient cohort are also summarized in supplemental Table 1.
Patient cohort treated with targeted T-cell therapies (n = 28). (A) Swimmer plot representing the PFS of patients treated with TCE or CAR T targeting BCMA (grey box) or other non-BCMA antigens (black box). The red line indicates ongoing response and the blue line indicates progression. The dark green box indicates patients who did not have antigen loss and the light green box indicates patients who had target antigen loss at relapse. The dark red box indicates patients who received TCE and the yellow box indicates patients who received anti-BCMA CAR T. (B) PFS of the patient population in months. (C) The OS of the patient population in months. (D) Box plot comparing the PFS of patients with or without antigen loss at relapse. (E) Circos plot of patient MM-11 based on WGS data. The outer track runs clockwise from chromosome 1 to Y. The inner track shows copy number variations (gains in blue, losses in pink). Lines inside the circle represent SVs (deletions in red, duplications in green, inversions in blue, interchromosomal translocations in black). The copy number and SV plot represents a gain of TNFRSF17. (F) Circos plot of patient MM-19 based on WGS data. The copy number and SV plot represents the gain of POU2AF1. (G) A box plot of TNFRSF17 transcript expression in samples with wild type (WT) vs those with a SV from the CoMMpass data set. (H) A box plot of POU2AF1 transcript expression in samples with WT vs those with an SV from the CoMMpass data set. (I) Dot plot representing the correlation between POU2AF1 and TNFRSF17 expression from the CoMMpass data set. (J) Dot plot depicting the sBCMA (ng/mL) levels measured by sBCMA enzyme-linked immunosorbent assay from patient serum (n = 11 samples). The black horizontal line represents the median.
Patient cohort treated with targeted T-cell therapies (n = 28). (A) Swimmer plot representing the PFS of patients treated with TCE or CAR T targeting BCMA (grey box) or other non-BCMA antigens (black box). The red line indicates ongoing response and the blue line indicates progression. The dark green box indicates patients who did not have antigen loss and the light green box indicates patients who had target antigen loss at relapse. The dark red box indicates patients who received TCE and the yellow box indicates patients who received anti-BCMA CAR T. (B) PFS of the patient population in months. (C) The OS of the patient population in months. (D) Box plot comparing the PFS of patients with or without antigen loss at relapse. (E) Circos plot of patient MM-11 based on WGS data. The outer track runs clockwise from chromosome 1 to Y. The inner track shows copy number variations (gains in blue, losses in pink). Lines inside the circle represent SVs (deletions in red, duplications in green, inversions in blue, interchromosomal translocations in black). The copy number and SV plot represents a gain of TNFRSF17. (F) Circos plot of patient MM-19 based on WGS data. The copy number and SV plot represents the gain of POU2AF1. (G) A box plot of TNFRSF17 transcript expression in samples with wild type (WT) vs those with a SV from the CoMMpass data set. (H) A box plot of POU2AF1 transcript expression in samples with WT vs those with an SV from the CoMMpass data set. (I) Dot plot representing the correlation between POU2AF1 and TNFRSF17 expression from the CoMMpass data set. (J) Dot plot depicting the sBCMA (ng/mL) levels measured by sBCMA enzyme-linked immunosorbent assay from patient serum (n = 11 samples). The black horizontal line represents the median.
Structural mutations in TNFRSF17 observed in anti-BCMA therapy–resistant MM
As we reported recently,10 antigen escape was the most common cause of secondary resistance after anti-BCMA TCE or CAR T therapy. Biallelic deletion or monoallelic deletion and mutations in TNFRSF17 were observed in 6 of 14 patients (42.8%) at relapse after anti-BCMA TCE and in 1 of 5 cases after anti-BCMA CAR T therapy.10 All cases of disease progression as a consequence of antigen escape occurred after an initial response that lasted at least 6 months (median PFS, 10 months; Figure 1D). Notably, among patients with available WGS data, all 7 patients who progressed without BCMA antigen escape after receiving anti-BCMA TCEs (MM-19, MM-14, MM-11, MM-07, MM-20, MM-18, and MM-13) (Figure 1A) were primary refractory or relapsed within 6 months. Among recipients of anti-BCMA CAR T, 5 patients relapsed without BCMA antigen escape, and of these patients, 3 had primary refractory disease (MM-04, MM-07, and MM-17) (Figure 1A). Patients with primary refractory disease to anti-BCMA therapies who had available WGS samples are highlighted in yellow in supplemental Table 1.
To explore the mechanisms responsible for driving primary refractoriness and resistance to anti-BCMA TCE or CAR T therapy apart from antigen escape, we interrogated serial WGS data collected before and after therapy in 9 patients who either had primary refractory MM (n = 8) or who progressed without antigen escape (n = 1; supplemental Table 1). Among the patients with primary refraction, structural variation (SV) events that directly or indirectly affected TNFRSF17 gene expression were noted in 3 of 8 cases, all of whom were treated with anti-BCMA CAR T or TCE therapy.
In case MM-11, WGS demonstrated a templated insertion that caused a focal gain of TNFRSF17 at relapse after anti-BCMA TCE (Figure 1E). Case MM-19 was notable for a templated insertion that caused a focal gain of a key transcription factor, POU2AF1 (Figure 1F), which is a canonical plasma cell transcription factor known to positively regulate TNFRSF17 expression.16,17 Indeed, analysis of the CoMMpass data set18 demonstrated that SV in TNFRSF17 and POU2AF1 increased the transcript expression of the respective genes (Figure 1G-H), and a positive correlation was noted between the POU2AF1 and TNFRSF17 transcript levels (Figure 1I). Because of the limited primary CD138+ MM cell availabilities from MM-11 and MM-19, conducting BCMA expression analysis by flow cytometry was not feasible. Nevertheless, we detected an elevated sBCMA level of 758 ng/mL in the peripheral blood serum of case MM-19, a level markedly higher than the median observed in our patient cohort, as shown in Figure 1J. Of note, both patient MM-19 and MM-41 (no available WGS data) who had primary refractory disease to anti-BCMA TCE had markedly elevated sBCMA (Figure 1J). Notably, after being refractory to anti-BCMA TCE, MM-19 achieved a stringent complete remission that lasted 15 months with anti-GPRC5D TCE (talquetamab). A gain of function SV of TNFRSF17 was also detected in 2 patients who were treated with anti-GPRC5D (MM-38 and MM-39) and 1 patient who was treated with an anti-BCMA antibody drug conjugate and anti-FcRL5 TCEs (MM-34) (supplemental Figure 1).
The role of sBCMA in anti-BCMA TCE cytotoxicity
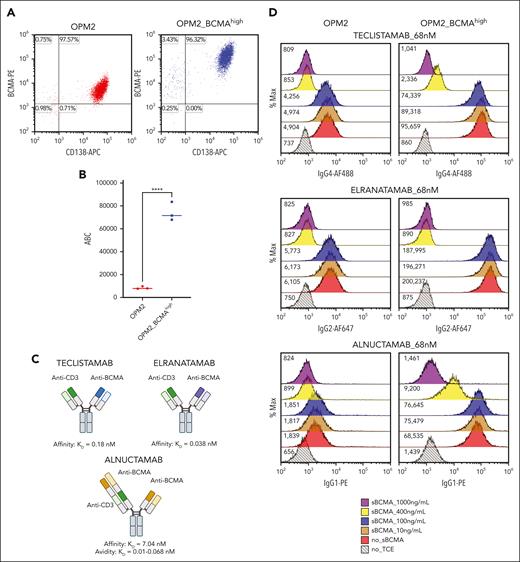
Given the observation that gain of function mutations in TNFRSF17 and markedly elevated baseline sBCMA levels are detected in cases of primary refractoriness to anti-BCMA TCEs, we set out to investigate whether a TNFRSF17 gain of function mutation with a high sBCMA level can drive anti-BCMA therapy resistance. To test this hypothesis, we generated an isogenic OPM2 cell line that stably overexpressed BCMA (OPM2_BCMAhigh) through lentiviral transduction of TNFRSF17. The transduced cells expressed significantly higher membrane-bound BCMA (mBCMA) (antibody binding per cell) and sBCMA levels (Figures 2A-B and 3D).
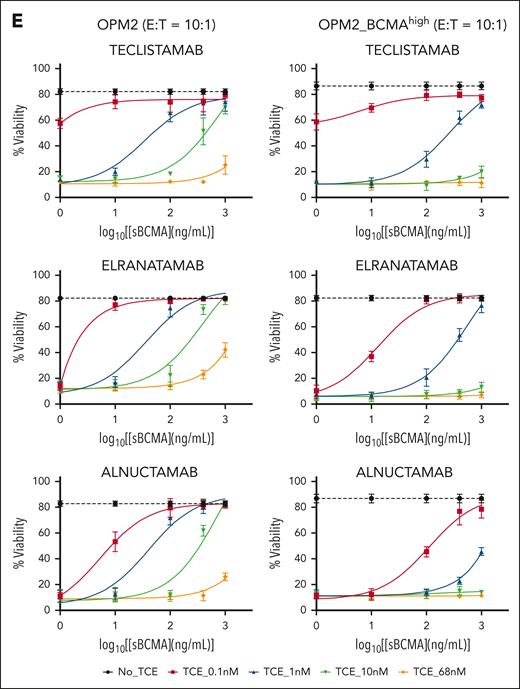
The role of sBCMA in anti-BCMA TCE cytotoxicity. (A) Surface BCMA and CD138 expression on OPM2 and OPM2_BCMAhigh cells as measured by flow cytometry. (B) ABC of anti-BCMA PE antibody, estimated using the Quantibrite PE (BD). The data represent 3 technical replicates. ∗∗∗∗P ≤ .0001. (C) The figures represent 3 different anti-BCMA TCEs, namely teclistamab, elranatamab, and alnuctamab, and their respective reported BCMA KD off rates. Figure created with BioRender.com. (D) TCE binding assay. Histograms depict binding of teclistamab, elranatamab, or alnuctamab (68 nM) on OPM2 or OPM2_BCMAhigh cells in the presence of escalating doses of recombinant sBCMA. The numbers represent median fluorescent intensities (MFIs). (E) The TCE cytotoxicity assay dose-response curve. OPM2 or OPM2_BCMAhigh target cell viability 48 hours after coculture with healthy donor PBMCs at an effector to target ratio of 10:1 with sBCMA at the indicated concentrations. The dotted black line represents the starting cell viability without the addition of TCE. The data are presented as mean values ± standard deviations. The raw values for triplicate experiments of cell viability measurement and the calculated P values are indicated in supplemental Table 4. ABC, antibody binding per cell.
The role of sBCMA in anti-BCMA TCE cytotoxicity. (A) Surface BCMA and CD138 expression on OPM2 and OPM2_BCMAhigh cells as measured by flow cytometry. (B) ABC of anti-BCMA PE antibody, estimated using the Quantibrite PE (BD). The data represent 3 technical replicates. ∗∗∗∗P ≤ .0001. (C) The figures represent 3 different anti-BCMA TCEs, namely teclistamab, elranatamab, and alnuctamab, and their respective reported BCMA KD off rates. Figure created with BioRender.com. (D) TCE binding assay. Histograms depict binding of teclistamab, elranatamab, or alnuctamab (68 nM) on OPM2 or OPM2_BCMAhigh cells in the presence of escalating doses of recombinant sBCMA. The numbers represent median fluorescent intensities (MFIs). (E) The TCE cytotoxicity assay dose-response curve. OPM2 or OPM2_BCMAhigh target cell viability 48 hours after coculture with healthy donor PBMCs at an effector to target ratio of 10:1 with sBCMA at the indicated concentrations. The dotted black line represents the starting cell viability without the addition of TCE. The data are presented as mean values ± standard deviations. The raw values for triplicate experiments of cell viability measurement and the calculated P values are indicated in supplemental Table 4. ABC, antibody binding per cell.
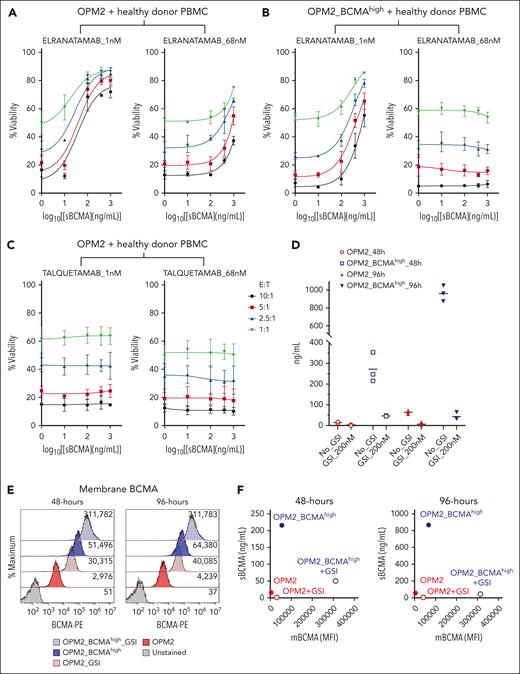
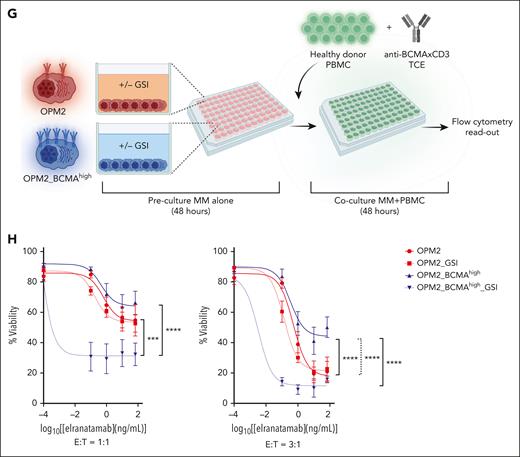
Cumulative effect of E:T ratio (tumor burden), sBCMA levels, and TCE dose intensity on anti-BCMA TCE efficacy. (A-C) The TCE cytotoxicity assay dose-response curve. OPM2 or OPM2_BCMAhigh target cell viability 48 hours after coculture with healthy donor PBMCs at the indicated E:T ratios with elranatmab (A-B) or talquetamab (C). PBMCs and TCE were mixed with sBCMA before adding the target MM cells. Raw values for the triplicate experiments of cell viability measurement and calculated P values are indicated in supplemental Tables 5-7. (D) Scatter plot representing levels of sBCMA measured from the culture media of OPM2 or OPM2_BCMAhigh cells after 48 and 96 hours. At time 0, the cells were seeded at 1 × 10⁵ cells per mL with or without GSI at a dose of 200 nM. The supernatant was collected at the respective time points and the sBCMA levels analyzed by enzyme-linked immunosorbent assay. Raw values for the triplicate experiments and the calculated P values are indicated in supplemental Table 8. (E) Flow histogram representing surface BCMA levels on OPM2 or OPM2_BCMAhigh cells treated with GSI at 200 nM at time 0. (F) Dot plot representing the ratio of sBCMA (ng/mL) to membrane BCMA (mBCMA) MFI levels at 48- and 96-hour time point. (G) Illustration of the experimental protocol. Target MM cells were resuspended in fresh media at 1 × 10⁵ cells per mL with or without GSI at time 0 and cultured alone for 48 hours to allow the accumulation of sBCMA in the media. At 48-hour mark, PBMCs and TCE were spiked into the wells and cocultured for an additional 48 hours, after which target cell viability was assessed by flow cytometry. Figure created with BioRender.com. (H) The TCE cytotoxicity assay with or without GSI. The target cell viability was assessed by flow cytometry. Raw values for the triplicate experiments of cell viability measurement and the calculated P values are indicated in supplemental Table 9. ∗∗∗P ≤ .001; ∗∗∗∗P ≤ .0001.
Cumulative effect of E:T ratio (tumor burden), sBCMA levels, and TCE dose intensity on anti-BCMA TCE efficacy. (A-C) The TCE cytotoxicity assay dose-response curve. OPM2 or OPM2_BCMAhigh target cell viability 48 hours after coculture with healthy donor PBMCs at the indicated E:T ratios with elranatmab (A-B) or talquetamab (C). PBMCs and TCE were mixed with sBCMA before adding the target MM cells. Raw values for the triplicate experiments of cell viability measurement and calculated P values are indicated in supplemental Tables 5-7. (D) Scatter plot representing levels of sBCMA measured from the culture media of OPM2 or OPM2_BCMAhigh cells after 48 and 96 hours. At time 0, the cells were seeded at 1 × 10⁵ cells per mL with or without GSI at a dose of 200 nM. The supernatant was collected at the respective time points and the sBCMA levels analyzed by enzyme-linked immunosorbent assay. Raw values for the triplicate experiments and the calculated P values are indicated in supplemental Table 8. (E) Flow histogram representing surface BCMA levels on OPM2 or OPM2_BCMAhigh cells treated with GSI at 200 nM at time 0. (F) Dot plot representing the ratio of sBCMA (ng/mL) to membrane BCMA (mBCMA) MFI levels at 48- and 96-hour time point. (G) Illustration of the experimental protocol. Target MM cells were resuspended in fresh media at 1 × 10⁵ cells per mL with or without GSI at time 0 and cultured alone for 48 hours to allow the accumulation of sBCMA in the media. At 48-hour mark, PBMCs and TCE were spiked into the wells and cocultured for an additional 48 hours, after which target cell viability was assessed by flow cytometry. Figure created with BioRender.com. (H) The TCE cytotoxicity assay with or without GSI. The target cell viability was assessed by flow cytometry. Raw values for the triplicate experiments of cell viability measurement and the calculated P values are indicated in supplemental Table 9. ∗∗∗P ≤ .001; ∗∗∗∗P ≤ .0001.
To discern the independent effects of surface BCMA density and sBCMA levels on the efficacy of anti-BCMA therapies, we first tested the binding of 3 different anti-BCMA TCEs (Figure 2C) to OPM2 vs OPM2_ BCMAhigh cells in the absence or presence of increasing concentrations of sBCMA (Figure 2D). Teclistamab and elranatamab are clinically approved anti-BCMA TCEs, and each of them contain a single anti-BCMA binding domain with a reported BCMA affinities (KD) of 0.18 nM19 and 0.038 nM,20 respectively. In contrast, alnuctamab has a distinctive asymmetric design composed of 2 anti-BCMA binding domains with each exhibiting a lower BCMA binding affinity (KD = 7.04 nM). However, because of its dual epitope binding design, the overall BCMA avidity of the molecule is reported to be higher (KD = 0.067 nM).21
The effectiveness of TCE binding to target cells was assessed at the clinically achievable trough concentration after 4 doses (Ctrough) of teclistamab and elranatamab, approximating 68 nM.2,19,20 Notably, at this concentration of TCE (68 nM), the addition of ≥400 ng/mL of recombinant sBCMA led to a reduction in TCE binding on the cell surface with complete abrogation observed at an sBCMA concentration of 1000 ng/mL, irrespective of the surface BCMA density levels (Figure 2D). Interestingly, alnuctamab exhibited a higher threshold for sBCMA reversal on OPM2_BCMAhigh cells, indicating potential resistance to the sBCMA sink effect caused by its dual BCMA binding domain. In cytotoxicity assays that involved coculture of healthy donor PBMCs with OPM2 cell lines at an effector-to-target (E:T) ratio of 10:1, sBCMA demonstrated a dose-dependent inhibitory effect that was particularly pronounced at lower TCE concentrations (Figure 2E; supplemental Figure 2A-C). Increasing the surface BCMA density (OPM2_BCMAhigh) and/or TCE concentrations alleviated the inhibitory effect of sBCMA in a dose-dependent manner. At an E:T ratio of 10:1, the effect of sBCMA was completely reversed with higher TCE doses (68 and 100 nM; Figure 2E; supplemental Figure 2A-C) in cells with higher surface BCMA density (OPM2_BCMAhigh). In summary, these results support that sBCMA competitively binds to and can inhibit anti-BCMA TCE binding to membrane BCMA at low TCE concentrations. This sink effect of sBCMA can be overcome by increasing the anti-BCMA TCE concentrations and increasing the membrane BCMA density.
Cumulative effect of E:T ratio (tumor burden), sBCMA levels, and TCE dose intensity on anti-BCMA TCE efficacy
Although an E:T ratio of 10:1 represents an ideal setting that favors tumor eradication in vitro, such favorably skewed ratio does not accurately represent patients with high disease burden, such as those with advance International Staging System stage III or high bone marrow plasmacytosis (>50%-60%). To replicate clinical conditions that are characterized by a high disease burden and elevated levels of sBCMA, we tested the effect of sBCMA in a range of E:T ratio coculture conditions. Decreasing the E:T ratio with increasing sBCMA levels significantly attenuated the efficacy of anti-BCMA TCEs (Figure 3A, left panel), an effect that was partially rescued by increasing the TCE concentration (68 vs 1 nM). Furthermore, an increased BCMA surface density (OPM2_BCMAhigh) mitigated the inhibitory effect of sBCMA (Figure 3B) but not that of the reduced E:T ratio, even at a higher TCE concentration (68 nM) (Figure 3B, right panel). As predicted, sBCMA did not interfere with the cytotoxic activity of talquetamab, a TCE that targets an alternative antigen, GPRC5D (Figure 3C). However, in this setting, the reduced cytolytic activity was maintained with a low E:T ratio. Overall these findings underscore the importance of adequate TCE dosing, reducing the sBCMA level, enhancing the surface BCMA density, and potentially favoring non-BCMA-targeting TCEs in patients with significantly elevated sBCMA levels. However, these strategies are unlikely to be sufficient to overcome TCE tumor resistance that stem from a high disease burden (unfavorable E:T ratio) that require approaches aimed at expanding the effector T-cell population or disease debulking.
GSIs improve anti-BCMA TCE response
Gamma secretase inhibitors (GSIs) have been proposed as a potential approach to enhance responses to anti-BCMA TCE and CAR T therapy.22-24 In fact, these drugs increase the BCMA density on the myeloma cell surface, thereby favoring the interactions and binding with TCE or CAR T.22-24 In addition, GSIs also reduce BCMA shedding and sBCMA levels, thereby possibly mitigating the sBCMA sink effect.22-24 To investigate the mechanisms through which GSI treatment may enhance anti-BCMA TCE cytotoxicity, OPM2 and OPM2_BCMAhigh cells were treated with nirogacestat, which inhibited the shedding of sBCMA at 48 hours and this effect persisted at 96 hours (Figure 3D). This led to a sustained increase in membrane BCMA expression (Figure 3E-F). Of note, treatment with GSI did not have an effect on MM cell viability or proliferation (supplemental Figure 3). We subsequently examined the effect of GSI on OPM2 and OPM2_BCMAhigh cell killing by anti-BCMA TCE. MM cells were cultured alone for the first 48 hours to allow the accumulation of sBCMA in the culture media, thereby mimicking in vivo conditions. Subsequently, healthy donor PBMCs and anti-BCMA TCE were added to the cultures at an E:T ratio of 1:1 or 3:1 for 48 hours (Figure 3G). The sBCMA levels from these cocultures are presented in Figure 3D. As expected, the higher E:T ratio of 3:1 led to improved killing of the target cells irrespective of their membrane BCMA density or sBCMA levels (Figure 3H, right vs left panel). Without GSI treatment at an E:T ratio of 3:1, the OPM2_BCMAhigh cells displayed increased resistance to anti-BCMA TCE when compared with OPM2 cells, despite their elevated surface BCMA expression (Figure 3H, right panel). This observed resistance reflects the inhibitory effect of accumulated sBCMA in the culture media in OPM2_BCMAhigh vs OPM2 cells (Figure 3D). In the context of low sBCMA (as seen in OPM2 cells; Figure 3H, red line), increasing the surface BCMA density with GSI did not augment the anti-BCMA TCE cytotoxicity. In contrast, GSI augmented the anti-BCMA TCE cytotoxicity in cells that produced high sBCMA levels (OPM2_BCMAhigh) (Figure 3H, blue dotted line). This enhanced cytotoxicity of anti-BCMA TCE with GSI treatment in OPM2_BCMAhigh cells when compared with OPM2 cells was more evident at a low E:T ratio (Figure 3H, left panel). Taken together, these results demonstrate the combined additive effects of sBCMA, membrane BCMA density, E:T ratio, and the TCE concentration (dose-dependent response) in regulating the anti-BCMA TCE efficacy.
Effect of sBCMA on anti-BCMA CAR T-cell cytotoxicity
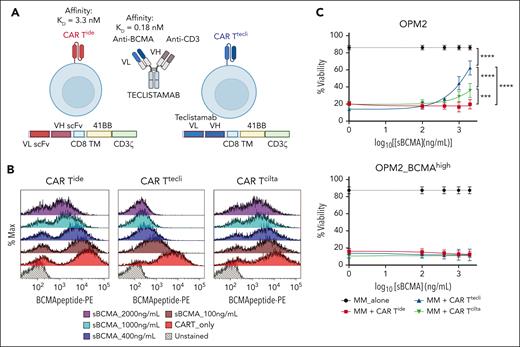
To evaluate whether sBCMA affects the cytotoxic activity of anti-BCMA CAR T therapy, we generated anti-BCMA CAR Ts with 3 distinct BCMA binding domains, namely CAR Tide, CAR Tcilta, and CAR Ttecli. CAR Tide and CAR Tcilta were generated by cloning the anti-BCMA single-chain variable fragment (scFv) sequences of idecabtagene vicleucel13 and ciltacabtagene autoleucel25 into a CAR lentiviral backbone, followed by stable transduction of healthy donor CD3+ T cells. CAR Ttecli was generated by replacing the scFv domain of CAR Tide with the anti-BCMA heavy and light chain variable fragments of teclistamab,1 as shown in Figure 4A.
Effect of sBCMA on anti-BCMA CAR T cytotoxicity. (A) Design of CAR Ttecli. Anti-BCMA scFv domain of CAR Tide was replaced with the anti-BCMA heavy and light chain variable domains of teclistamab to generate CAR Ttecli. Figure created with BioRender.com. (B) Histogram of PE-conjugated BCMA peptide binding on CAR Tide, CAR Ttecli, and CAR Tcilta in the presence of recombinant sBCMA. (C) OPM2 or OPM2_BCMAhigh cell viability 48 hours after coculture with anti-BCMA CAR T. Raw values for the triplicate experiments of cell viability measurement and calculated P values are indicated in supplemental Table 10. ∗∗∗P ≤ .001; ∗∗∗∗P ≤ .0001.
Effect of sBCMA on anti-BCMA CAR T cytotoxicity. (A) Design of CAR Ttecli. Anti-BCMA scFv domain of CAR Tide was replaced with the anti-BCMA heavy and light chain variable domains of teclistamab to generate CAR Ttecli. Figure created with BioRender.com. (B) Histogram of PE-conjugated BCMA peptide binding on CAR Tide, CAR Ttecli, and CAR Tcilta in the presence of recombinant sBCMA. (C) OPM2 or OPM2_BCMAhigh cell viability 48 hours after coculture with anti-BCMA CAR T. Raw values for the triplicate experiments of cell viability measurement and calculated P values are indicated in supplemental Table 10. ∗∗∗P ≤ .001; ∗∗∗∗P ≤ .0001.
Consistent with previous reports,22 we observed that recombinant sBCMA bound the scFv domain of anti-BCMA CAR T and competitively inhibited the binding of a BCMA peptide conjugated to phycoerythrin (PE) in a dose-dependent manner (Figure 4B). Despite detectable binding of sBCMA to CAR scFv for up to 24 hours, this binding did not induce activation of the CAR T cells, as demonstrated by the absence of activation markers, including 41BB, CD25, or CD69. We further confirmed the lack of CAR T activation by sBCMA in CAR T cells that stably expressed the nuclear factor of activated T cells–green fluorescent protein reporter (supplemental Figures 4 and 5).
Cytotoxicity assays revealed that sBCMA at a concentration of 1000 ng/mL or higher significantly attenuated the cytolytic activity of CAR Ttecli when compared with minimal or no effect on CAR Tide or CAR Tcilta (Figure 4C), which is consistent with these molecules’ BCMA binding affinities (idecabtagene vicleucel KD = 3.3 nM,26 teclistamab KD = 0.18 nM19). Of note, this inhibitory effect of sBCMA was not observed with OPM2_BCMAhigh cells, consistent with the higher avidity of anti-BCMA CARs to membrane bound vs sBCMA (Figure 4C). Hence, the in vitro cytolytic activity of anti-BCMA CAR T cells, because of their lower scFv affinity for BCMA, is less affected by sBCMA than by anti-BCMA TCEs.
High baseline sBCMA predicts the clinical outcome of anti-BCMA TCE therapy
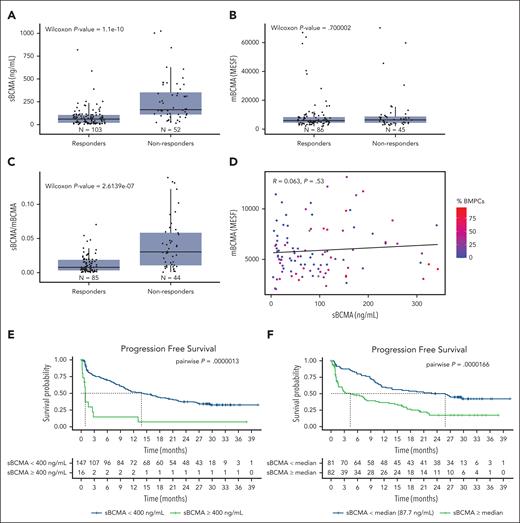
We evaluated the impact of sBCMA on the outcomes (overall response and PFS) of 163 patients with relapsed refractory MM who received teclistamab in the MajesTEC-1 clinical trial.1 Significantly lower baseline sBCMA levels and a lower soluble to mBCMA ratio were observed in responders when compared with nonresponders (Figure 5A,C). In contrast, and consistent with our preclinical observation at an E:T ratio of 1:1 without GSI (Figure 3H, left panel), a higher membrane BCMA expression did not correlate with response (Figure 5B). Furthermore, in this clinical data set, poor correlation was noted between the sBCMA levels, membrane bound BCMA, and the percentage of bone marrow plasma cells (Figure 5D).
High baseline sBCMA predicts the clinical outcome of anti-BCMA TCE therapy in the MajesTEC-1 study cohort. (A) Box plot representing the median sBCMA levels (ng/mL), (B) mBCMA levels (in MESF), and (C) sBCMA:mBCMA in responding vs nonresponding patients. (D) Dot plot representing the ratio between mBCMA and sBCMA and the bone marrow plasma cell percentage (%BMPC). (E) PFS of patients treated with teclistamab at recommended phase 2 (RP2D) based on sBCMA cutoff of 400 ng/mL. (F) PFS of patients treated with teclistamab RP2D based on the sBCMA median cutoff. MESF, molecules of equivalent soluble fluorochrome.
High baseline sBCMA predicts the clinical outcome of anti-BCMA TCE therapy in the MajesTEC-1 study cohort. (A) Box plot representing the median sBCMA levels (ng/mL), (B) mBCMA levels (in MESF), and (C) sBCMA:mBCMA in responding vs nonresponding patients. (D) Dot plot representing the ratio between mBCMA and sBCMA and the bone marrow plasma cell percentage (%BMPC). (E) PFS of patients treated with teclistamab at recommended phase 2 (RP2D) based on sBCMA cutoff of 400 ng/mL. (F) PFS of patients treated with teclistamab RP2D based on the sBCMA median cutoff. MESF, molecules of equivalent soluble fluorochrome.
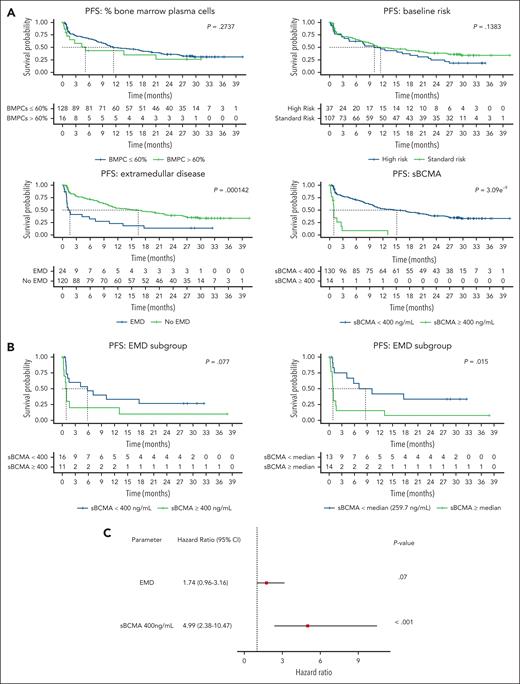
In addition to predicting the overall response, high baseline sBCMA levels above 400 ng/mL (cutoff selected based on our preclinical observation of the inhibitory effect of sBCMA, as depicted in Figure 2E) correlated with a significantly shorter PFS (Figure 5E). A shorter PFS was also noted at sBCMA levels above and below the median (87.7 ng/mL) (Figure 5F). Notably, 87.5% of patients with a sBCMA level >400 ng/mL were refractory, a proportion that was significantly higher than that in the other patients (14 of 16 vs 51 of 147; P < .0001 using a Fisher exact test). In the univariate analysis, neither a high bone marrow plasmacytosis (>60%) nor the presence of high-risk cytogenetics impacted PFS, which is in contrast with a high baseline sBCMA (≥400 ng/mL) and the presence of EMD (Figure 6A). Within the EMD subgroup in this cohort with available sBCMA data (n = 27), a high baseline sBCMA level led to even shorter survival outcomes (Figure 6B). Lastly, in a multivariate analysis that included EMD and sBCMA, only a high baseline sBCMA retained its PFS predictive value (Figure 6C; supplemental Table 11).
Univariate and multivariate analysis of PFS outcome in the MajesTEC-1 study cohort. (A) Univariate analysis of the effect of the BMPC, cytogenetic risk, extramedullary disease, and sBCMA 400 ng/mL cutoff on the PFS outcome. (B) Univariate analysis of sBCMA levels (400 ng or median cutoff) in the subgroup of patients with EMD. (C) Multivariate analysis that included EMD and sBCMA to determine the effect on PFS patient outcome.
Univariate and multivariate analysis of PFS outcome in the MajesTEC-1 study cohort. (A) Univariate analysis of the effect of the BMPC, cytogenetic risk, extramedullary disease, and sBCMA 400 ng/mL cutoff on the PFS outcome. (B) Univariate analysis of sBCMA levels (400 ng or median cutoff) in the subgroup of patients with EMD. (C) Multivariate analysis that included EMD and sBCMA to determine the effect on PFS patient outcome.
Discussion
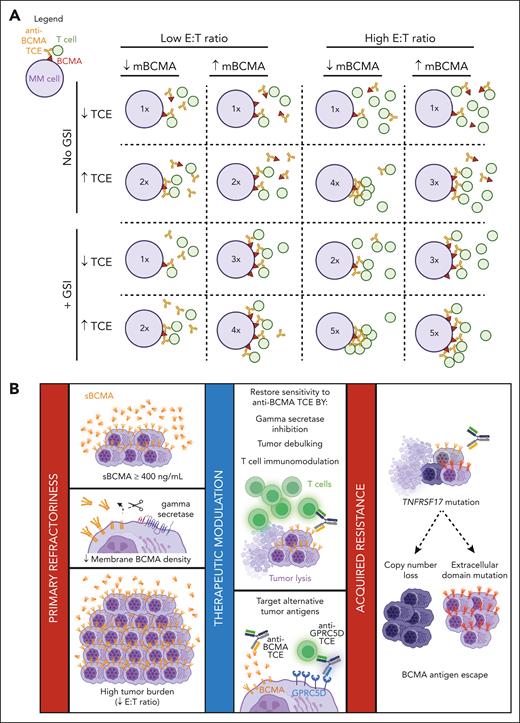
In this study, we investigated the mechanisms involved in mediating primary resistance to anti-BCMA TCEs and identified 4 variables that cumulatively accounted for their cytolytic activity. These include (1) the membrane BCMA density, (2) the sBCMA levels, (3) the E:T ratio, and (4) the TCE concentration (Figure 7A).
Schematic summary of the determinants of anti-BCMA TCE therapeutic response. (A) Anti-BCMA TCE cytotoxicity is dependent on the ratio of T-cell engagement per mBCMA molecules that is factorized by the combinatorial effect of sBCMA, mBCMA, E:T ratio, and TCE dosing. The figure is a representative schematic of the results of the experimental study in Figure 3H. Inset numbers in the circle (MM cell) represent the relative the degree of T-cell–mediated cytotoxicity, ranging from low (1×) to high (5×). (B) Summary of the determinants of anti-BCMA TCE therapeutic response. The collective effect of elevated sBCMA levels, reduced mBCMA expression, and high tumor burden (low E:T) attenuates anti-BCMA TCE efficacy and leads to primary refractory MM. Tumor sensitivity to anti-BCMA TCEs may be restored by the use of GSIs, reducing tumor bulk by other anti-MM agents or non-BCMA-targeting TCE or CAR T therapy, and by enhancing T-cell activity through immunomodulatory drugs. TCEs that target other antigens, such as GPRC5D, can also overcome the effect of high sBCMA, but not that of a high tumor burden. Acquired resistance to anti-BCMA TCE is caused by selective clonal expansion of BCMA antigen escape clones that have biallelic deletions of TNFRSF17 or mutations in the ECD of BCMA. Figure created with BioRender.com.
Schematic summary of the determinants of anti-BCMA TCE therapeutic response. (A) Anti-BCMA TCE cytotoxicity is dependent on the ratio of T-cell engagement per mBCMA molecules that is factorized by the combinatorial effect of sBCMA, mBCMA, E:T ratio, and TCE dosing. The figure is a representative schematic of the results of the experimental study in Figure 3H. Inset numbers in the circle (MM cell) represent the relative the degree of T-cell–mediated cytotoxicity, ranging from low (1×) to high (5×). (B) Summary of the determinants of anti-BCMA TCE therapeutic response. The collective effect of elevated sBCMA levels, reduced mBCMA expression, and high tumor burden (low E:T) attenuates anti-BCMA TCE efficacy and leads to primary refractory MM. Tumor sensitivity to anti-BCMA TCEs may be restored by the use of GSIs, reducing tumor bulk by other anti-MM agents or non-BCMA-targeting TCE or CAR T therapy, and by enhancing T-cell activity through immunomodulatory drugs. TCEs that target other antigens, such as GPRC5D, can also overcome the effect of high sBCMA, but not that of a high tumor burden. Acquired resistance to anti-BCMA TCE is caused by selective clonal expansion of BCMA antigen escape clones that have biallelic deletions of TNFRSF17 or mutations in the ECD of BCMA. Figure created with BioRender.com.
BCMA shedding that is mediated by the gamma secretase complex27 reduces its surface expression on MM cells and generates a sBCMA fragment that comprises the full ECD of BCMA. This sBCMA creates a potential ligand sink that acts as a decoy in the serum that can misdirect and impede the cytolytic activity of BCMA-targeting therapies. This effect was previously examined in several studies22-24,28; however, these studies did not account for other contributing factors such as disease burden (E:T ratio), per cell antigen surface expression, and TCE serum concentration. In this study, we aimed to test the role of sBCMA as a biomarker of disease response and primary refractoriness in the context of other tumor intrinsic features and anti-BCMA TCE properties (dose, affinity, and avidity). The experimental design we adopted allowed us to simultaneously evaluate the impact of incremental doses of sBCMA and membrane BCMA density at variable E:T ratios within time- and dose-dependent TCE exposures. We demonstrated that sBCMA significantly hindered anti-BCMA TCE binding and cytolytic activity. This effect was, however, mitigated by (1) increasing the TCE concentration (≥68 nM), (2) favorably skewing the E:T ratio, and (3) increasing the per cell density of membrane BCMA, as discussed further hereafter.
The relevance of adaptive and adequate dosing of anti-BCMA TCE to overcome the sink effect of high levels of sBCMA, which is frequently observed in patients with a large disease burden, was corroborated in anti-BCMA TCE clinical studies. In the recently reported trial with linvoseltamab at sBCMA levels ≥ 400 ng/mL, a 200-mg TCE dose significantly improved the overall response when compared with a dose of 50 mg.5,29 Similarly, for elranatamab at the recommended phase 2 fixed dosing of 76 mg, a higher baseline level of sBCMA (≥144 ng/mL) led to a lower probability of an objective response (Figure 44 of the New Drug Application and Biologic License Application document).20,30,31 Equally, with teclistamab at the recommended phase 2 of 1500 μg/kg, a high sBCMA level was also associated with significantly lower overall response rates,19,32,33 although there was no effect on its pharmacokinetics.34 In addition to its impact on the overall response rate, we also showed in this study that an sBCMA level of ≥400 ng/mL was associated with primary refractoriness and poor PFS in patients treated with teclistamab in the MajesTEC-1 trial. Furthermore, in a multivariate analysis, only sBCMA was the only variable retained as a predictor of PFS. Cumulatively, these observations established that high levels of sBCMA are an independent key predictive marker for primary refractoriness and survival in patients with relapsed/refractory MM who were treated with anti-BCMA TCEs.
A high disease burden is believed to present a therapeutic challenge that is shared across most adoptive T-cell therapies, including CAR T and TCEs. Using our in vitro experimental system in this study, we established the reverse correlation between the E:T ratio and the cytolytic activity of anti-BCMA and the anti-GPRC5D TCEs. Notably, although increasing TCE doses did mitigate the impact of sBCMA on anti-BCMA TCEs, it failed to fully overcome the negative impact of a high disease burden represented by a low E:T ratio. Therefore, in patients with a high disease burden, strategies aimed at expanding the effector T-cell populations with immunomodulatory drugs or cereblon E3 ligase modulatory drugs (CELMoDs) or increasing disease debulking (with combinations of anti-BCMA TCEs and anti-CD38 antibodies or other non-BCMA-targeting TCEs) are likely to improve the therapeutic efficacy of anti-BCMA TCE.35-39
GSIs have been tested as a preclinical and clinical strategy to enhance the efficacy of BCMA-targeting molecules.22-24 To better define the subgroups of patients with MM who may benefit from GSIs, we examined their effect in anti-BCMA TCE–treated cells that stably expressed variable levels of BCMA. These studies allowed us to evaluate the role of membrane-bound vs sBCMA on the anti-BCMA TCE activity. Surprisingly, GSI potentiated the anti-BCMA TCE activity only in tumors with high sBCMA levels (OPM2_BCMAhigh), independent of the E:T ratio, by reducing their sBCMA to levels comparable with that of parental OPM2 cells and significantly increasing mBCMA (as shown in Figure 3F-H). The contribution of mBCMA to TCE activity is evident at a low E:T ratio (Figure 3H, left panel) when comparing GSI-treated OPM2 with OPM2_BCMAhigh cells in which case, despite having similar sBCMA levels after GSI treatment, the higher mBCMA in OPM2_BCMAhigh cells led to an improved TCE cytolytic effect. Notably, at a high E:T ratio (3:1) and TCE concentrations above 1 nM (Figure 3H, right panel), the detrimental effect of sBCMA on TCE cytotoxicity is only evident in OPM2_BCMAhigh cells in the absence of GSI treatment when the contribution of mBCMA to TCE cytotoxicity becomes less relevant (similar TCE effect in GSI-treated OPM2_BCMAhigh vs OPM2 cells). Based on these findings, combining GSI with TCE would be beneficial only in patients with significantly elevated sBCMA levels (>400 ng/mL), irrespective of their disease burden. Lastly, noting the importance of adequate TCE dosing is the reduced TCE cytotoxicity in cells with low mBCMA at lower TCE concentrations. This detrimental effect of lower mBCMA is, however, overcome by increasing the TCE concentrations and adequate E:T ratios (3:1). Taken together, we showed in this study that anti-BCMA TCE cytotoxicity is dependent on the ratio of T-cell engagement per mBCMA molecules, which is factorized by the combinatorial effect of sBCMA, mBCMA, E:T ratio, and TCE dosing (Figure 7A).
Generally, target binders in CAR T cells are designed to have a low binding affinity and short KD off rate to enhance the serial killing of target cells and to minimize T-cell exhaustion.40 Consistent with this concept, our in vitro studies demonstrated that adding an increasing concentration of sBCMA had minimal to no effect on the cytolytic activity of CAR T cells with idecabtagene vicleucel and ciltacabtagene autoleucel BCMA binders. In contrast, the cytolytic activity of CAR T cells designed with teclistamab BCMA binding domains (higher affinity, longer KD off rate) was attenuated with higher sBCMA concentrations (>1000 ng/mL). These findings suggest that CAR T cells, when compared with anti-BCMA TCEs, may be more suitable to overcome the isolated effect of high sBCMA levels because of their generally lower anti-BCMA affinities. However, it is important to note that the efficacy of CAR T cells remains susceptible to the effect of a high disease burden that is reflected by the sBCMA level as previously shown.41-43
Finally, we validated the clinical relevance of high sBCMA at concentrations above 400 ng/mL as a predictor of primary refractoriness and survival outcomes after anti-BCMA TCE. Importantly, in our analysis, we observed no correlation between sBCMA, mBCMA molecules per cell, and the percentage of bone marrow plasma cells. This observed lack of a linear correlation between sBCMA and mBCMA suggests that the shedding of BCMA by γ−secretase is regulated by factors other than merely mBCMA expression and warrants further studies. Furthermore, the weak correlation between sBCMA and the degree of bone marrow plasmacytosis reflects the disease spatial heterogeneity and the need for more accurate tools to evaluate disease burden. Routine integration of sBCMA measurements at baseline will lead to improved stratification and the selection of patients for anti-BCMA TCEs and will enable rational design of therapeutic combination strategies aimed at disease debulking, reducing BCMA shedding, or expanding their effector T-cell population (Figure 7B). Ongoing combination trials with other anti-MM therapies (anti-CD38, immunomodulatory drugs/CELMoDs) or anti-BCMA/GPRC5D TCE combinations and sBCMA dose-adapted anti-BCMA TCE studies will provide further insight into the clinical relevance of such approaches.5,35,37,44-48
Acknowledgments
H.L. was supported by research funding from the Multiple Myeloma Research Foundation in the form of a fellow grant (10042730) and the Leukemia and Lymphoma Society of Canada (grant 10037198). P.N. was supported by the Canadian Institutes of Health Research TRANSCAN (grant 10038239) and the University Hospital Foundation (grant 10042264). N.J.B. was supported by the International Myeloma Society (grant 10039947) and the Leukemia and Lymphoma Society translational research program (grant 10040959).
Authorship
Contribution: H.L. performed in vitro experiments, analyzed results, prepared figures, and wrote the manuscript; M.D., B.Z., B.D., and M. Papadimitriou performed the whole-genome sequencing analysis; S.S. and D.V. performed all experiments and analysis that pertains to the MajesTEC-1 clinical study included in this paper; S.B., S.A., M. Poorebrahim, E.B., D.J., and N.L. performed the primary cell processing and analyzed results; A.D.C., O.L., P.N., F.M., and N.J.B contributed to patient consent, sample collection, and analyzed results; and N.J.B., F.M., and P.N. conceived, designed, and supervised the experiments and wrote the manuscript.
Conflict-of-interest disclosure: S.S. and D.V. are employees of Janssen and may have stock/other ownership interests in Janssen. The remaining authors declare no competing financial interests.
Correspondence: Nizar J. Bahlis, Department of Medicine, Hematology and Oncology, Arnie Charbonneau Cancer Institute, University of Calgary, 3330 Hospital Drive NW, Calgary, AB T2N 4N1, Canada; email: nbahlis@ucalgary.ca; and Francesco Maura, Division of Myeloma, Department of Medicine, Sylvester Myeloma Institute, Sylvester Comprehensive Cancer Center, University of Miami, 1120 NW 14th St, Room 833, Miami, FL 33136; email: fxm557@med.miami.edu.
References
Author notes
P.N., F.M., and N.J.B. contributed equally to this study.
The whole-genome sequencing data have been uploaded to EGA (study ID: EGAS50000000546) and available on reasonable request from the senior authors. This study also included a data set generated by the Multiple Myeloma Research Foundation Personalized Medicine Initiative (https://research.themmrf.org) on newly diagnosed patients with multiple myeloma who were enrolled in the CoMMpass trial (phs000748.v1.p1).
Data are available on request from the corresponding authors, Nizar J. Bahlis (nbahlis@ucalgary.ca) and Francesco Maura (fxm557@med.miami.edu).
The online version of this article contains a data supplement.
There is a Blood Commentary on this article in this issue.
The publication costs of this article were defrayed in part by page charge payment. Therefore, and solely to indicate this fact, this article is hereby marked “advertisement” in accordance with 18 USC section 1734.

This feature is available to Subscribers Only
Sign In or Create an Account Close Modal